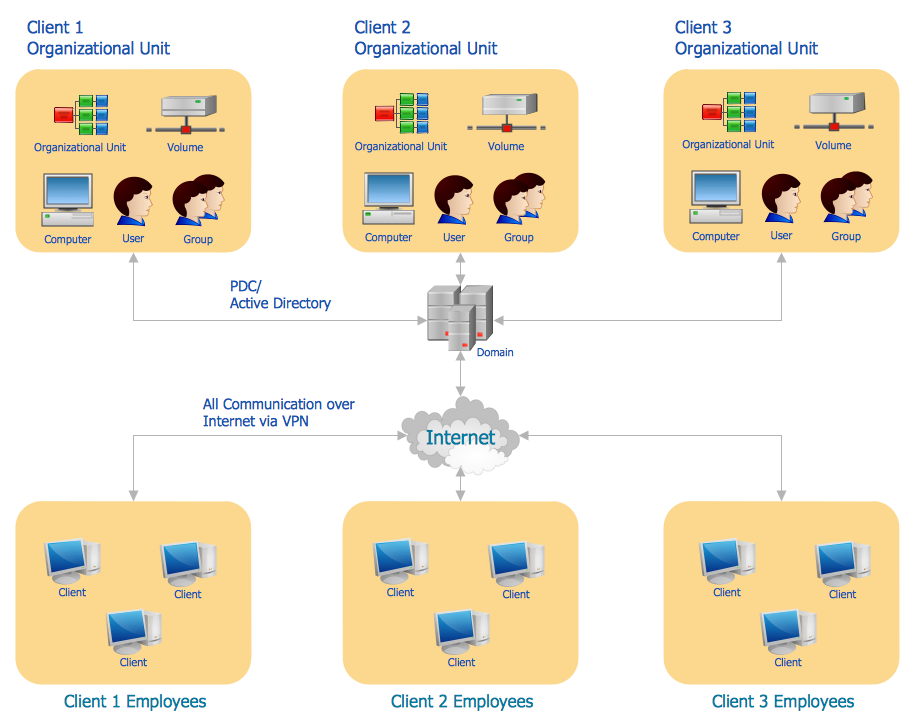
Example 1. Active Directory Diagram - Structure Diagram
Active Directory uses Lightweight Directory Access Protocol (LDAP). LDAP operates above TCP/IP and defines ways of address and access to objects between the client and Active Directory server. Accordingly to LDAP protocol each object in catalogue has its unique Distinguished Name, and this name distinguishes the object from other Active Directory objects and also prompts where the given object is located. Distinguished Name consists of common name (CN) and domain component – domain constituent. Common name defines an object or a container in which this object is positioned whereas the domain component defines the domain where this object is located. Besides in the distinguished name there could be indicated the organization which the object belongs to.
Logical elements of the Active Directory are objects, containers (OU), trees, domains and forests.
Object is a definite set of attributes having its unique name e.g. a user of the network. Accordingly to LDAP protocol, each object in the catalogue has its unique Distinguished Name and this name distinguishes it from other objects of Active Directory and also hints us where the given object is located.
Unlike the object, the container does not have physical presentation, and presents the totality of objects and other containers in the network structure.
The tree defines the hierarchy and ties between objects.
Domain is a separate safety area in the structure of the computer network. Correspondingly domains tree is the totality of domains connected between each other in a certain consecution. Domain tree can be presented in the form of a tree of established trusting relations between domains or in the form of the tree on the basis of a space of names.


The forest is the totality of several trees which do not create uninterrupted area of names. All trees of the forest have the same scheme, configuration and global catalogue. All trees are connected by trusting relations by the Kerberos protocol. The forest in contrast to a tree must not have a distinguished name. The forest exists as the totality of objects, cross links and trusting relations by the Kerberos protocol, known to trees which form this forest.

Site is a location in the network, where servers of services of Active Directory catalogues are kept. Active Directory diagram represents the scheme of correlations of service components with the preset degree of the detailed elaboration. For example this can be the level of objects or the level of sites.

Designing the Active Directory Diagram in ConceptDraw DIAGRAM use the extensive drawing tools of the Active Directory Diagrams Solution, templates, samples, and variety of ready-to-use objects from the solution's libraries.

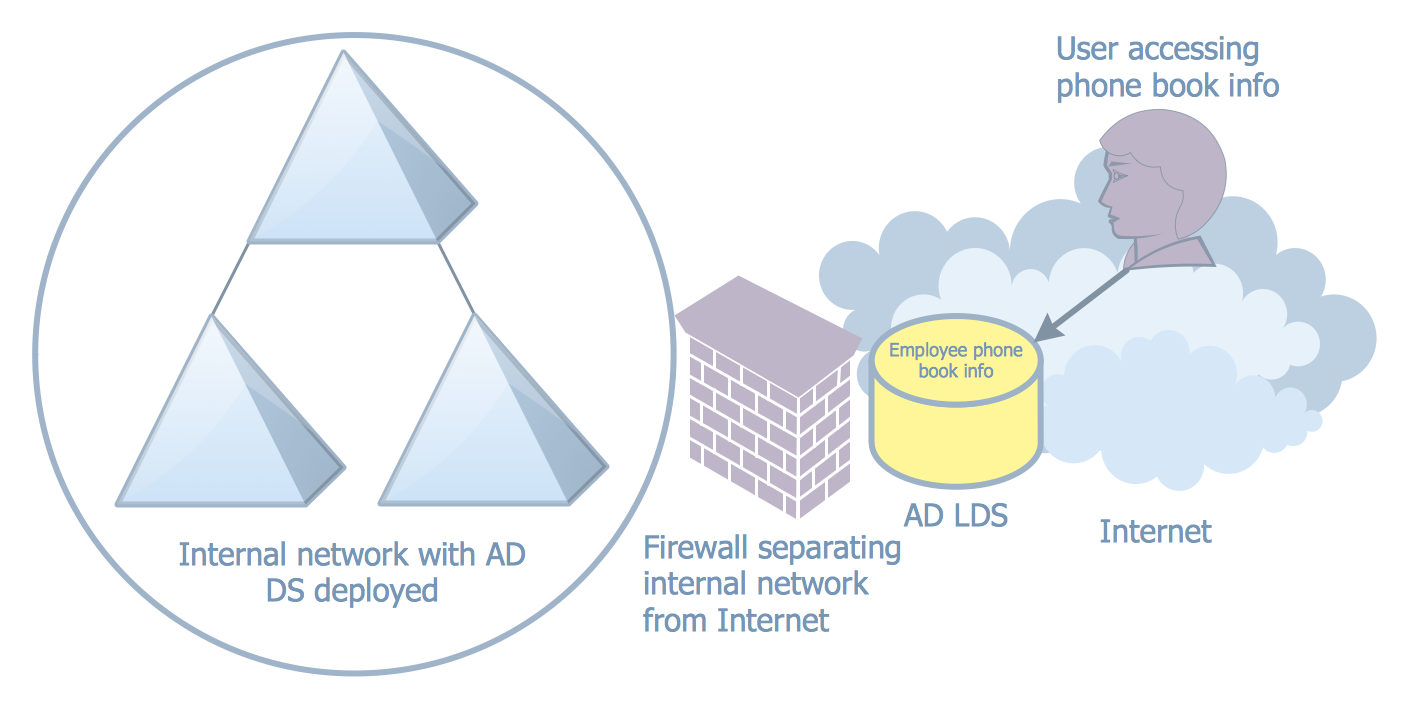
Example 2. Active Directory Diagram - AD LDS as a Phone Book Service
Active Directory Diagram also allows to present the network structure in graphical format using the vector elements and symbols that all can be found in Active Directory Diagrams Solution from the Computer and Networks Area of ConceptDraw DIAGRAM software and ConceptDraw STORE application is an inalienable part of our product developed especially for such purpose: to make life easier in terms of helping our clients grow and succeed in their business.

Example 3. Active Directory Diagram in ConceptDraw STORE
All source documents are vector graphic documents. They are available for reviewing, modifying, or converting to a variety of formats (PDF file, MS PowerPoint, MS Visio, and many other graphic formats) from the ConceptDraw STORE. The Active Directory Diagrams Solution is available for all ConceptDraw DIAGRAM or later users.
TEN RELATED HOW TO's:
Data Flow Diagram is used to depict the flow of data through the system, where it enters and exits the system, as well as where it is stored. To simplify the process of drawing a data flow diagram (DFD), ConceptDraw DIAGRAM provides a DFD Library - design elements that will help you make your diagram as informative, streamlined and understandable as possible. Data flow diagrams are useful to create a general overview of the system or to document major data flows.
Here are the library of symbols used in data flow diagrams (DFD). Data Flow diagrams are graphic means of business process visualization. Any business process may involve the data transfer. It can be easily shown using data flow diagrams. DFDs are used to represent the processing and transformation of data within a business process. One can find out the Vector library of DFD symbols, that is a component of ConceptDraw solution for Data Flow Diagramming and is welcome to use in as addition to the common Conceptdraw DIAGRAM diagramming facilities.
Picture: DFD Library — Design elements
Related Solution:
ConceptDraw DIAGRAM diagramming and vector drawing software offers the Fault Tree Analysis Diagrams Solution from the Industrial Engineering Area of ConceptDraw Solution Park for quick and easy creating the Fault Tree Diagram of any degree of detailing.
Picture: Fault Tree Diagram
Related Solution:
Data storage is a fundamental aspect of the cloud platform. Microsoft offers scalable, durable and elastic cloud Azure Storage which can be available from any type of application whether it’s running in the cloud and anywhere in the world.
ConceptDraw DIAGRAM diagramming and vector drawing software extended with Azure Architecture Solution from the Computer and Networks area of ConceptDraw Solution Park provides a lot of useful tools which give you the possibility effectively illustrate Microsoft Azure cloud system, Azure services, Azure storage and its components.
Picture: Azure Storage
Related Solution:
VSM symbols are the best for a production process designing. The entire Value Stream Mapping method uses a graphical representation of the manufacturing process, factors' pros and cons, that all stakeholders can easily understand. Value Stream Mapping is a graphical technique that provides possibilities to improve analysis of a manufacturing process, at the stage of the transferring information or materials that required to deliver a product or service to the customer.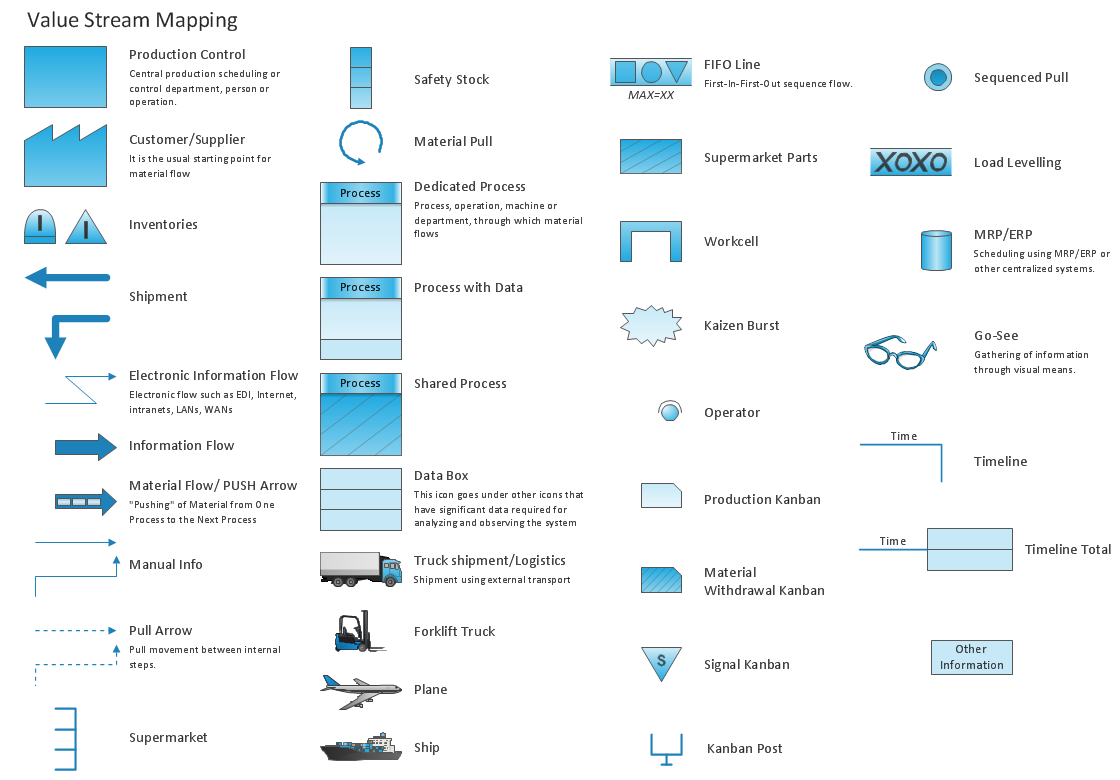
Picture: Value Stream Mapping Symbols
Related Solution:
Times when you had difficulties in searching for an appropriate software depending on your OS, had passed. If you still look for a great software to create flowcharts on Mac, here is the answer. ConceptDraw Pro is a great tool for creating diagrams, with tons of samples, libraries and tutorials.
Making flowchart diagram is the best way to represent a process as a sequence of steps. Flowcharting provides a simple way of organizing and representing data so that even complex and detailed processes become clear. That is why using a flowchart software tool is proven to be an ideal for structure and share an information on process workflow structure. This flow chart was created to depict the steps of certification process. This flow chart was created using ConceptDraw DIAGRAM software for Apple OS X. The Rapid Draw technology was used to create this flow chart. ConceptDraw DIAGRAM also supports popular Apple OS X features such as Quick Look, Full-Screen Mode, Version Browsing and Autosave. You can export your multi-page diagrams to SVG or graphic formats such as TIFF, JPEG, PNG and PDF.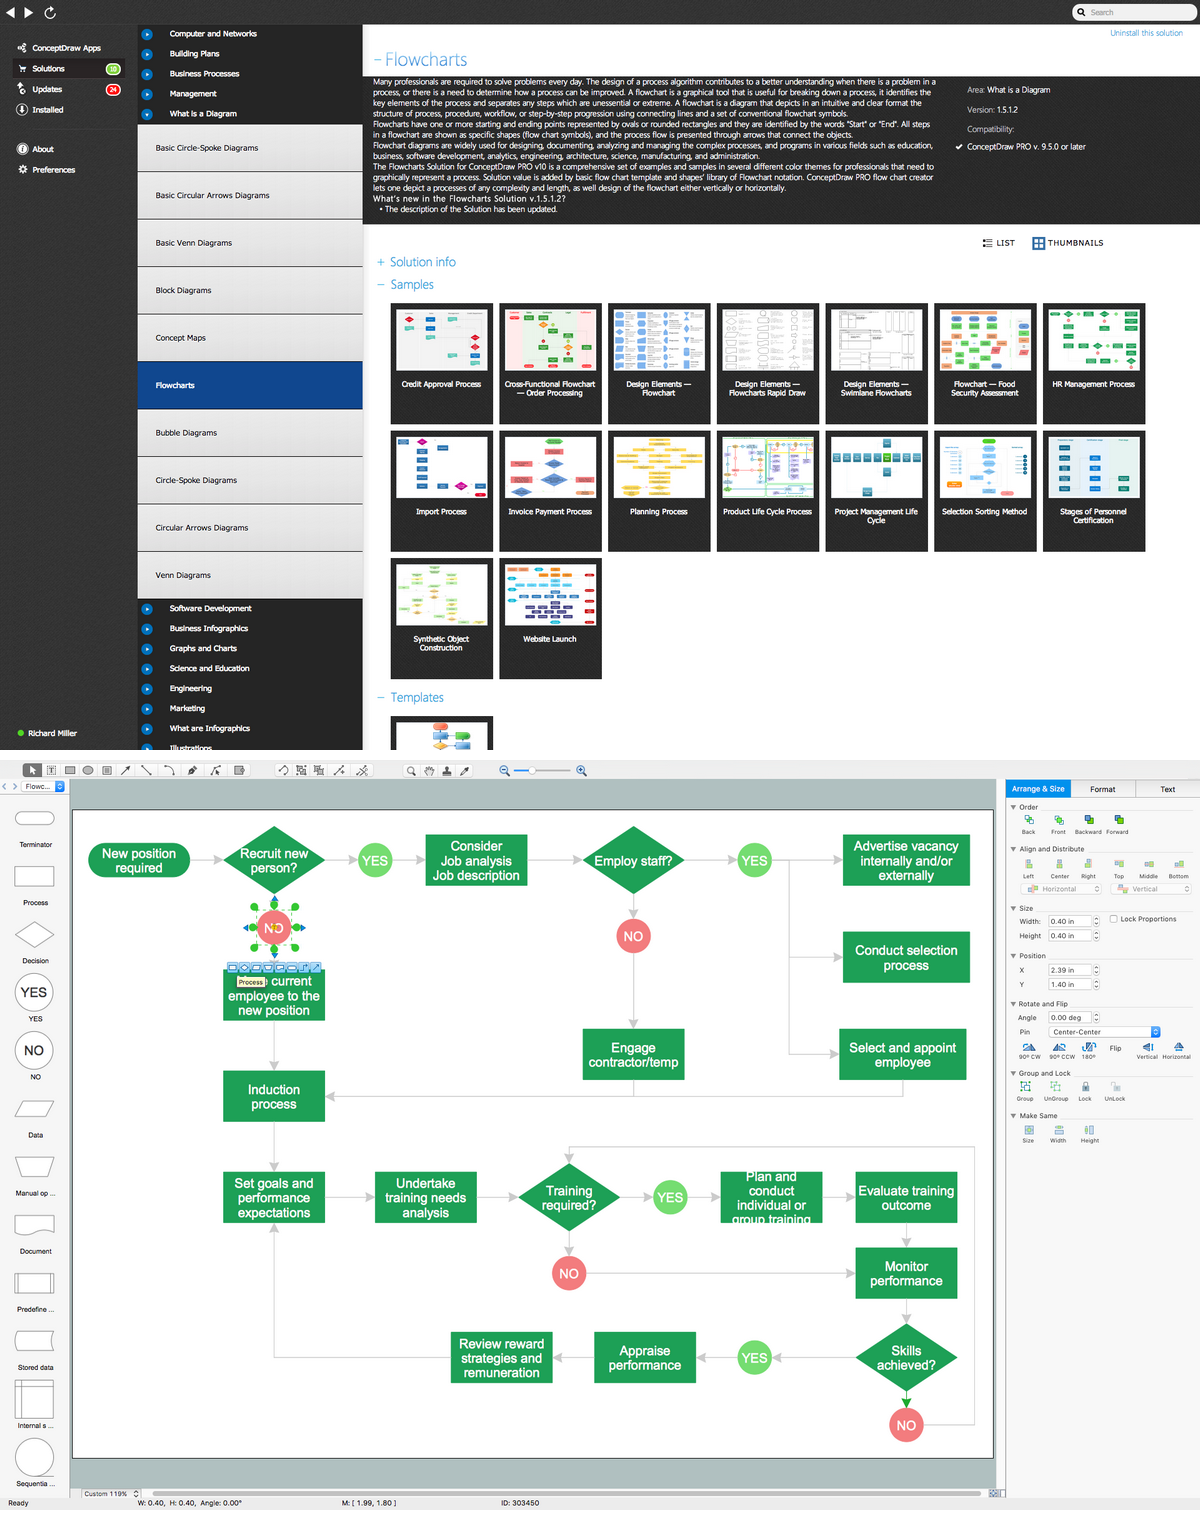
Picture: Create Flow Chart on Mac: The Comprehensive Guide
Related Solution:
An event-driven process chain diagram is a flowchart used in business process analysis. It evolved from Architecture of Integrated Information Systems (ARIS) and utilised in the business process improvement and analysis. It is also used to facilitate enterprise resource planning.
An EPC diagram is a complex flowchart that shows different business processes through various workflows. The workflows are seen as functions and events that are connected by different teams or people, as well as tasks that allow business processes to be executed.
ConceptDraw DIAGRAM is a software for making EPC diagrams that allows managers visually present business process models for making decisions for business.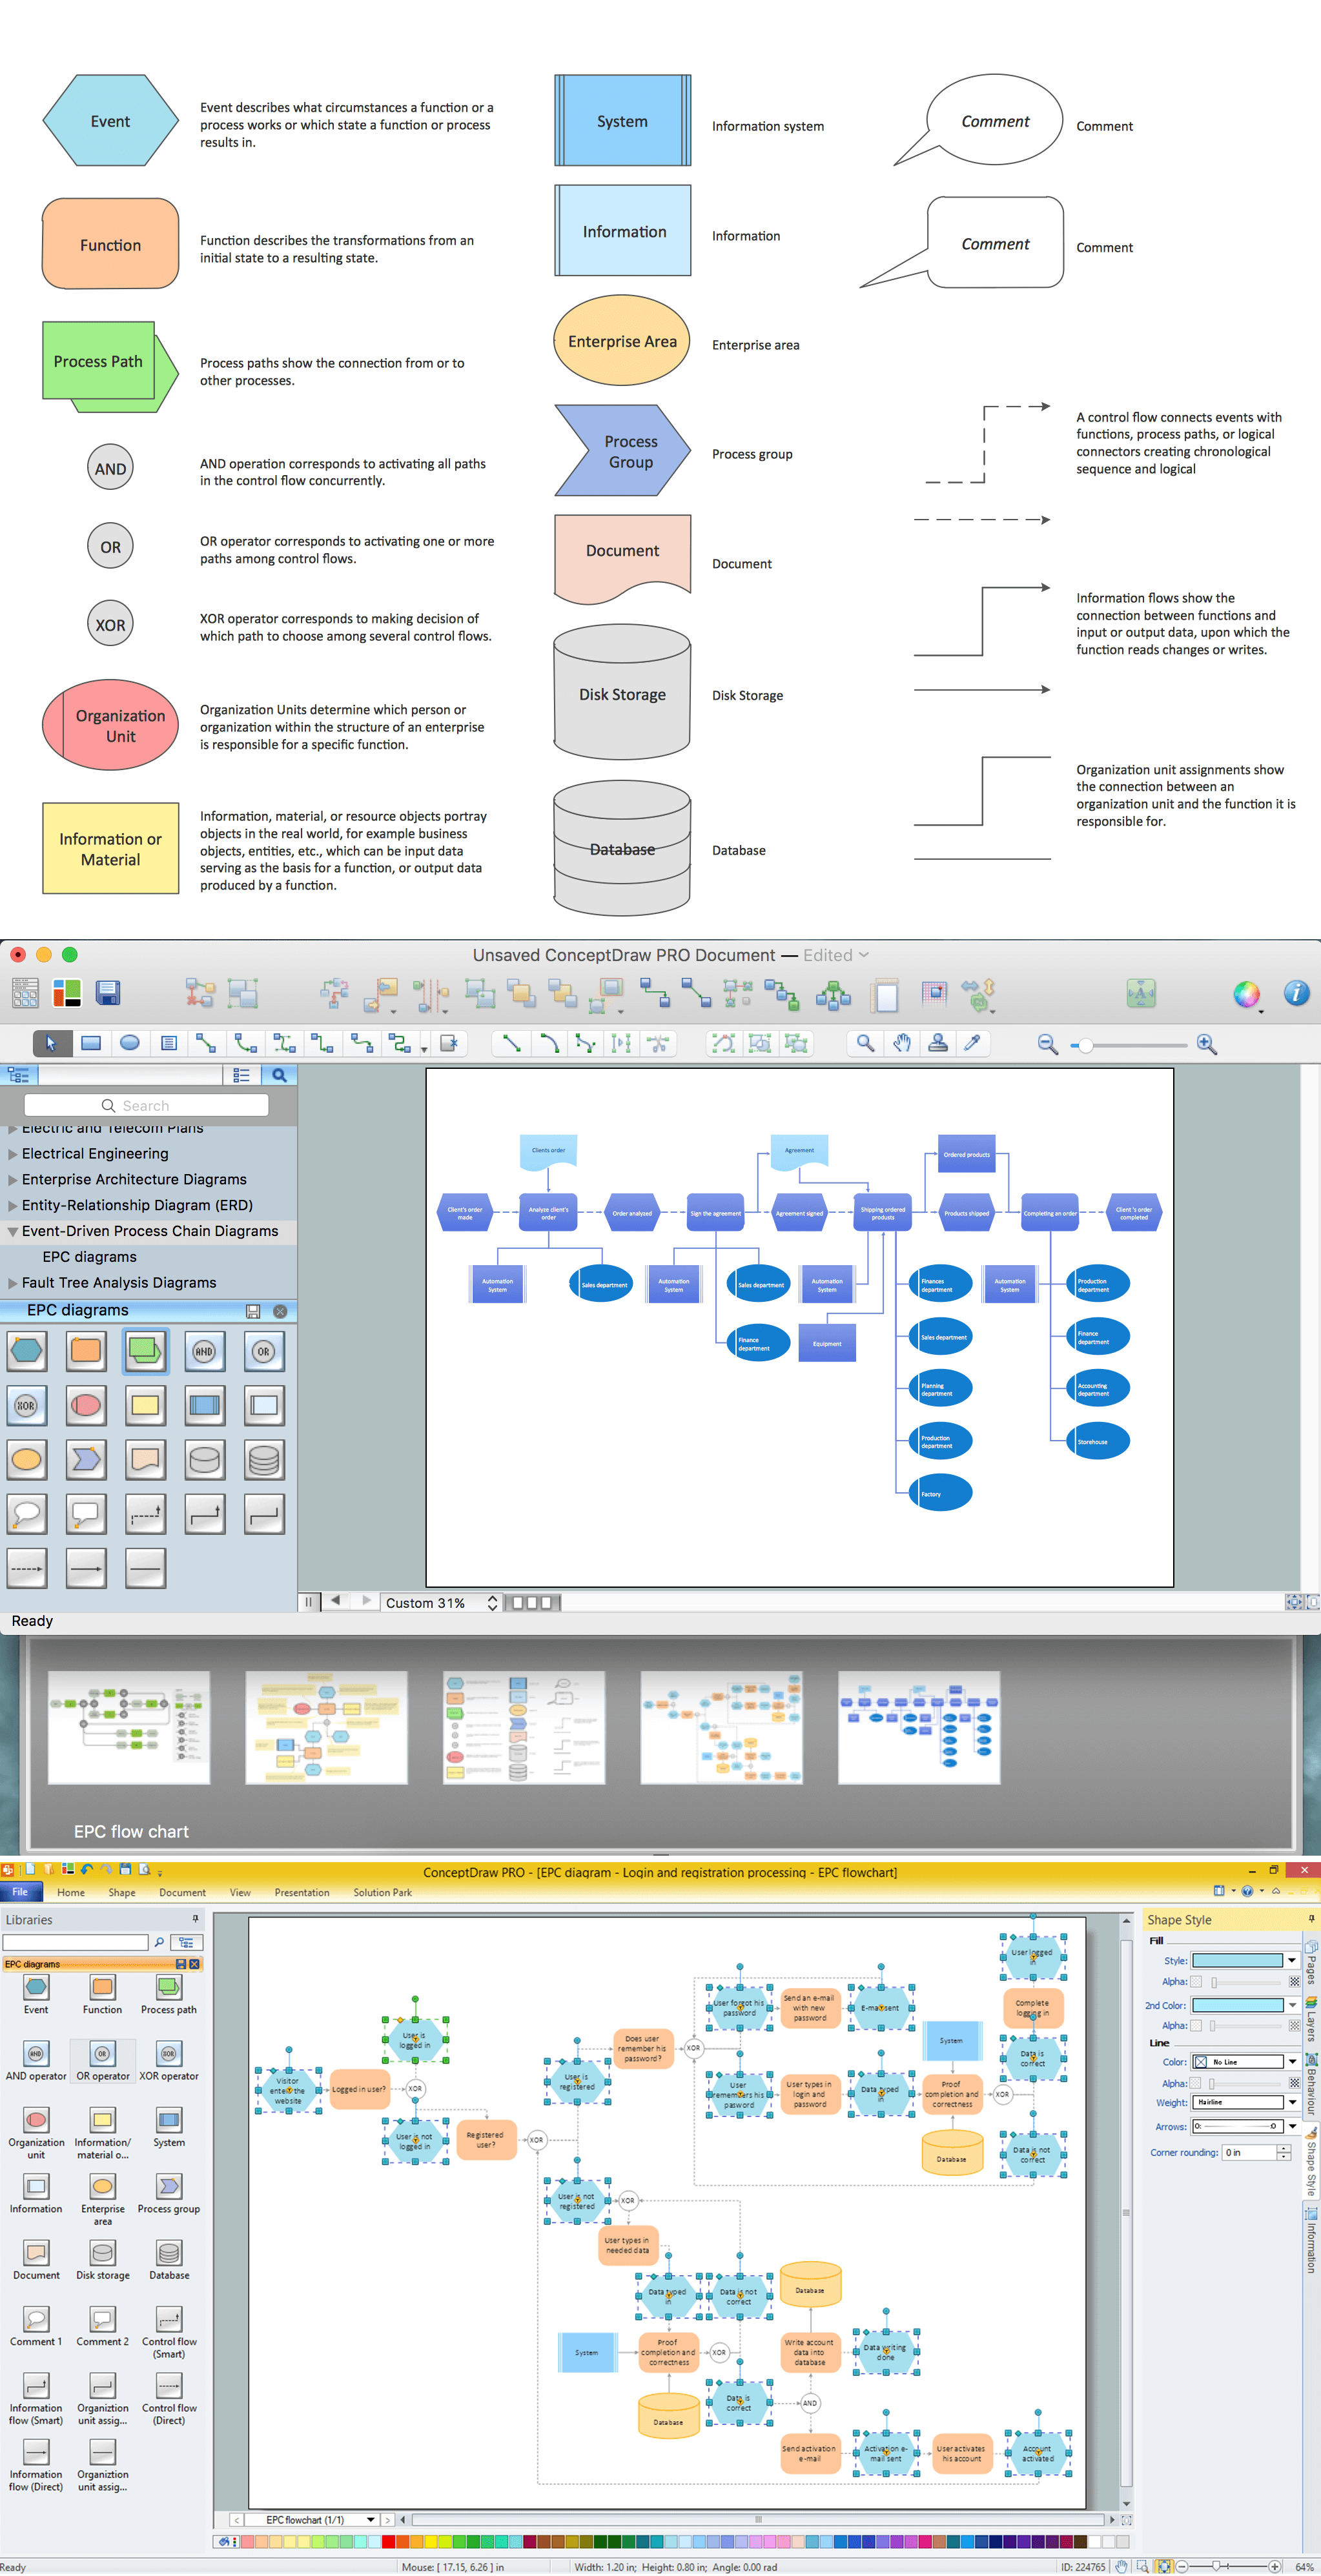
Picture: How to Draw EPC Diagram Quickly
Related Solution:
Samples, templates and libraries contain vector clip art for drawing the Aerospace Illustrations.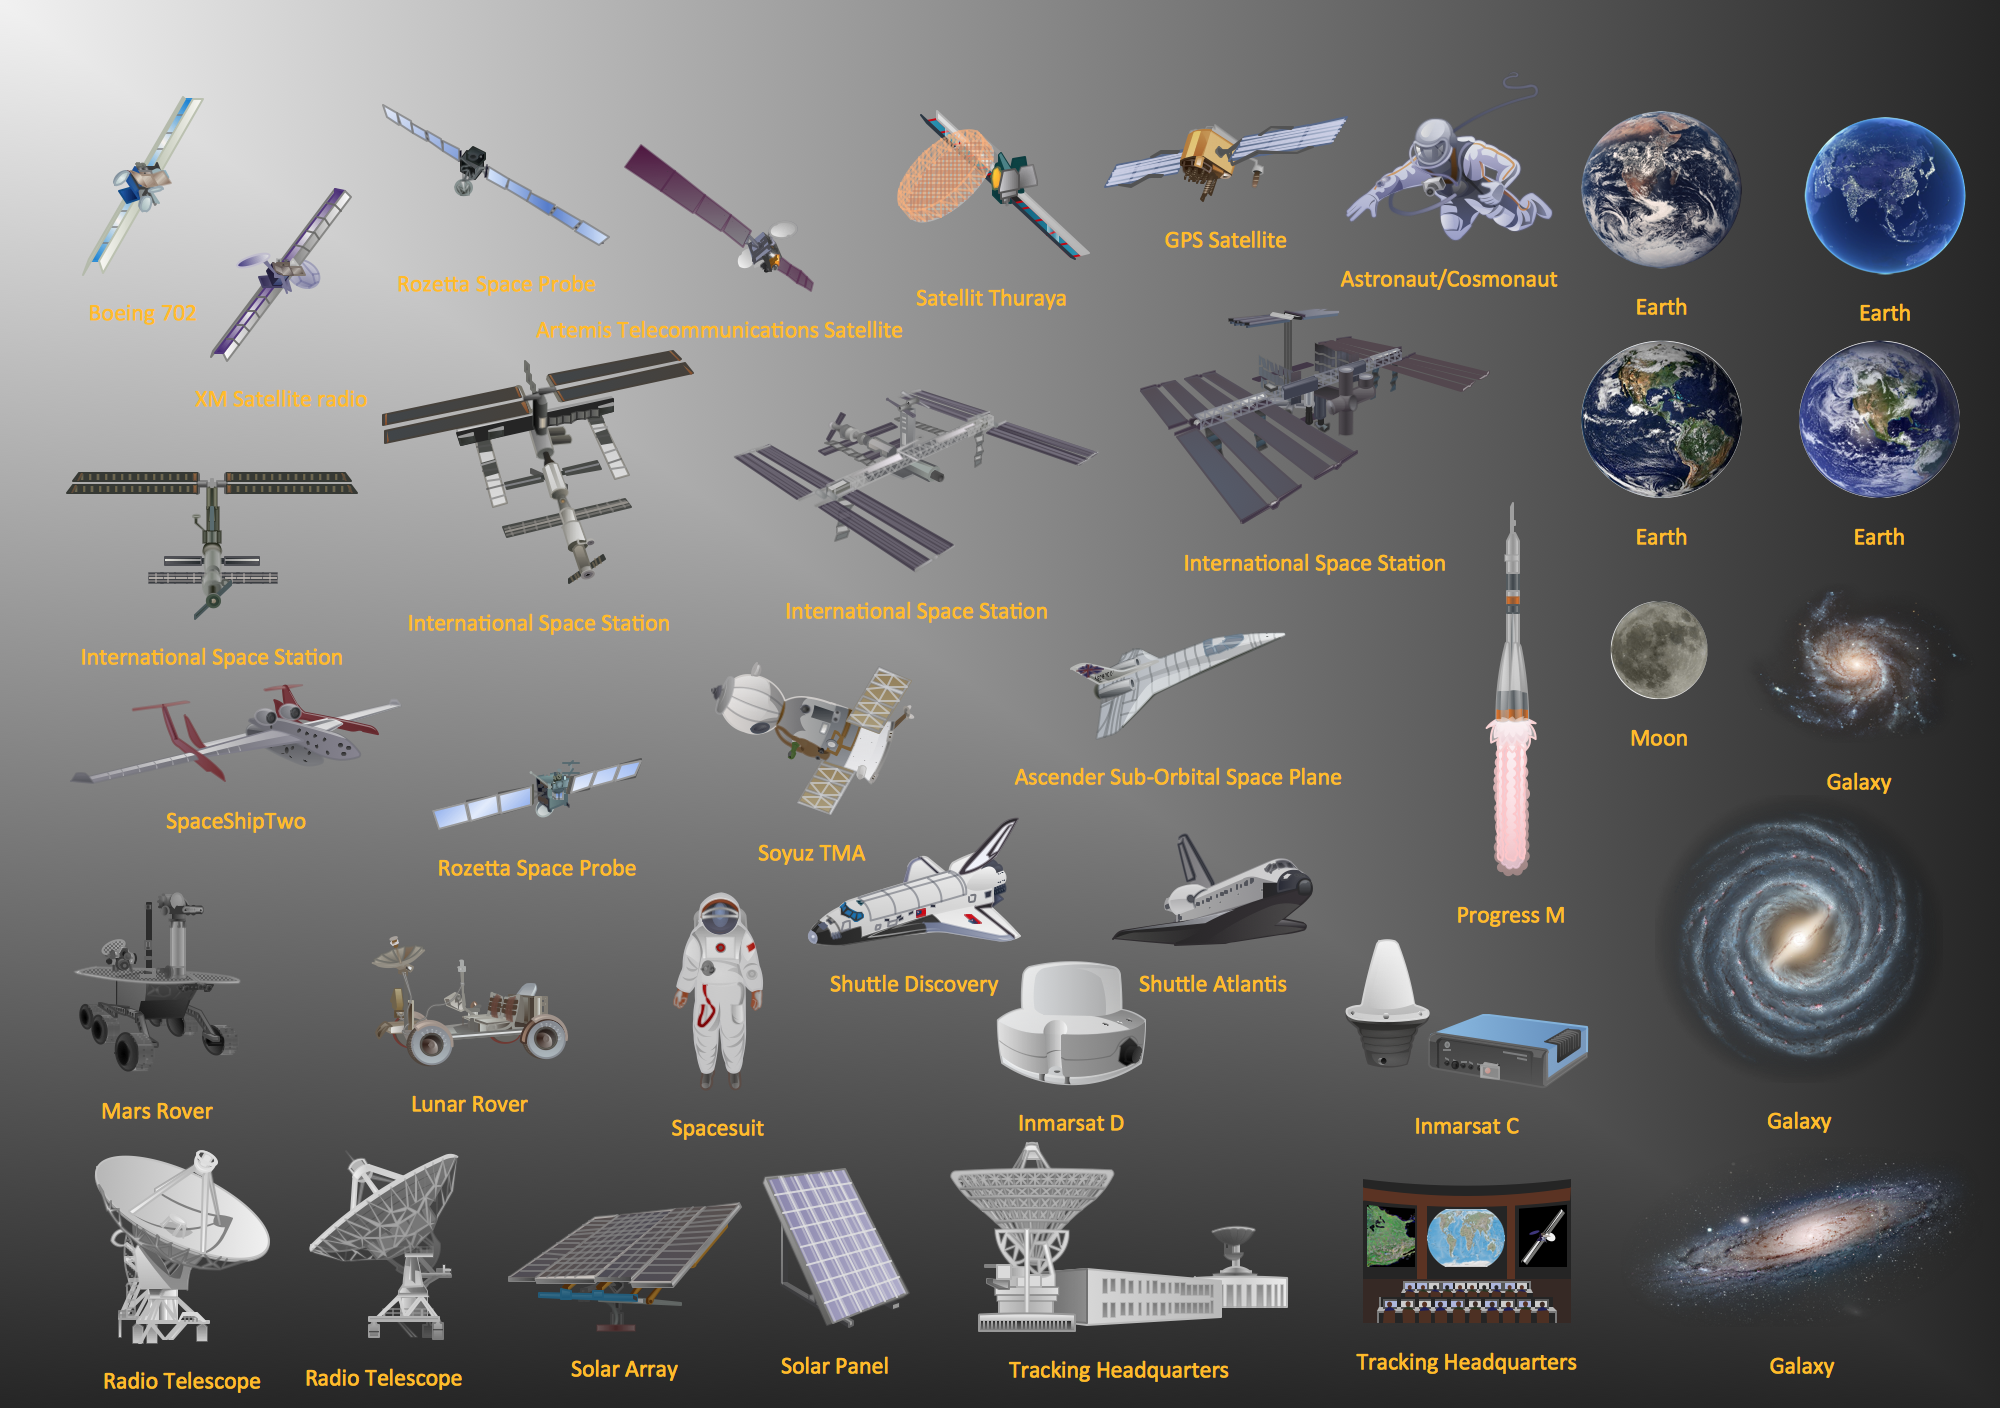
Picture: Aerospace - Design Elements
Related Solution:
Activity Network Diagram - This sample was created in ConceptDraw DIAGRAM diagramming and vector drawing software using the Seven Management and Planning Tools solution from the Management area of ConceptDraw Solution Park.
This sample shows the PERT (Program Evaluation Review Technique) chart of the request on proposal. A request for proposal (RFP) is a request of the company or the organization to potential suppliers to submit the business proposals for service or goods that it is interested to purchase. The RFP is represented on the initial procurement stage and allows to define the risks and benefits.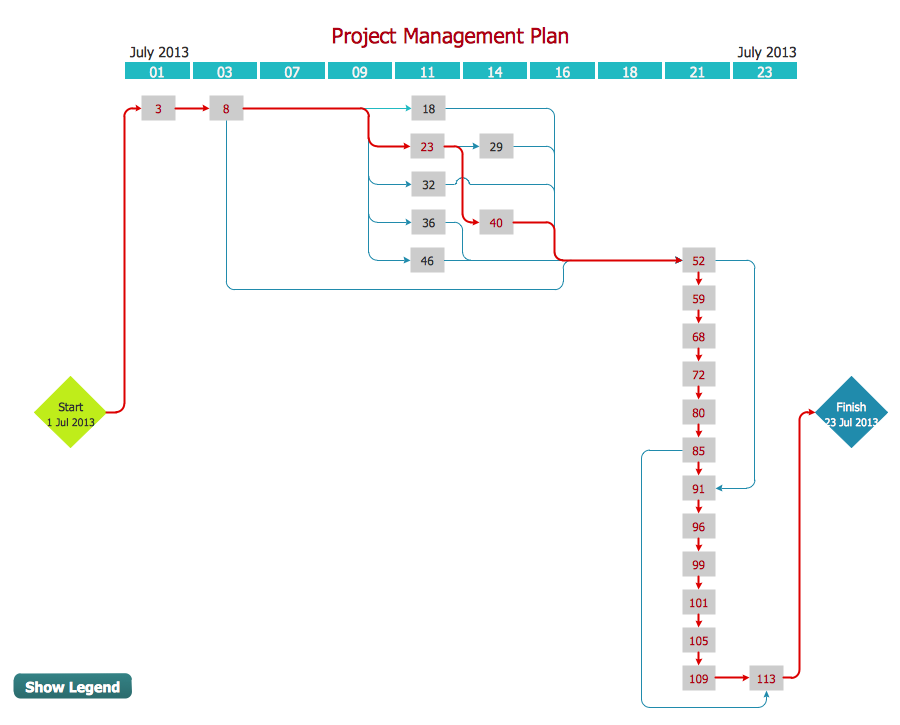
Picture: Activity Network Diagram Method
Related Solution:
Nodes of any computer network are somehow organized in a hierarchy or a layout. Some of the common layouts like star network topology are more reliable and some like ring topology withstand high loads better. It is also important to distinguish logical topologies from physical.
This diagram represents a typical view of the star network topology. The star network topology is one of the most frequently used network topologies in the majority of office and home networks. It is very popular because of its low cost and the easy maintenance. The plus of the star network topology is that if one computer on the local network is downed, this means that only the failed computer can not send or receive data. The other part of the network works normally. The minus of using star network topology is that all computers are connected to a single point-switch, or hub. Thus, if this equipment goes down, the whole local network comes down.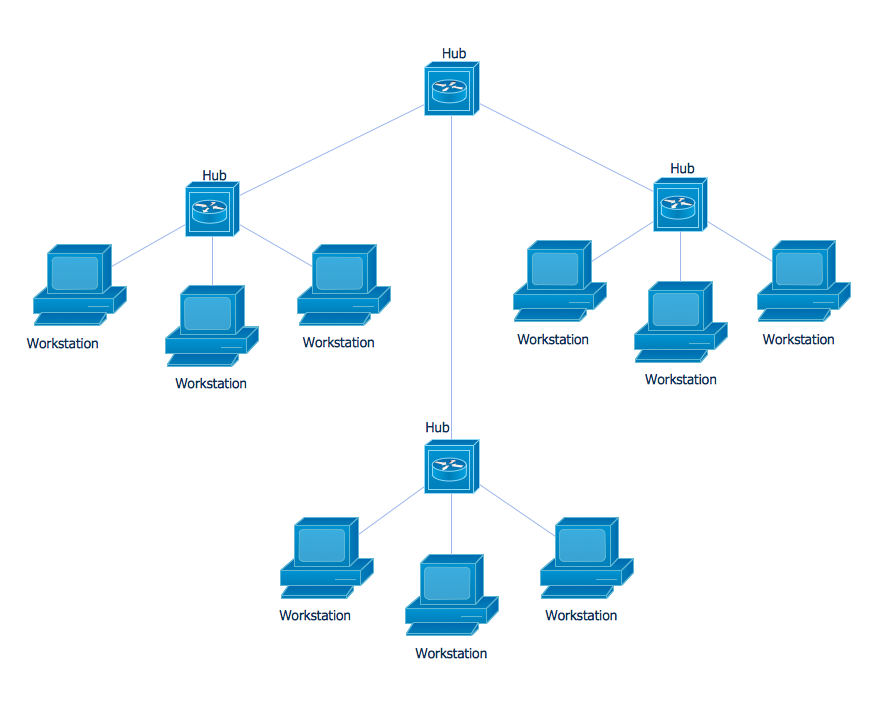
Picture: Star Network Topology
Related Solution:
Electrical Engineering Solution used together with ConceptDraw DIAGRAM drawing facilities makes short a work of drawing various electrical and electronic circuit schemes. A library of vector objects composed from symbols of Analog and Digital Logic elements of electric circuit includes 40 symbolic images of logic gates, bistable switches of bi-stable electric current, circuit controllers, amplifiers, regulators, generators, etc. All of them can be applied in electronic circuit schemes for showing both analog and digital elements of the circuit.
Electrical Engineering Solution used together with ConceptDraw DIAGRAM drawing facilities makes short a work of drawing various electrical and electronic circuit schemes. A library of vector objects composed from symbols of Analog and Digital Logic elements of electric circuit includes 40 symbolic images of logic gates, bistable switches of bi-stable electric current, circuit controllers, amplifiers, regulators, generators, etc. All of them can be applied in electronic circuit schemes for showing both analog and digital elements of the circuit.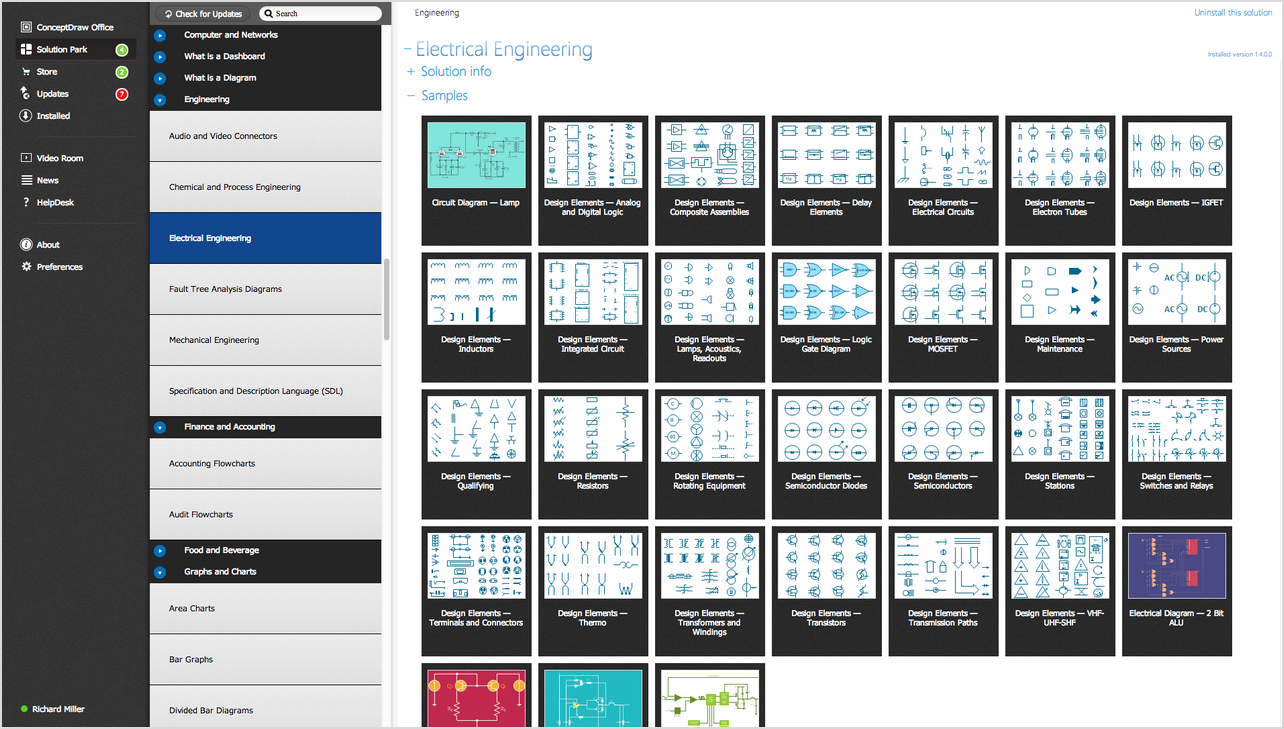
Picture:
Electrical Diagram Symbols F.A.Q.
How to Use Electrical ConceptDraw Diagram Software
Related Solution: