Authority Matrix Diagram Software
You need to draw Authority Matrix Diagram quick and easy? Design it with ConceptDraw DIAGRAM.
ConceptDraw DIAGRAM extended with Seven Management and Planning Tools solution from the Management Area is the best Authority Matrix Diagram Software.

Sample 1. ConceptDraw DIAGRAM - Authority Matrix Diagram Software
Seven Management and Planning Tools Solution offers you a wide set of various templates and samples that you can use as the base for drawing your own Authority Matrix Diagrams in minutes. All templates and samples are available from ConceptDraw STORE.

Sample 2. Seven Management and Planning Tools Solution in ConceptDraw STORE
ConceptDraw STORE is useful and convenient tool that allows you to navigate the ConceptDraw Solution Park, manage downloads and updates, take the access to libraries, templates and samples directly from it.
After choosing the desired template or sample, change it for your needs. Type the text, add clipart and shapes from the extensive libraries of Seven Management and Planning Tools Solution, change the style and colors of your Authority Matrix Diagram in minutes.
You can also create the own professional looking Authority Matrix Diagram de novo using the tools of Seven Management and Planning Tools solution from the Management Area. If you use some designations on your diagram, it is convenient to create the legend to explain the applied designations.
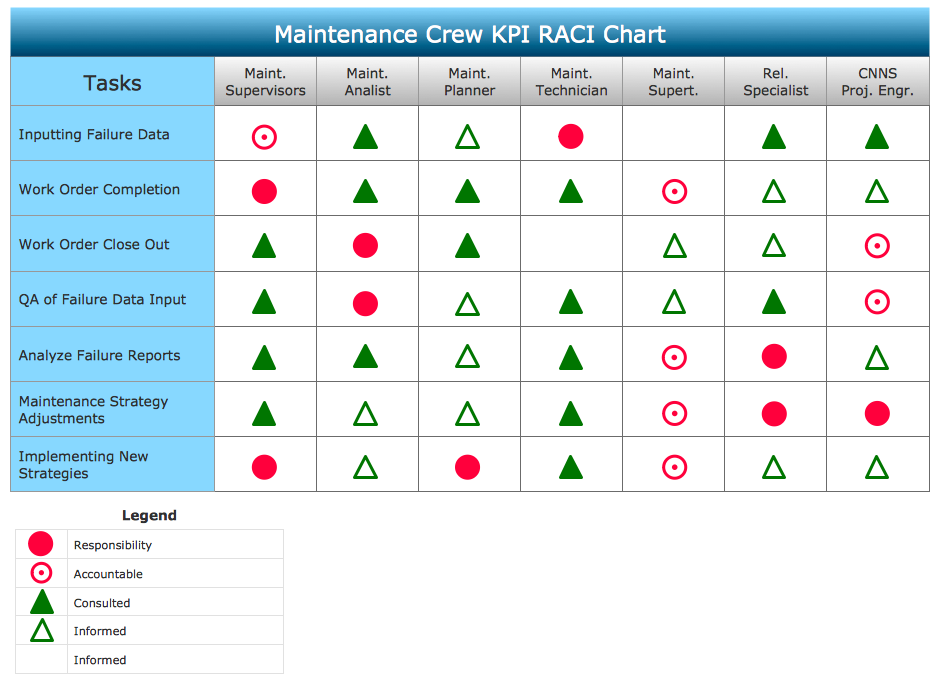
Sample 2. Authority Matrix Diagram
This sample was created in ConceptDraw DIAGRAM using the Seven Management and Planning Tools Solution and shows the Authority Matrix Diagram. An experienced user spent 10 minutes creating this sample.
Use the Seven Management and Planning Tools Solution for ConceptDraw DIAGRAM to create your own Authority Matrix Diagram of any complexity quick, easy and effective.
The Authority Matrix Diagrams designed with ConceptDraw DIAGRAM are vector graphic documents and are available for reviewing, modifying, converting to a variety of formats (image, HTML, PDF file, MS PowerPoint Presentation, Adobe Flash or MS Visio), printing and send via e-mail in one moment.
TEN RELATED HOW TO's:
An organizational chart is a diagram that shows the structure of an organization and the relationships of its parts. ConceptDraw DIAGRAM extended with Organizational Charts Solution from the Management Area is powerful Organizational Chart Software.
Picture: Organizational Chart
Related Solution:
Activity on Node Network Diagramming Tool - Activity Network and Project Evaluation and Review Technique, or PERT, charts are a way of documenting and analyzing the tasks in a project.
This sample shows the Activity on node network diagramming method. It was created in ConceptDraw DIAGRAM diagramming and vector drawing software using the Seven Management and Planning Tools solution from the Management area of ConceptDraw Solution Park.
Picture: Activity on Node Network Diagramming Tool
Related Solution:
Flowcharts can be used in designing and documenting both simple and complex processes or programs and, similar to the other types of diagrams, they can help visualize what happens and so help understand some definite process, and, as a result, find flaws, bottlenecks and other features within it.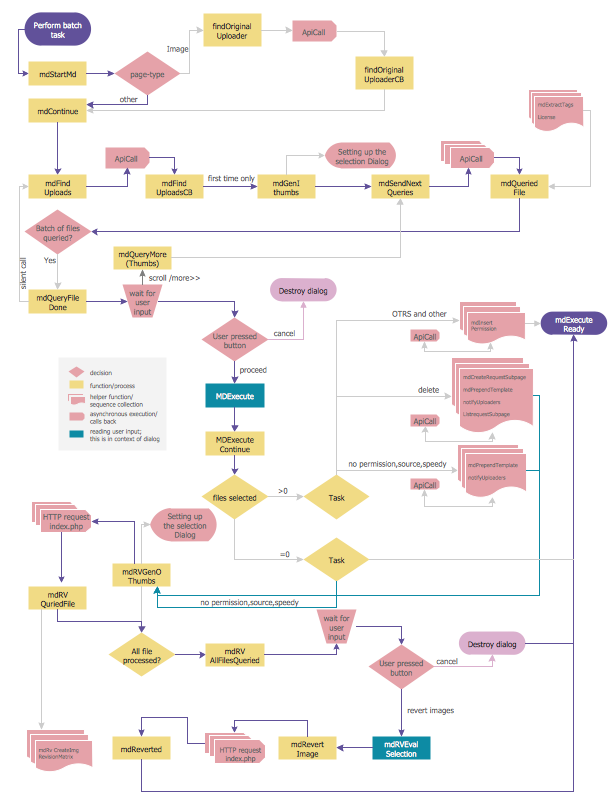
Picture: Flowchart Programming Project. Flowchart Examples
Related Solution:
ConceptDraw DIAGRAM is a powerful tool for business and technical diagramming.
Software Development area of ConceptDraw Solution Park provides 5 solutions:
Data Flow Diagrams, Entity-Relationship Diagram (ERD), Graphic User Interface, IDEFO Diagrams, Rapid UML.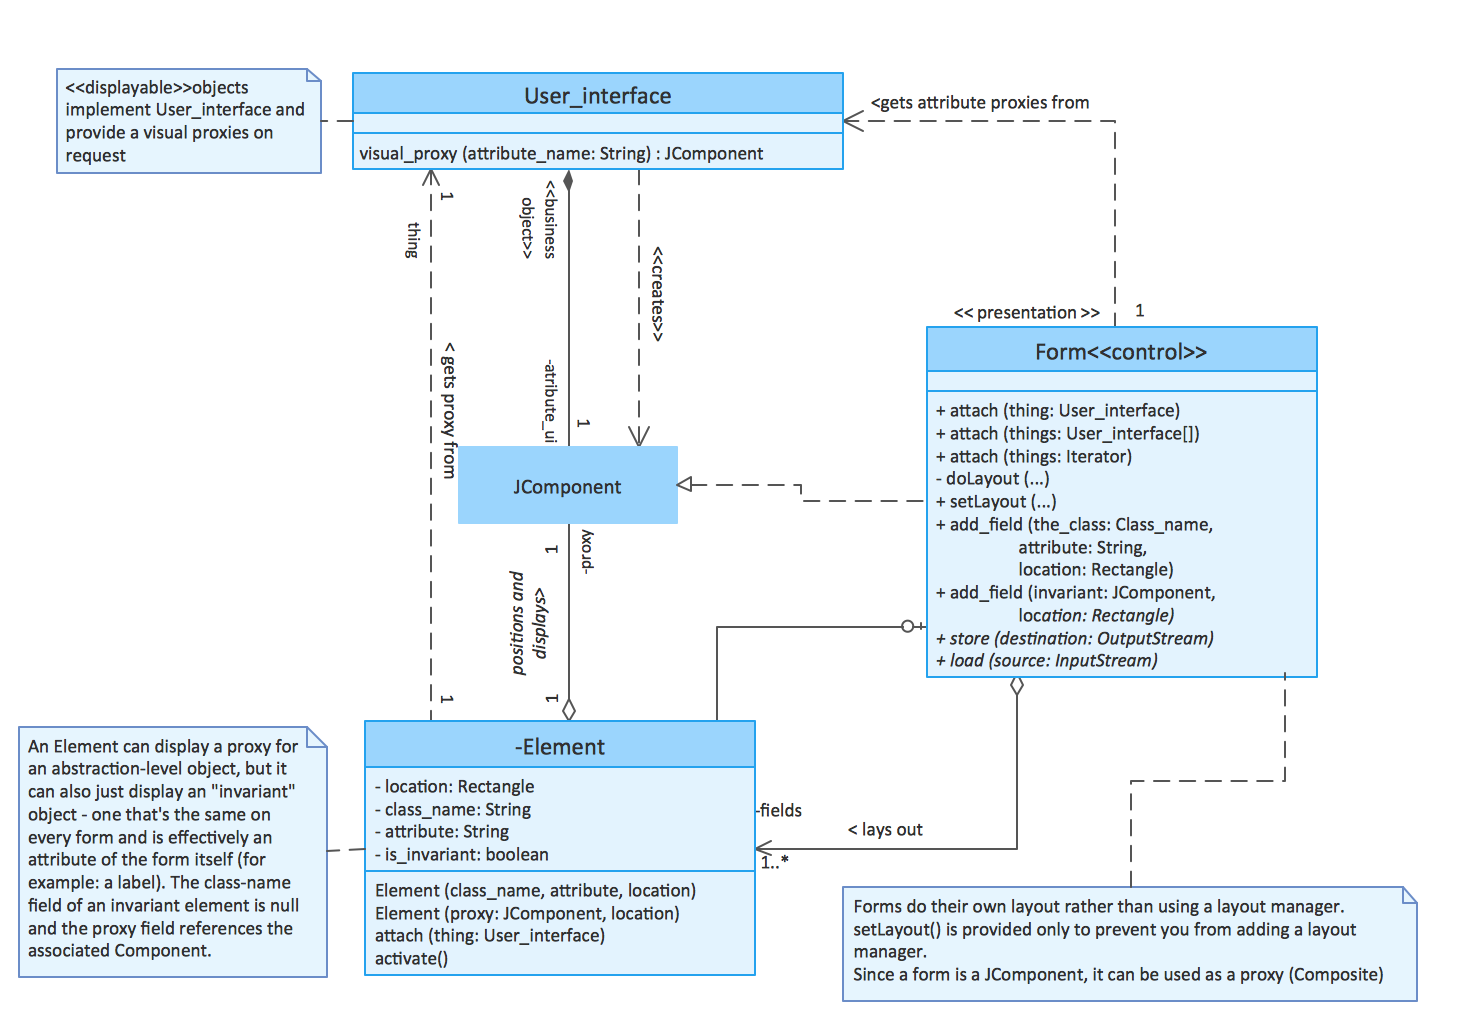
Picture: Software Diagram Examples and Templates
Related Solution:
Internal auditing is an independent, objective assurance and consulting activity designed to add value and improve an organization's operations.
ConceptDraw DIAGRAM diagramming and vector drawing software extended with Audit Flowcharts solution from the Finance and Accounting area perfectly suits for the Internal Audit Process. You can make sure this right now!
Picture: Internal Audit Process
Related Solution:
Tracking Olympic results in visual format is the most modern way to deliver statistics to a broad audience. This is a good example of an illustrated table you may easily modify, print, or publish on web from ConceptDraw Winter Sports solution.
Picture: Winter Sports Vector Clipart. Medal Map. Spatial Infographics
Related Solution:
The Total Quality Management Diagram solution helps you and your organization visualize business and industrial processes. Create Total Quality Management diagrams for business process with ConceptDraw software.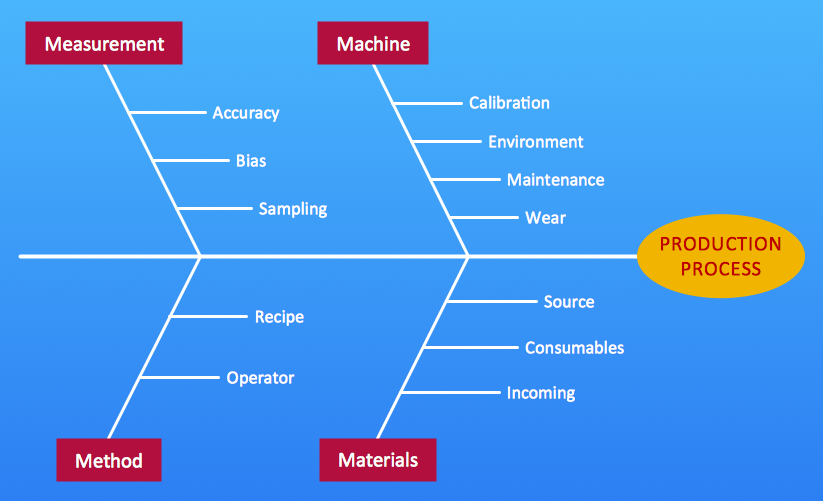
Picture: Total Quality Management Value
Related Solution:
This template shows the Six Markets Model Chart and was included in Marketing Diagrams Solution. It is available from ConceptDraw STORE and can be used as the base for creating your own marketing diagrams.
Picture: Six Markets Model Chart Template
Related Solution:
There are numerous articles about the advantages of flowcharting, creating business graphics and developing different charts. Nevertheless, these articles are almost useless without the main component - the examples of flowcharts, org charts and without a fine example, it is difficult to get all the conveniences of creating diagrams. You can find tons of templates and vivid examples on Solution Park.
This illustration shows a variety of business diagrams that can be created using ConceptDraw DIAGRAM. It comprises a different fields of business activities: management, marketing, networking, software and database development along with design of infographics and business illustrations. ConceptDraw DIAGRAM provides a huge set of sample drawings including business process modeling diagrams,, network diagrams, UML diagrams, orgcharts, DFD, flowcharts, ERD, geographical maps and more.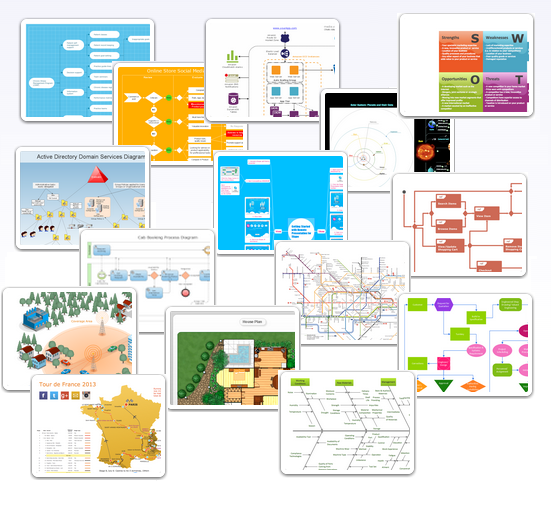
Picture: Examples of Flowcharts, Org Charts and More
Related Solution:
A key point of conference success is the ability to see slides in real time, and hold documented discussions during the meeting. Remote Presentation for Skype is a new solution allows real-time presenting that benefits work groups who need collaborate by web meetings.
Picture: How To Make the Right Decision in Projects
Related Solution: