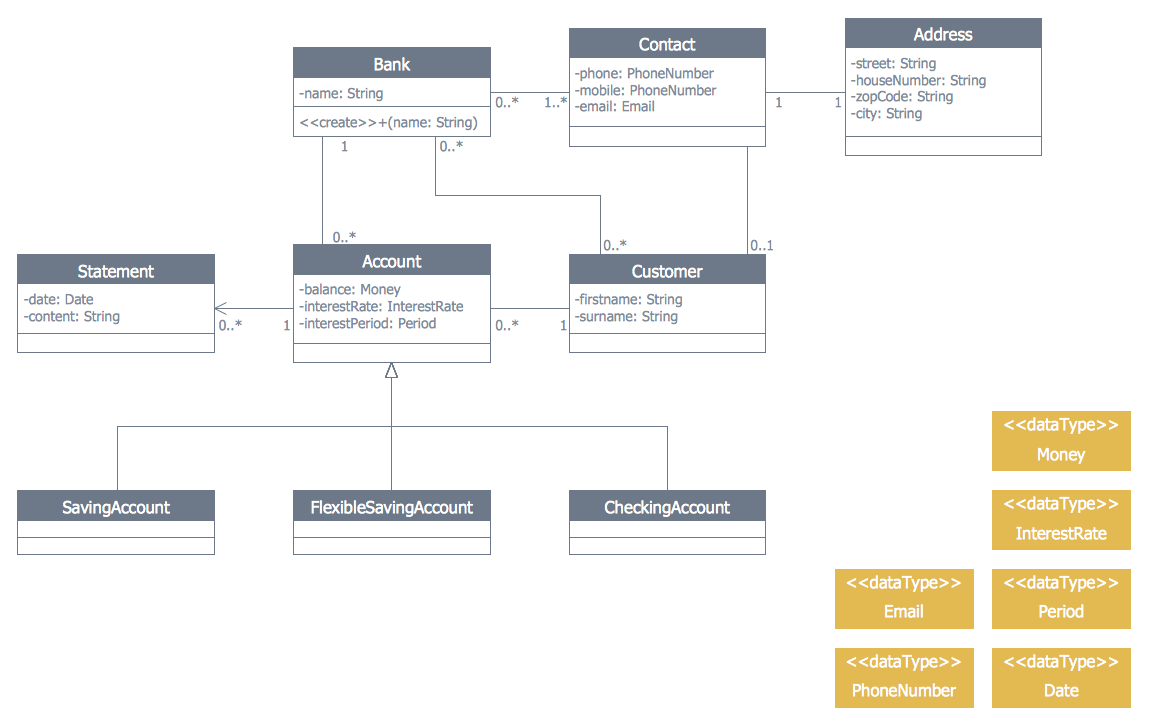
Example 1. Banking System - UML Class Diagram
ATM UML Diagrams Solution offers all needed tools for representing banking system of any complexity. You can choose any type of Bank UML Diagram useful for you and use the corresponding library from the set of offered by ATM UML Diagrams Solution.
Here are represented 14 libraries of ATM UML Diagrams Solution which contain 182 ready-to-use vector shapes. All they are professionally designed and universally accepted UML objects which will help to facilitate design and development process of the banking system.

Example 2. UML Package Diagram for Banking System
The banking system samples you see on this page were created in ConceptDraw DIAGRAM software using the ATM UML Diagrams Solution. These samples successfully demonstrate solution's capabilities and professional results you can achieve. An experienced user spent 10-15 minutes creating each of them.
Use the ATM UML Diagrams Solution for ConceptDraw DIAGRAM to create your own professional looking UML Diagrams for the banking system quick, easy and effective.
All source documents are vector graphic documents. They are available for reviewing, modifying, or converting to a variety of formats (PDF file, MS PowerPoint, MS Visio, and many other graphic formats) from the ConceptDraw STORE. The ATM UML Diagrams Solution is available for all ConceptDraw DIAGRAM users.
TEN RELATED HOW TO's:
ConceptDraw has several examples that help you to start using software for designing UML Use Case Diagrams.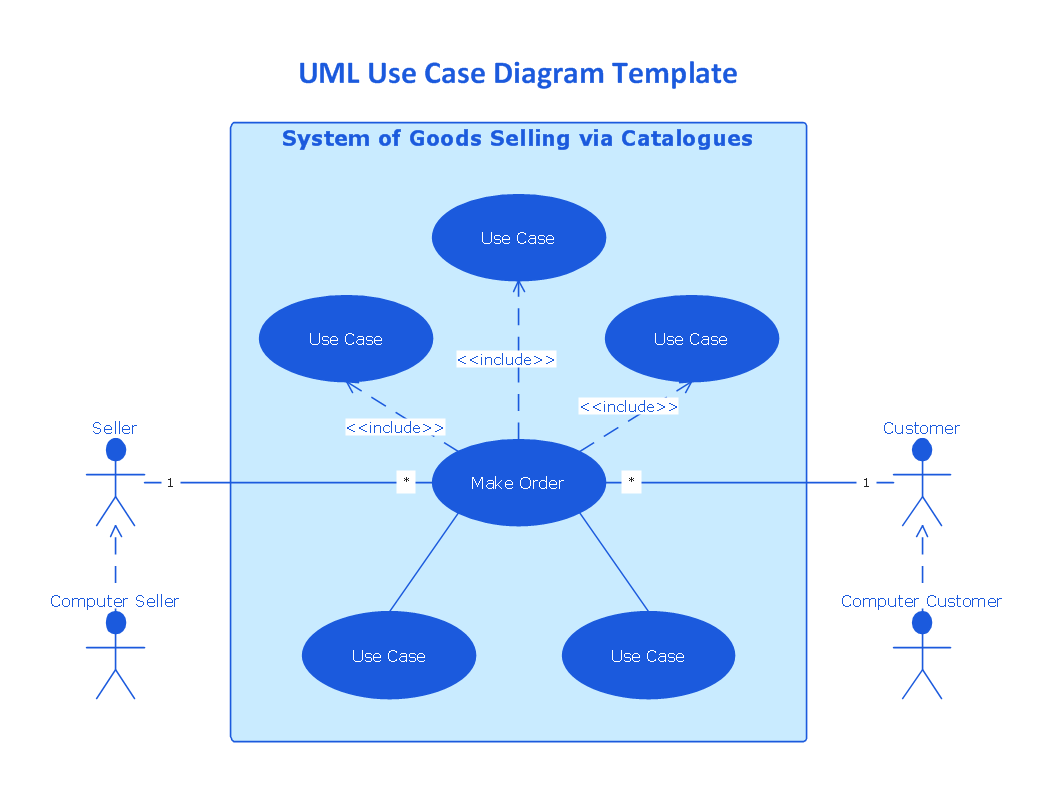
Picture: UML Use Case Diagrams
Network infrastructure planning is a very important process in the network construction, and the share of time allocated to this within the scope of the entire project may reach 60-80%. A competent and thorough approach to planning contributes to the quick investment return, and also increases the reliability and flexibility of the final system, reducing the probability of additional costs related to the incorrect implementation.
Any planning begins with an analysis of the business requirements to the final system. Basic network parameters, which should be assessed are the scalability, accessibility, cost, speed and safety.
Speed and cost are often mistaken for the most important parameters, and the rest of the parameters aren't even remembered. This is not entirely correct. Initially, it is necessary to assess the business plans for the future, because sometimes it is more profitable to invest more money in the beginning. If the business is to develop, then, consequently, demands on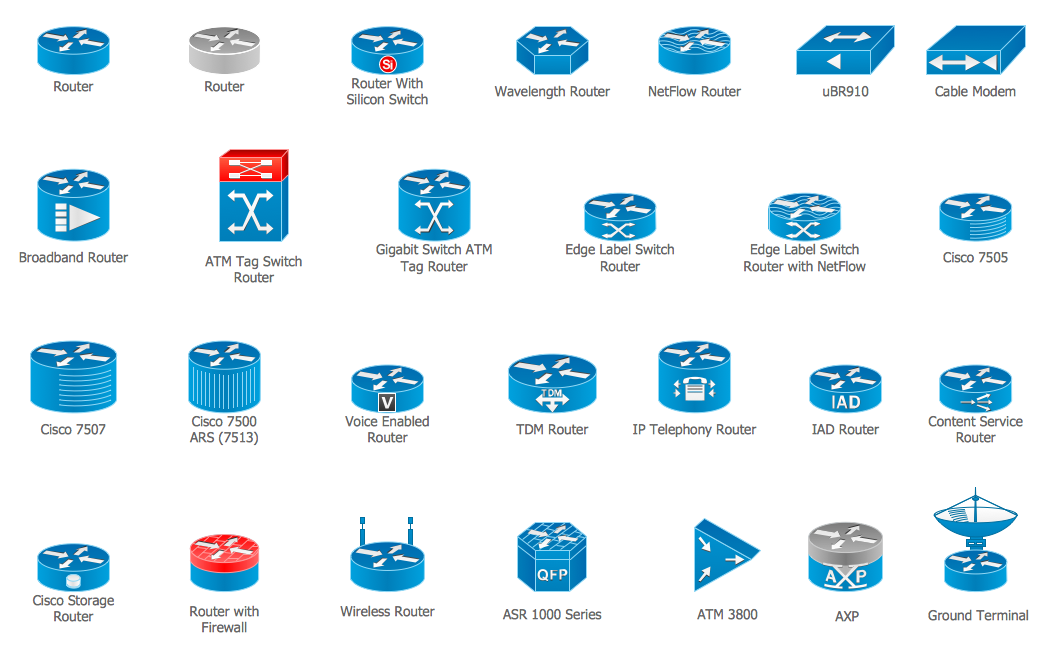
Picture: Cisco Routers. Cisco icons, shapes, stencils and symbols
Related Solution:
The Building Plans area of ConceptDraw Solution Park includes a set of solutions of Interior Design. The Interior Design solutions for ConceptDraw DIAGRAM allow you simply and quickly create the professional looking Building Plans that will help you to design, redesign your room, flat, home, office, cafe or any other building. Having the ready plan of the rooms you can easy rearrange the furniture, interior objects on the plan and see the future result at once.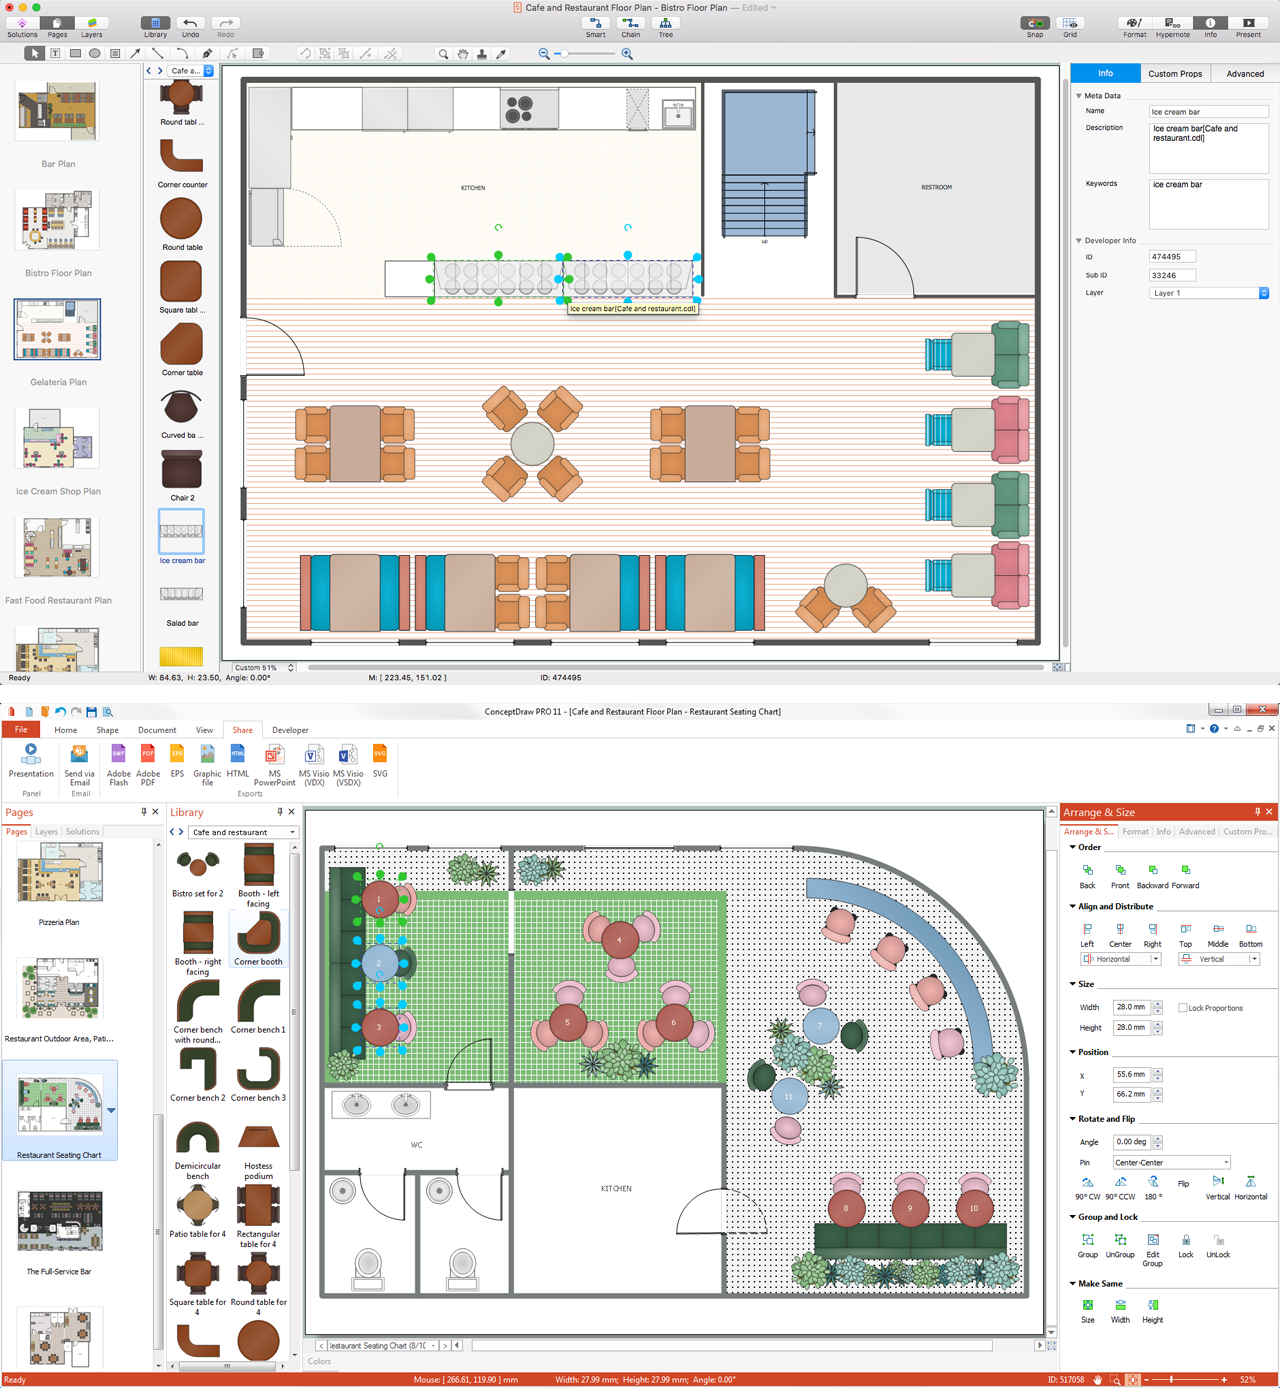
Picture: Interior Design Software. Building Plan Examples
Related Solution:
ConceptDraw has 142 vector stencils in the 8 libraries that helps you to start using software for designing own Business Process Diagrams. Use Swimlanes library with 20 objects from BPMN.
Picture: Business Process Elements: Swimlanes
Related Solution:
This sample shows the UML Class Diagram of delivery system. On this diagram you can see the classes that are connected with aggregation and composition associations indicated with the multiplicity. This sample can be used by delivery services, postal services.
Picture: UML Diagram for System
Related Solution:
This sample shows the Purchasing Flow Chart Diagram that displays the money flow in the carbon offset sphere. The carbon offsets are the compensatory measures that the companies make for the carbon emissions. You can see on this sample the groups that have interests in the carbon offsets and the money flow after the carbon offset vendors sold the carbon offsets.
Picture: Purchasing Flow Chart.Purchasing Flowchart Example
Related Solution:
The Social Media Response solution provides the means to respond to social media mentions quickly and professionally. This tool keeps the entire team on the same page allowing you to realize your social media strategy, improve the quality of your answers, and minimize the time it takes to respond.
Picture: Manage Social Media Response Plan DFD
Related Solution:
Entity Relationship Diagram (ERD) is an acknowledged method to visualize the logical structure of databases. Using special symbols described in ERD notations you can depict a database of any complexity.
The vector graphic ER diagrams produced when using ConceptDraw ERD solution can be used in whitepapers, presentations, datasheets, posters, or any technical materials.
Picture: What is Entity-Relationship Diagram
Related Solution:
Sequence Diagrams shows how objects communicate with each other in terms of a sequence of messages. Also indicates the lifespans of objects relative to those messages.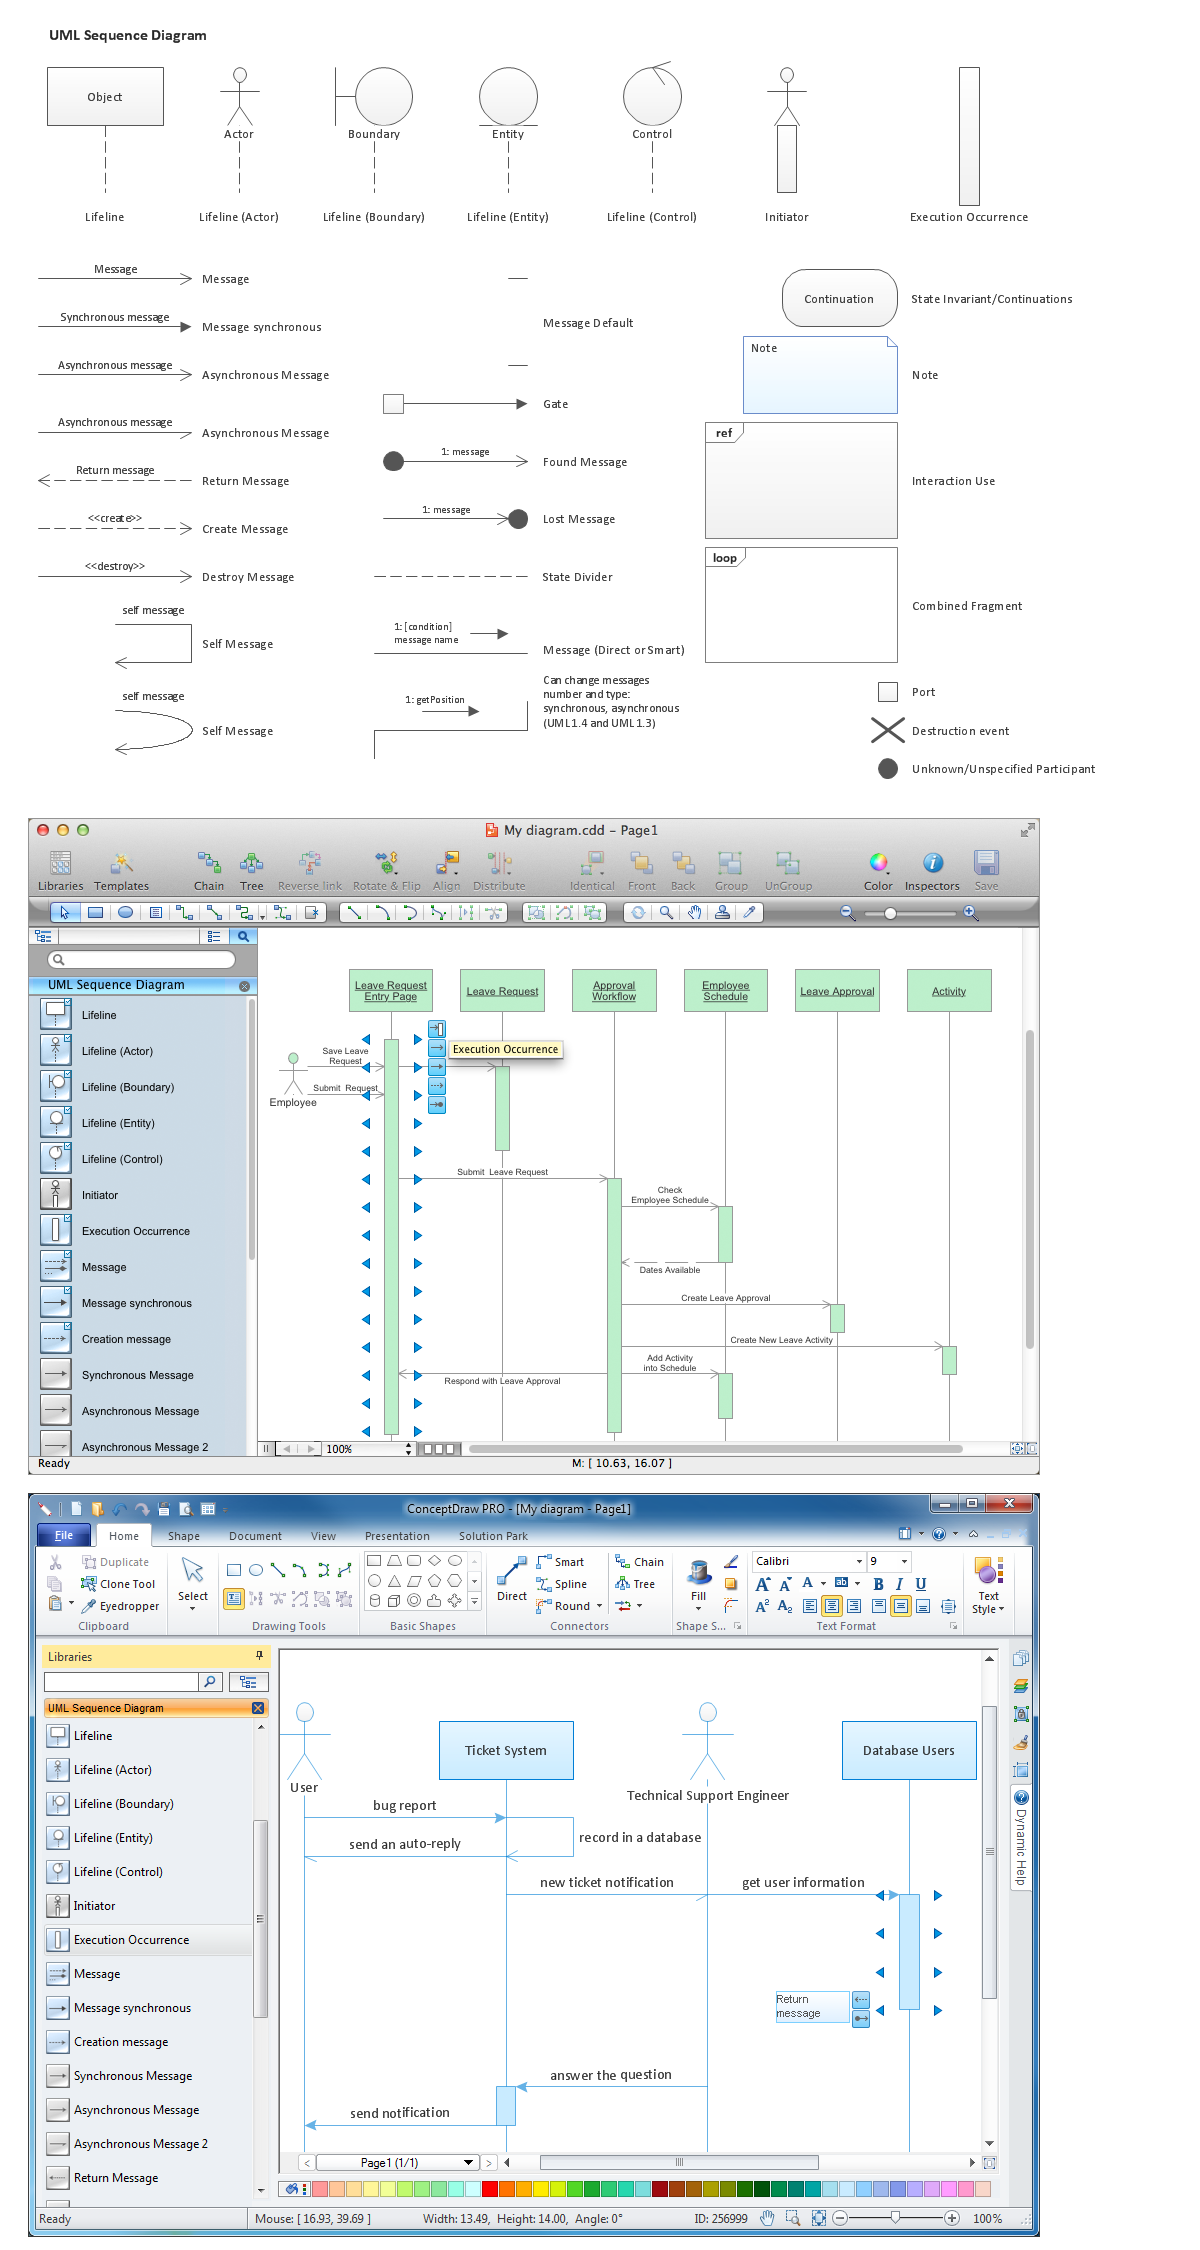
Picture: Diagramming Software for designing UML Sequence Diagrams
ConceptDraw DIAGRAM is a software for simplу depicting the business processes based on BPMN 2.0.
Business Process Diagrams Cross-Functional-Flowcharts, Workflows, Process Charts, IDEF0 and IDEF2, Timeline, Calendars, Gantt Charts, Business Process Modeling, Audit and Opportunity Flowcharts and Mind Maps (presentations, meeting agendas).
Picture: Business Process Modeling Notation
Related Solution:


