Bar Chart Template for Word
This template shows the Bar Chart. It was created in ConceptDraw DIAGRAM diagramming and vector drawing software using the ready-to-use objects from the Bar Graphs Solution from Graphs and Charts area of ConceptDraw Solution Park.
The Bar Chart visualizes graphically the data of different categories or groups and allows to compare them. The categories may consist of separate or discrete data. It’s very effective way of displaying the information. Bar Charts are widely used in the business, management, economics, manufacturing, etc.

Pic 1. Bar Chart Template
This Bar Chart displays the sales of the fruits in kilograms.
Using the Bar Graphs Solution for ConceptDraw DIAGRAM you can create your own professional looking Bar Charts quick and easy.
Free Download Bar Chart Software and View All Templates and Examples

Pic 2. Bar Chart Template for Word
This picture shows the Bar Chart in the MS Word.
See Also:
TEN RELATED HOW TO's:
A requisition form is one of the documents used for accounting in different manufacturing processes. There are two main types of requisition: a purchasing requisition and material requisition and difference between them is significant. Creating a flowchart might help you in understanding all the details of accounting process.
Flowcharts are a best visual method for dividing a large and complicated procedure into a several little clear pieces. The main value-ability of an effective flowchart is its simpleness. Material requisition flowcharts are used to document the process of relationships between the different departments and the purchasing department within an organization. The flow chart gives the step-by-step guide on how is carried out the procurement process of the materials necessary for the functioning of the organization. This type of flowchart along with many other business flowcharts, one can easy create using ConceptDraw Flowcharts solution.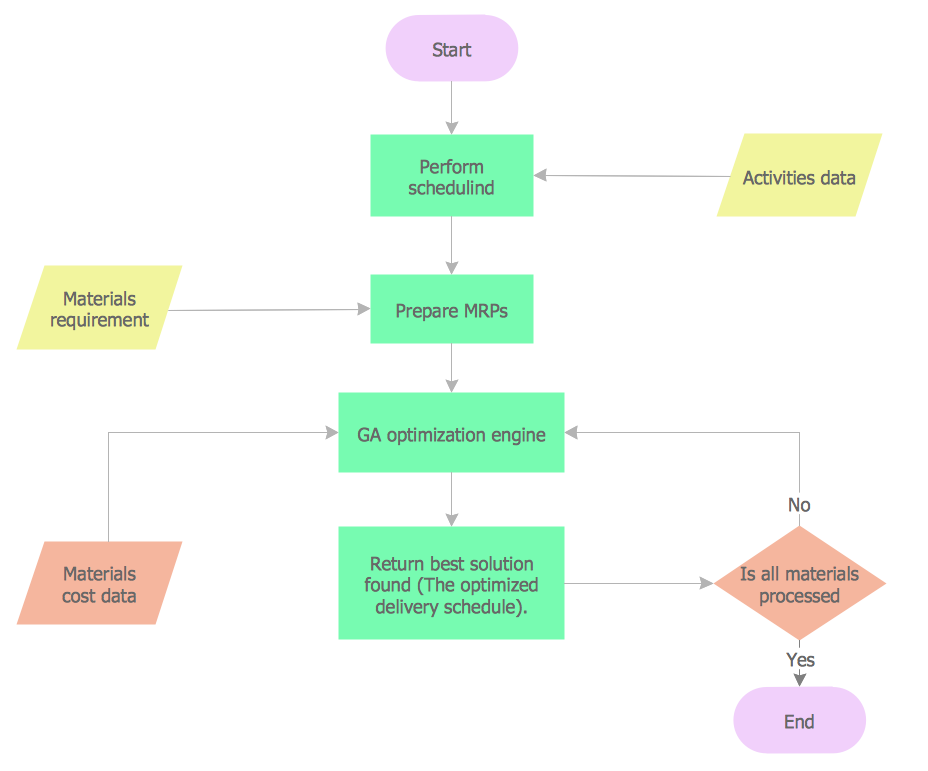
Picture: Material Requisition Flowchart. Flowchart Examples
Related Solution:
During the planning, discussing and execution of a project you may need to prepare a presentation using project views such as the Gantt Chart, Multiproject Dashboard or Resource Usage View. It’s easy do with ConceptDraw PROJECT!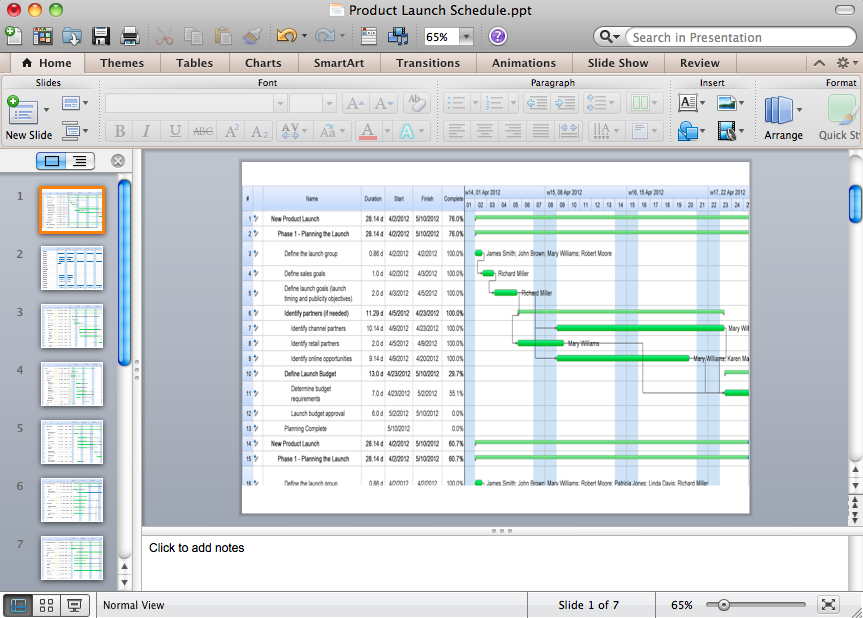
Picture: How to Create Presentation of Your Project Gantt Chart
My friend works as a marketologist. Once he asked me about Marketing and Sales Organization chart, as it was new for him. Luckily, ConceptDraw Solution Park has tons of examples to show to an unexperienced user.
This organizational chart was designed with ConceptDraw DIAGRAM and its Organizational Charts solution, that can be find in the Management section of Solution Park. This solution offers a vector objects library and a set of samples and templates. The vector library contains symbols and icons that provide you with possibility to show the organizational structure of your organization at a glance. It allows to depict the interrelations of authority and responsibility between positions in an organization. Organizational charts provide both employers and employees a clear view of the sale and marketing departments structure, reporting system, management levels.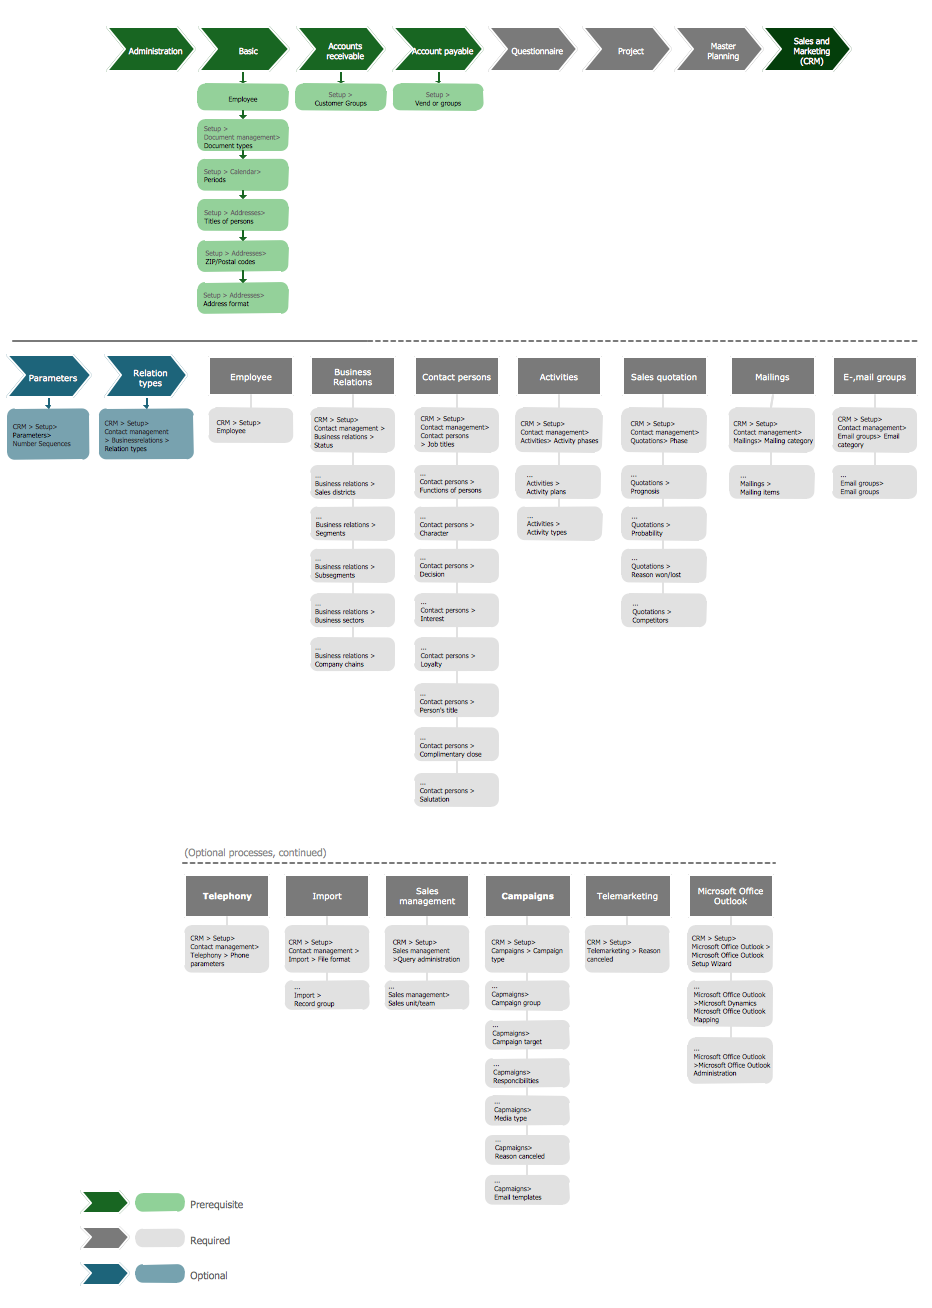
Picture: Marketing and Sales Organization chart.Organization chart Example
Related Solution:
ConceptDraw DIAGRAM diagramming and vector drawing software offers the Pie Charts solution from the Graphs and Charts area which includes the tools for quick and easy designing any kind of Donut Chart.
Picture: Donut Chart
Related Solution:
Electrical plan is a document that is developed during the first stage of the building design. This scheme is composed of conventional images or symbols of components that operate by means of electric energy. To simplify the creation of these schemes you can use house electrical plan software, which will not require a long additional training to understand how to use it. You only need to install the necessary software ant it’s libraries and you’ll have one less problem during the building projection.
Any building contains a number of electrical systems, including switches, fixtures, outlets and other lightening equipment. All these should be depicted in a building electrical plans and included to general building documentation. This home electrical plan displays electrical and telecommunication devices placed to a home floor plan. On the plan, each electrical device is referenced with the proper symbol. Electrical symbols are used for universal recognition of the building plan by different persons who will be working on the construction. Not all possible electric symbols used on a certain plan, so the symbols used in the current home plan are included to a legend. The electrical home plan may be added as a separate document to a complete set of building plans.
Picture: How To use House Electrical Plan Software
Related Solution:
ConceptDraw Word Exchange solution gives you the ability to export mind maps to MS Word. It also allows stylizing the resulting document by using a custom MS Word template.
Picture: Export from ConceptDraw MINDMAP into MS Word Document
An orgchart shows how the responsibilities are divided between departments. It’s enough to have just one look on a proper organizational chart template to understand the idea and how it works. To understand how it’s made you should use a diagramming software.
This organizational diagram illustrates the possibilities of using ConceptDraw DIAGRAM to create orgcharts. This sample represents the common project management company. The chart shows the structure of devisions in the company, and the interaction between them. Communication between departments imply a certain structure affiliation and reporting. At the head of the company - President. This diagram was created using ConceptDraw solution for designing Organizational charts of any structure and complexity.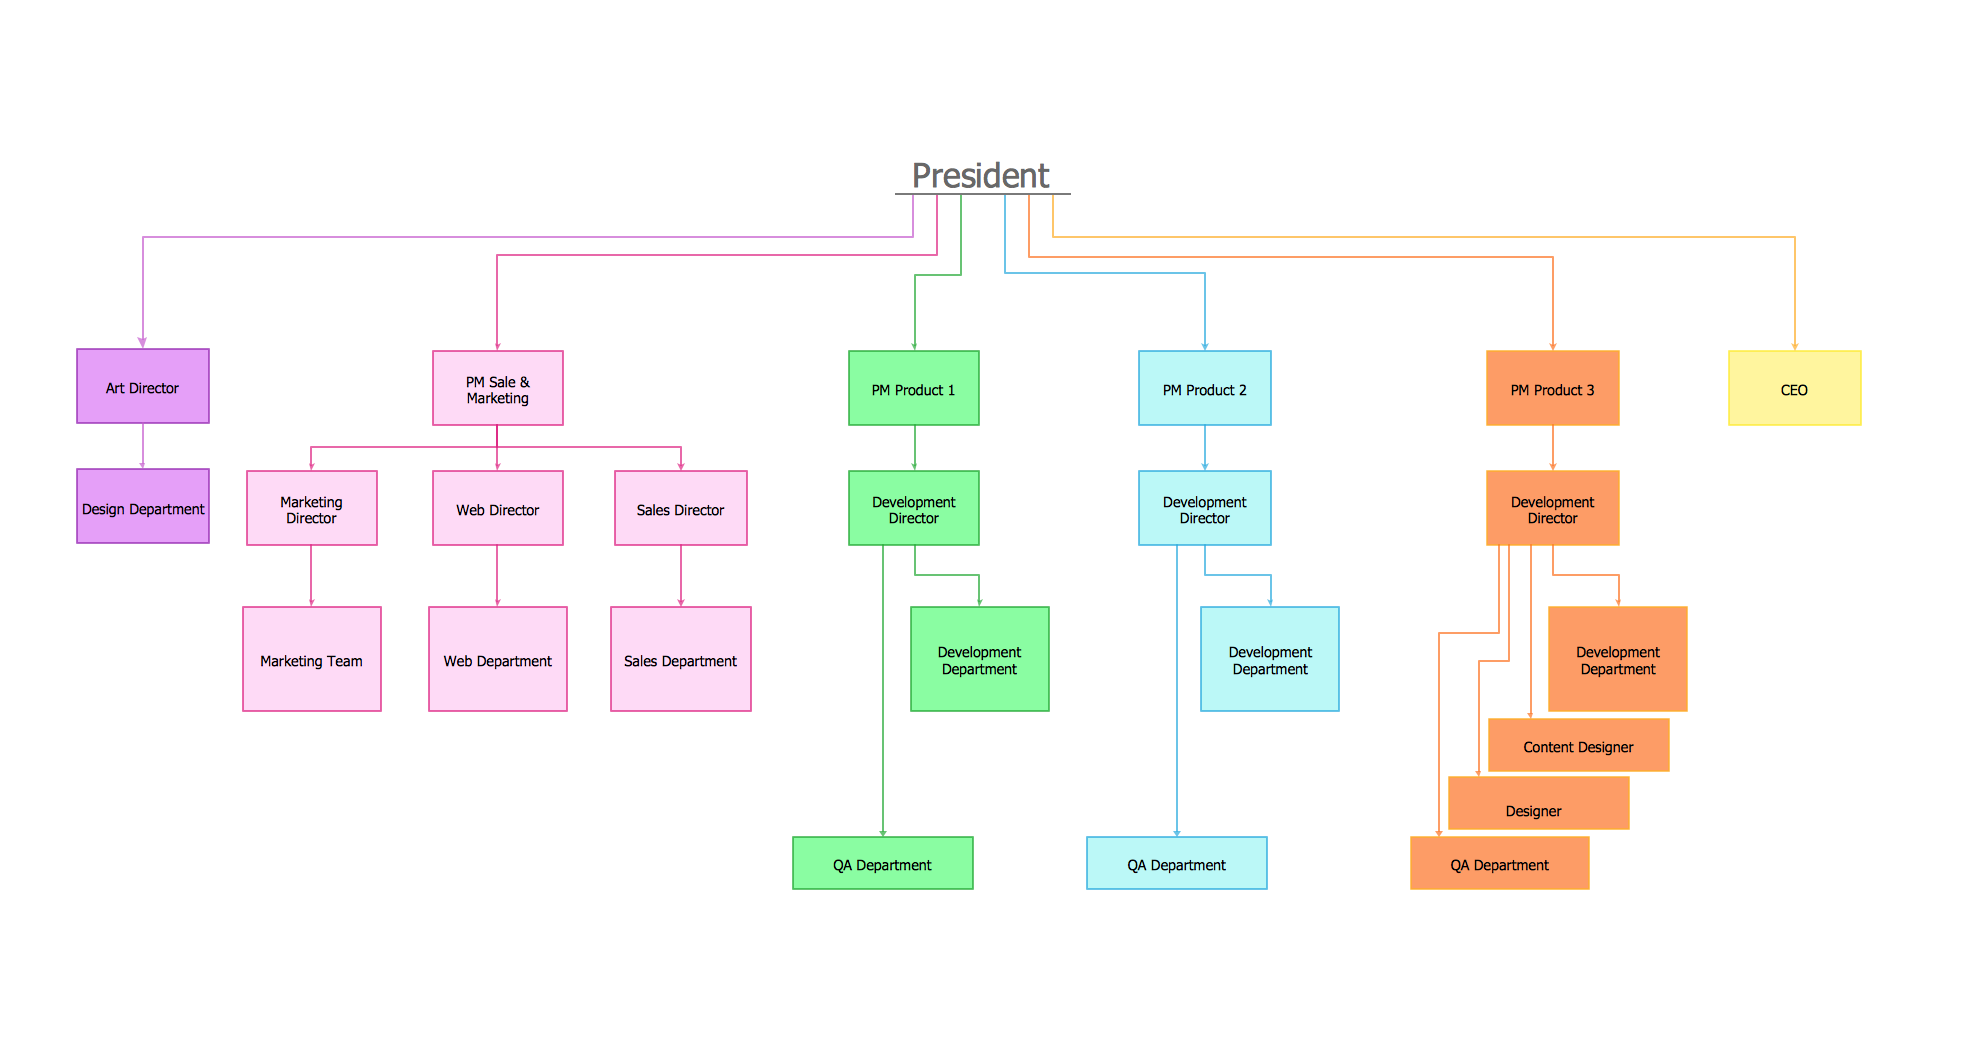
Picture: Organizational Chart Template
Related Solution:
ConceptDraw DIAGRAM software extended with Fishbone Diagrams solution from the Management area of ConceptDraw Solution Park is perfect for Cause and Effect Diagram creating. It gives the ability to draw fishbone diagram that identifies many possible causes for an effect or a problem. Causes and Effects are usually grouped into major categories to identify these sources of variation. Causes and Effects in the diagram show relationships among various factor. Fishbone diagram shows factors of Equipment, Process, People, Materials, Environment and Management, all affecting the overall problem.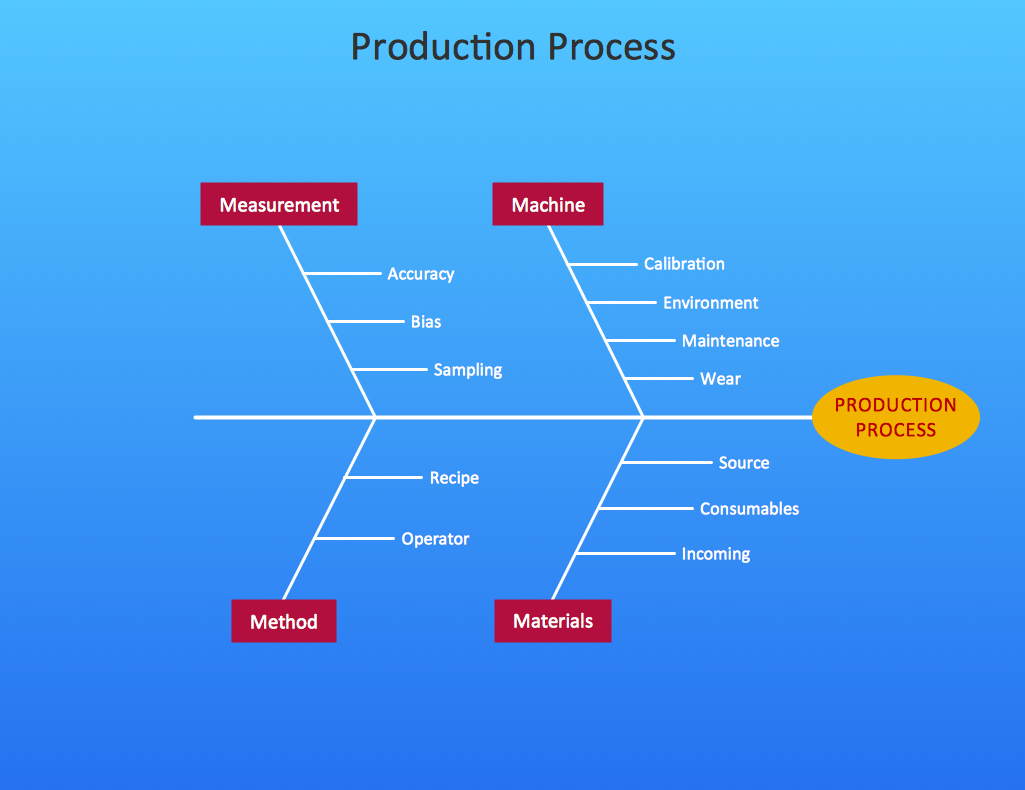
Picture: Cause and Effect Diagram
Related Solution:
ConceptDraw DIAGRAM is the professional business graphic software for drawing diagrams and charts with great visual appeal on Mac OS X.
Picture: The Best Drawing Program for Mac
Related Solution:
When we think of an hierarchy, we intuitively imagine a pyramid. Thus, a lot of management tools use pyramid charts as examples or illustrations of various documents or models. You can create any type of triangle diagram using ConceptDraw DIAGRAM.
A triangle (pyramid) diagram is often used in marketing to show the data hierarchy. This pyramid diagram represents the Top Brand Model. It illustrate the model of rebranding strategy. It can be used by marketing agency dealing with rebranding strategies development. It’s critical for marketing diagrams to be both clear and eye catching. ConceptDraw Pyramid diagrams solution meet all these requirements and can be successfully applied for creating and presenting various marketing pyramidal diagrams.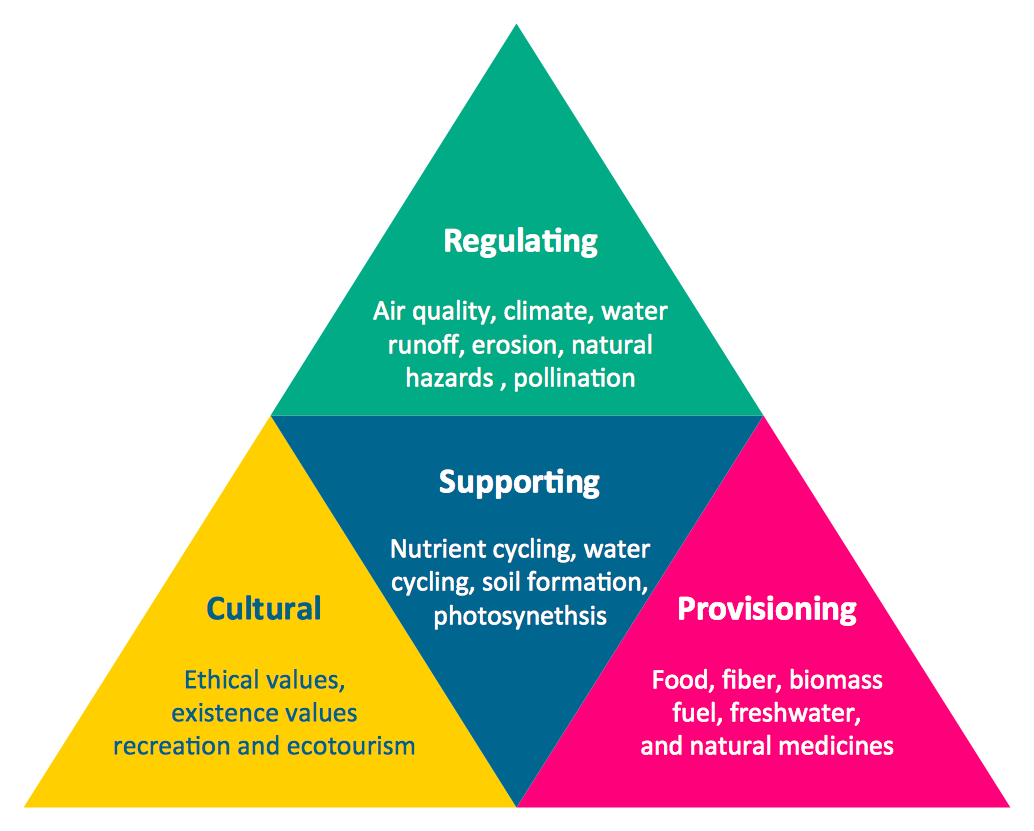
Picture: Pyramid Chart Examples
Related Solutions:
