
Sample 1. Basketball Plays 1–4 Stack Offense Pick and Roll Play
The wide collection of predesigned templates and samples of the Basketball solution for ConceptDraw DIAGRAM depict the diagrams of the most popular basketball offensive and defensive strategies and tactics:
- 1–4 Stack Offense Pick and Roll Play
- Triangle Offense
- 3–on–3 Play
- 1–4 low Stack Offense
- Man-to-Man Defense

Sample 2. Basketball Plays – Triangle Offense
The Basketball solution templates and samples are so various that will be suitable for any case. They are ready-to-modify and you can simply change any of them for your needs.
The Basketball solution for ConceptDraw DIAGRAM contains also two libraries with ready-to-use predesigned vector objects of the basketball courts and positions.

Sample 3. Basketball Plays – 3– on– 3 Plays
It's incredibly easy and quick to create the basketball-related drawings in ConceptDraw DIAGRAM Use the "Basketball Courts" and "Basketball Positions" libraries from the Basketball solution and follow the next steps to create your own basketball play diagram quick and easy:
- From the "Basketball Courts" library drop a court object to your document;
- From the "Basketball Positions" library drop all positions object you need to your document;
- Place positions on the court according to your drawing idea;
- Add arrows or text labels if needed.

Sample 4. Basketball Plays – 1–4 low Stack Offense
The samples you see on this page were created in ConceptDraw DIAGRAM using the vector objects from the "Basketball Courts" and "Basketball Positions" libraries from the Basketball solution. They demonstrate the solution's capabilities and the professional results you can achieve. An experienced user spent no more than 10 minutes creating every of these samples.
All source documents are vector graphic documents. They are available for reviewing, modifying, or converting to a variety of formats (PDF file, MS PowerPoint, MS Visio, and many other graphic formats) from the ConceptDraw STORE. The Basketball Solution is available for all ConceptDraw DIAGRAM or later users.
NINE RELATED HOW TO's:
Food courts are one of the most rapidly developing areas of the restaurant business. ConceptDraw DIAGRAM diagramming and vector drawing software offers a Food Court solution from the Food and Beverage area with wide capabilities for planning, design, developing and advertising of a Food Court.
Picture: Food Court
Related Solution:
Cisco Network Diagrams solution from the Computer and Networks area of ConceptDraw Solution Park provides 14 libraries with 450 ready-to-use predesigned vector objects that can be used for quickly and easily drawing the professional Cisco Network Diagrams.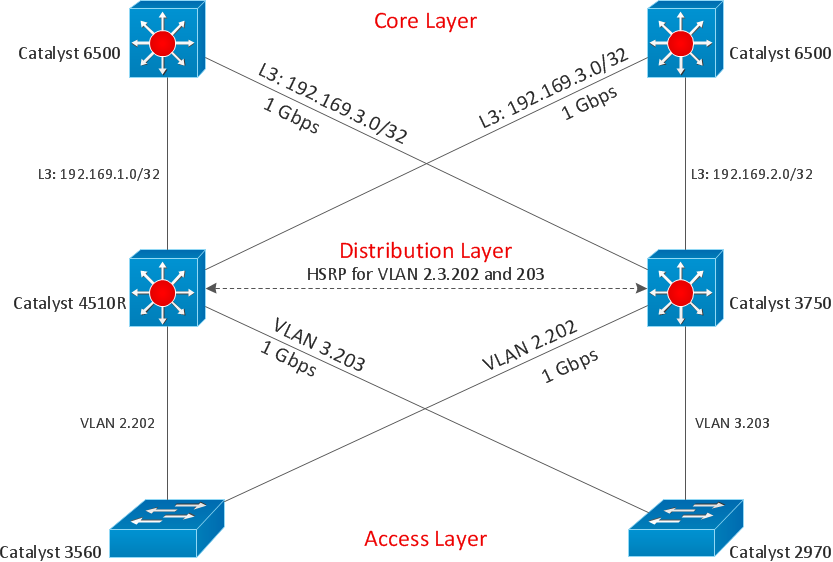
Picture: Cisco Design
Related Solution:
A triangular graphic representing Graham's hierarchy of disagreement, based on Paul Graham's March 2008 essay How to Disagree.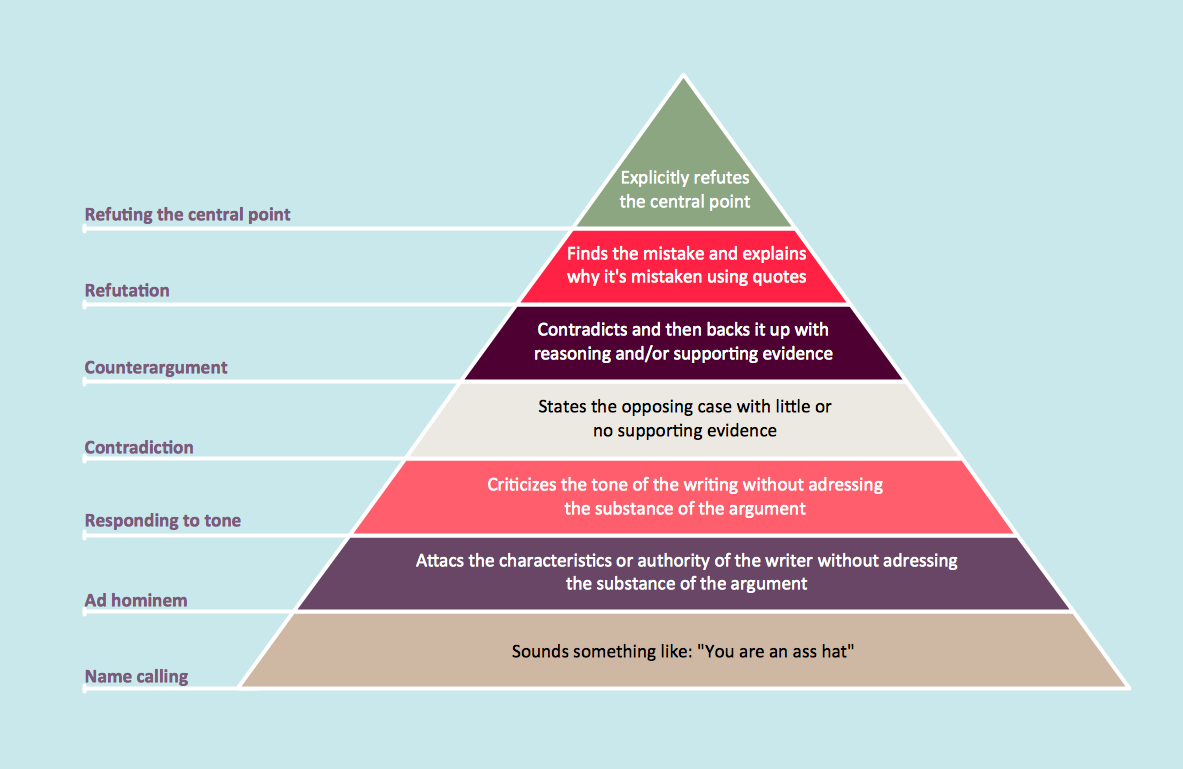
Picture: Pyramid Diagram
Related Solutions:
Visual depiction is key secret to successful understanding baseball strike zone dimentions. Baseball strike zone diagram illustrated using ConceptDraw DIAGRAM software enhanced with the Baseball solution.
Picture: Baseball — Pitching and the Strike Zone
Related Solution:
It's obvious that any building has a plan, and it is a hard and diligent work to draw one. And it's great that nowadays there are software tools for those purposes. For instance, ConceptDraw Pro contains design elements depicting different parts of sport fields. It's easy to use them and it facilitates your work exponentially.
Planning of athletic facilities, playgrounds and Leisure Centers, needs thoughtful and creative approach. Any layout regarding to sport facilities should satisfy the requirements of both athletes and spectators. Well designed sport fields , playgrounds and recreation spaces attract people to sport activities in the cities and countryside. ConceptDraw Sport Field Plans solution is useful and convenient professional drawing tool. It delivers the kit of vector libraries that can be used for representing sport fields, sportgrounds and recreation spaces: football, hockey, volleyball, cricket, basketball , swimming pool, etc.
Picture: Building Drawing Software for Design Sport Fields
Related Solution:
Local area network connects computers and other network appliances within an area, such as office building or a campus. It can be difficult to provide such network without a predesigned plan. For these purposes you can use network diagram software, which helps you to create LAN network diagrams and office network diagrams quickly and effortless. This will speed up your work and you can save the diagram for the future network improvements.
The following diagram illustrates a network topology of the small office. LAN configuration has a star topology. The local network joins 8 computers among which are several desktop PCs, laptop, two iMacs and iBook. The end-point devices are divided into three groups. Each group is connected to its hub. There is a network printer and a modem, which are interconnected with other devices through a network server. Each computer on the LAN can access the server through a corresponding hub.
Picture: Network Diagram Software. LAN Network Diagrams. Physical Office Network Diagrams
Related Solution:
The calendars around us everywhere in the modern world. There are a lot of calendar types, each of them has its own assignment: Business calendar, Personal calendar, Economic calendar, Financial calendar, Daily calendar, Monthly calendar, and many other useful calendar types. ConceptDraw DIAGRAM offers you the possibility to make your own unique calendars on the base of the Blank Calendar Template which is included to the Calendars Solution from the Management Area.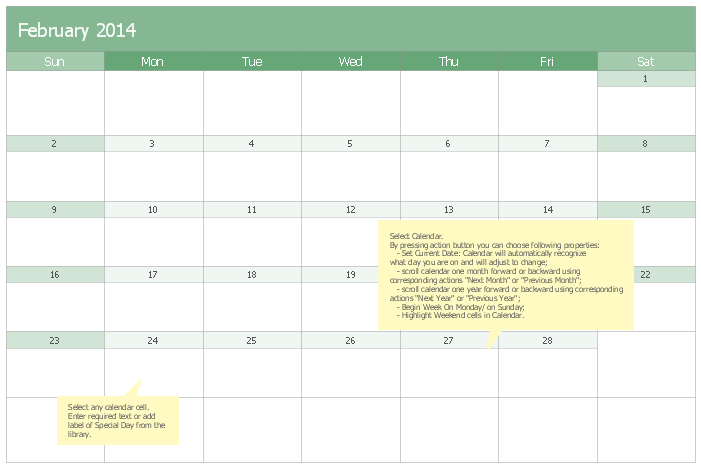
Picture: Blank Calendar Template
Related Solution:
Chemical and Process Engineering solution contains variety predesigned process flow diagram elements relating to instrumentation, containers, piping and distribution necessary for chemical engineering, and can be used to map out chemical processes or easy creating various Chemical and Process Flow Diagrams in ConceptDraw DIAGRAM.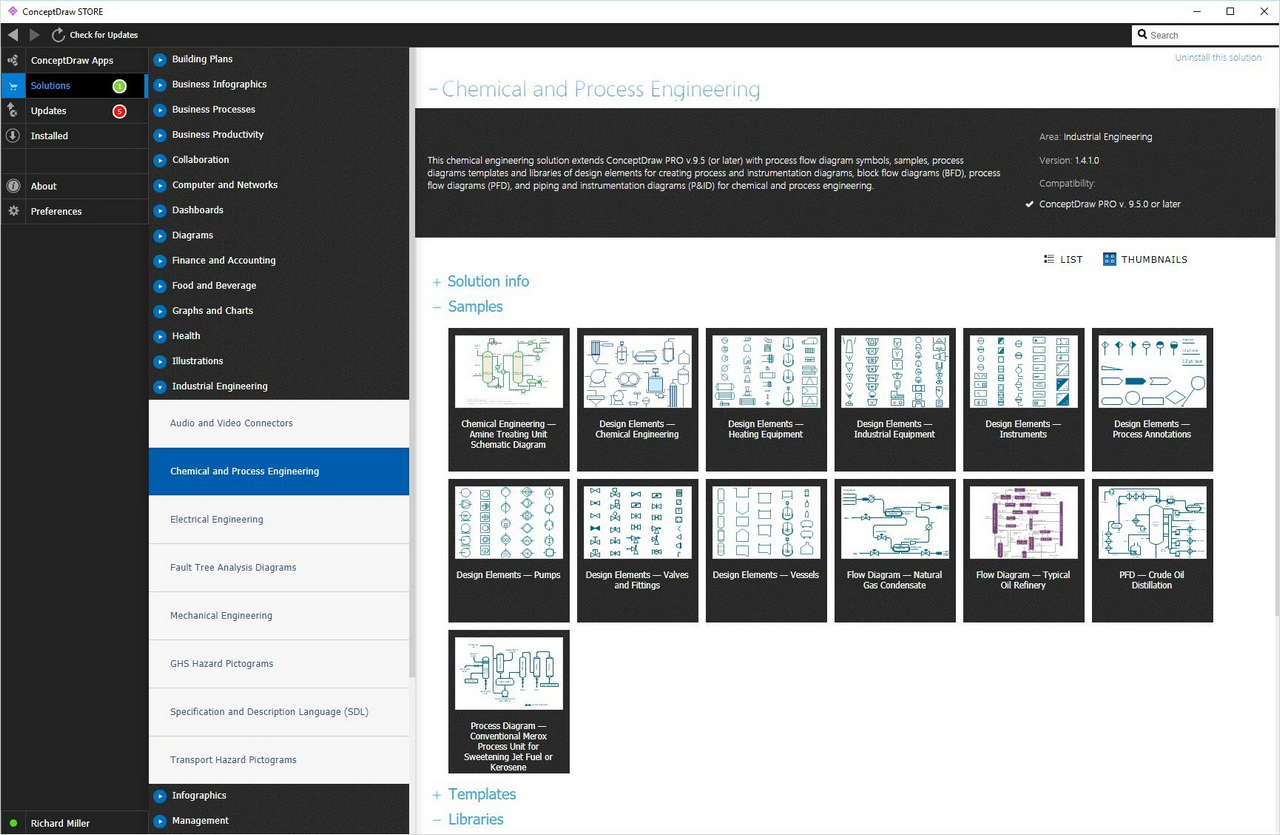
Picture: Process Flow Diagram Symbols
Related Solution:
Designing landscapes nowadays doesn’t require any special skills. Therefore, it’s not rocket science how to use landscape design software and create detailed plans and projects. Special Landscape & Garden Solution from the Building Plans area of ConceptDraw Solution Park provides vivid ready-to-use vector objects of trees, bushes, fences, furniture etc.
Picture: How To use Landscape Design Software
Related Solution:


