Best Value — Total Quality Management
For Chin et al. 2001, TQM is an inclusive approach whose aim is to pursue customer satisfaction. This purpose has generated a growing interest in various sectors of economy such as manufacturing, services, Government and education in different countries around the world. [Total quality management. Wikipedia]

Pic.1 TQM diagram: Business process.
This diagram was created in ConceptDraw DIAGRAM using the TQM library from the Total Quality Management (TQM) Diagrams solution. An experienced user spent 5 minutes creating this sample.
Using ConceptDraw DIAGRAM connectors to create TQM diagram is an intuitive and time-saving solution. This example shows a business process diagram that can be then analyzed for ways to improve the process effectiveness and diagnose quality issues that require resolution.
See also Samples:
TEN RELATED HOW TO's:
The visual form of mind maps is helpful in all stages of quality management, from describing problem to describing and documenting a decision.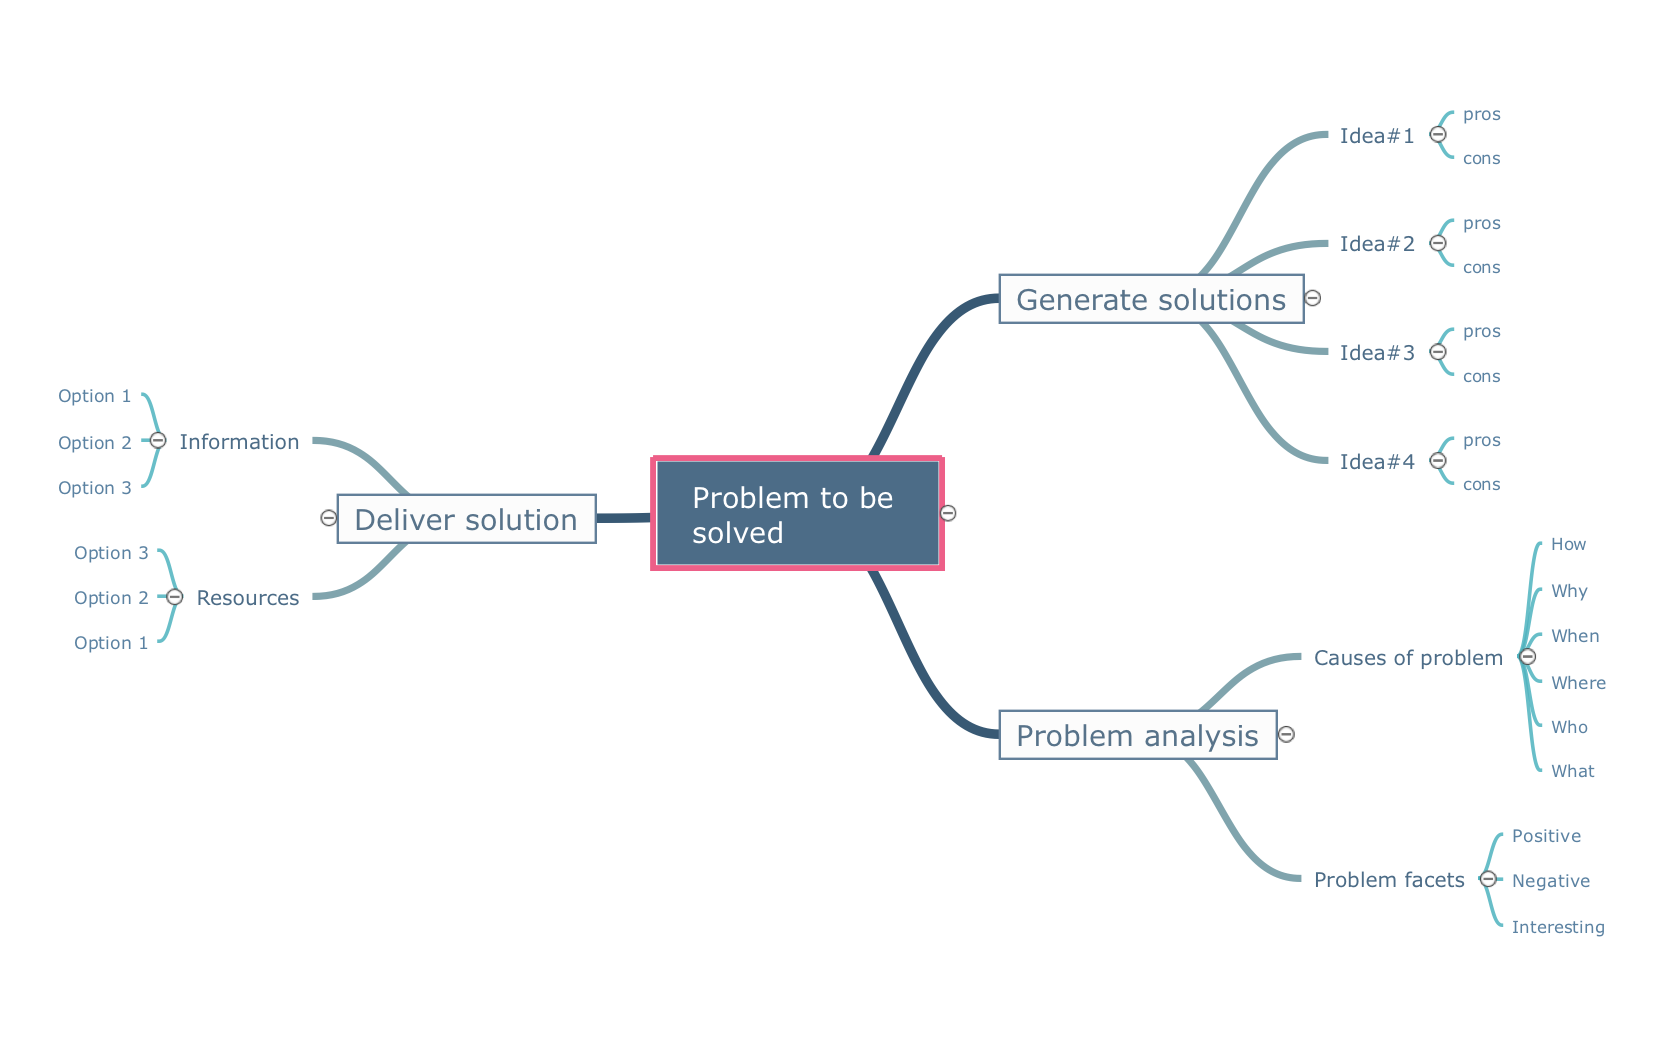
Picture: Quality Project Management with Mind Maps
Related Solution:
Biology solution offers 3 libraries of ready-to-use predesigned biology symbols and vector clipart to make your biology drawing and biology illustration making fast and easy: Carbohydrate Metabolism Library, Biochemistry of Metabolism Library, Citric Acid Cycle (TCA Cycle) Library.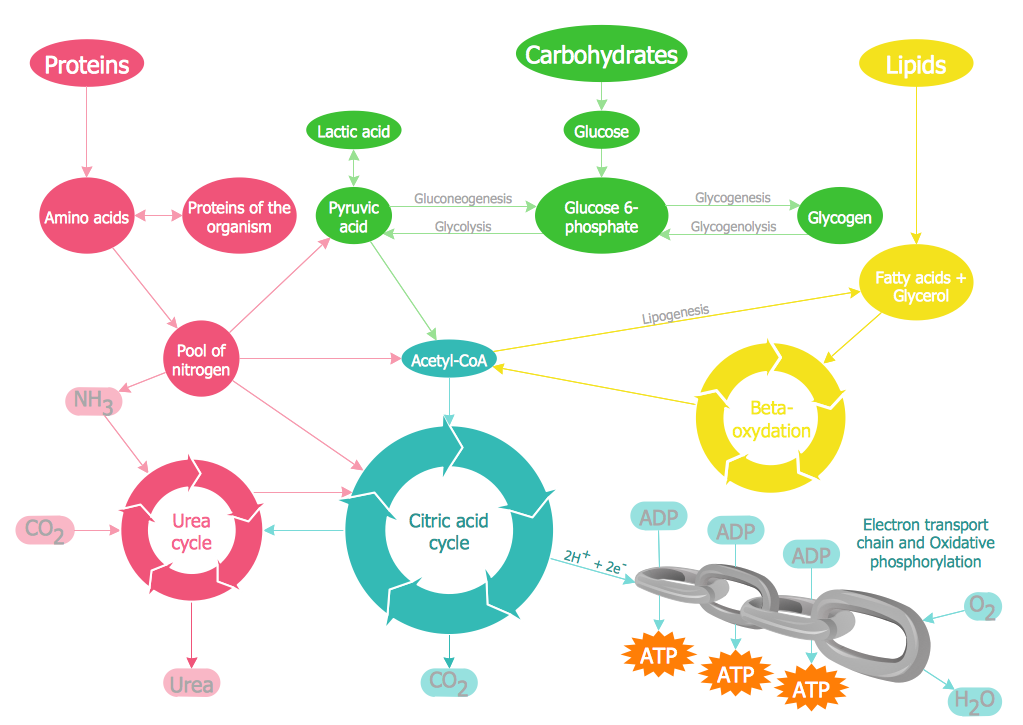
Picture: Biology Illustration
Related Solution:
Nowadays, more and more attention is paid to the comfort in the workplace, so that employees might be more motivated. Thus, it can be said with full confidence that office layout plays an important role for employees and influences company reputation. Many worldwide known companies have headquarter offices resembling more of a campus than of an office building.
Every organization has its own unique office design ideas, needs and requirements. Each of office position requires a certain type of person who has his own requirements, needs and habits. Office layout should be designed to facilitate its business function. The well-organized office space plays an important role in a workflow enhancement and productivity improvement. This office layout diagram demonstrates a typical cubical office layout. This diagram can be use as a template for cubicle office layout organization. This visual example can help shape ideas and design your office layout conception. You can start with adding your requested office furniture objects into your office floor plan. Plants help to create a healthy indoor environment. You can design an office space that totally fits your needs.
Picture: Office Layout
Related Solution:
ConceptDraw DIAGRAM can help you make professional diagrams quickly.
Picture: Best Software to Draw Diagrams
Related Solution:
In ConceptDraw DIAGRAM it really is sp simple to draw even the most complex cross-functional flowcharts. Use the RapidDraw technology and Cross-Functional libraries in ConceptDraw DIAGRAM for the best results.
Picture: How to Simplify Flow Charting — Cross-functional Flowchart
Related Solution:
ConceptDraw DIAGRAM extended with Typography Infographics Solution from the “Infographics” Area is the best Infographic Generator. Make sure in it right now!
Typography Infographics Solution offers you the best numerous collection of predesigned infographics examples and 9 libraries with large quantity of ready-to-use vector stencils that will help you design your own Typography Infographics of any complexity in minutes..
Picture: Infographic Generator
Related Solution:
Don't let your first glance fool you. ConceptDraw is a lot easier to use than it looks. Use its cross-functional templates and library as basics to get started.
All you need to know are a few basic steps and terms.
ConceptDraw Arrows10 Technology is a new age in drawing software. Use it for process flows and its new rapid draw feature enables to draw an impressive charts in a seconds.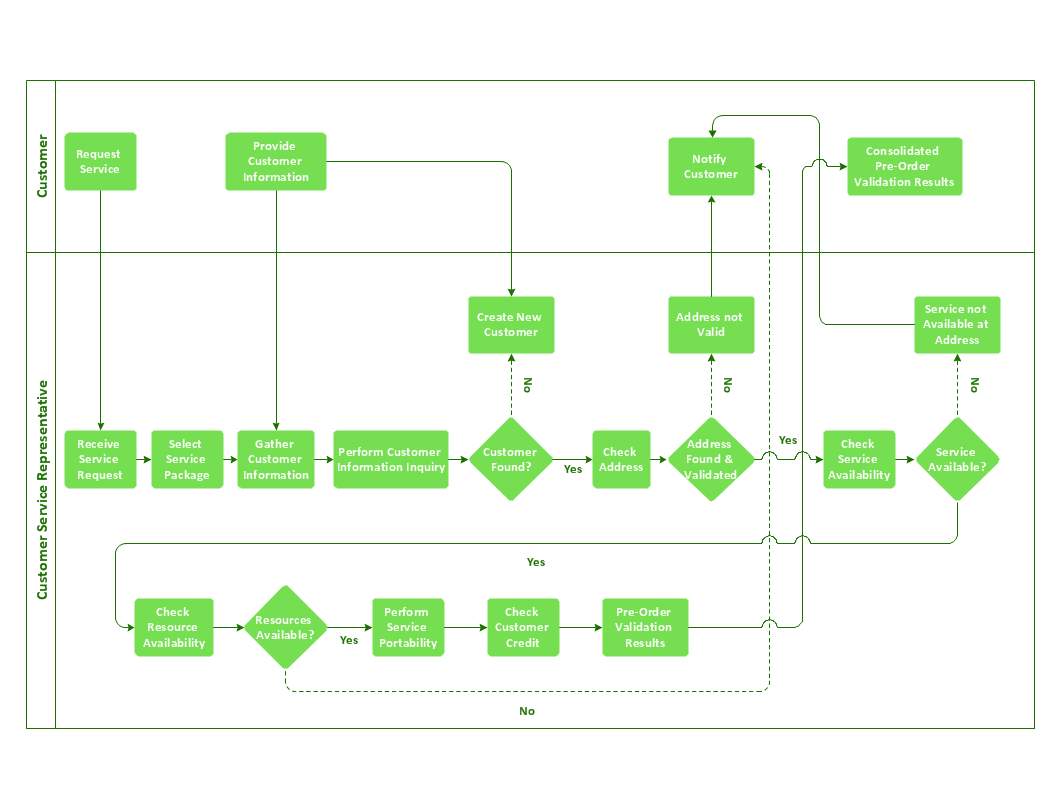
Picture: Cross-Functional Flowchart Basics
The Value Stream Mapping solution extends ConceptDraw DIAGRAM software with a new library that contain vector objects, samples and templates.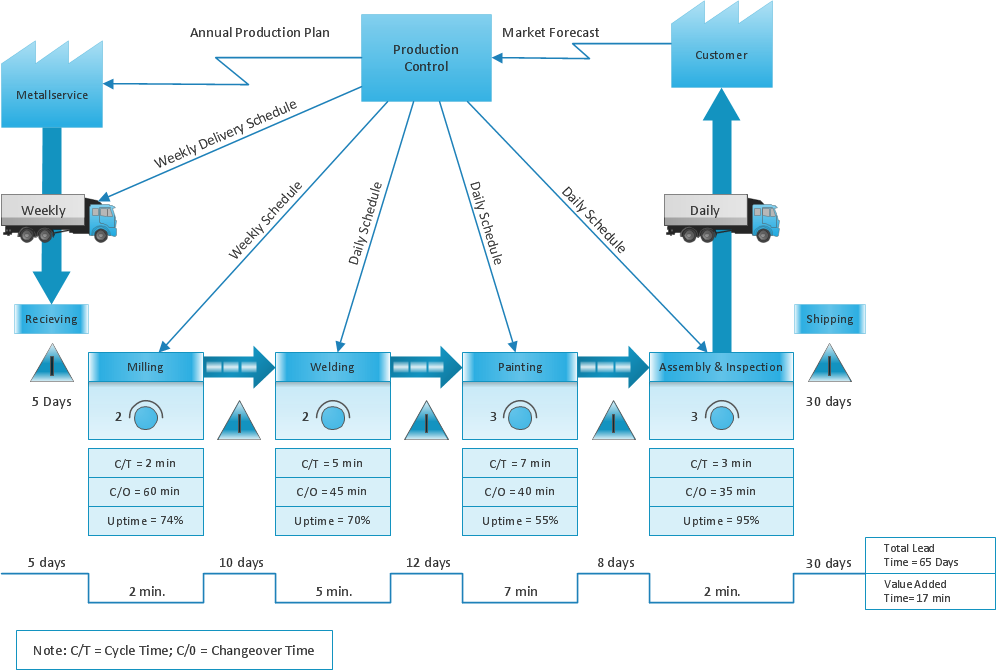
Picture: Sections of the Value Stream Map
Related Solution:
The Flowcharts are widely used in engineering, architecture, science, analytics, government, politics, business, marketing, manufacturing, administration, etc.
Picture:
Flowchart of Products
Flowchart Examples
Related Solution:
ConceptDraw the easy flowchart software that gives users the ability to draw any type of flowcharts. Fast visualization of the structured data with the vector stencils from object libraries by using RapidDraw technology.
Picture: Easy Flowchart Software
Related Solution: