Booch OOD Diagram
Working in the IT company or at least being interested in what is going on in this field of business activity, you might be interested in so called “Booch method”, which is used for developing the software object-oriented-wise. This Booch method includes the use of object modelling language, the recommended and time-tested practices as well as an object-oriented development process.
This Booch method was developed by Grady Booch, that is why it has such name. This method was very popular and world widely used in the engineering, especially in the software engineering for conducting the object-oriented analysis as well as the design of some software from the support tools and documentation.
The Booch method was a base for developing the Unified Modelling Language, also known as “UML” as the graphical elements of this UML come from the Booch method as well as the object-oriented software engineering (OOSE) and the object-modelling technique (OMT). Some other methodologies and processes were taken from some of the aspects of the Booch method as well.
There are quite many diagrams, which can be created basing on the Booch method, such as: Object one, State transition, Interaction, Module one as well as Process diagram. Each of the diagrams mentioned above can be made using our unique and very useful software, which is ConceptDraw DIAGRAM application. With help of ConceptDraw DIAGRAM you can create any of the diagrams, including those based on the Booch method, only within a couple of hours or even minutes if you know how to work in this software already. Although, if you are the beginner and you just started using ConceptDraw DIAGRAM then you can always find lots of tutorials we provide, in a way of articles on this site and videos on Youtube.
Having ConceptDraw DIAGRAM is always very beneficial as it allows you to create any needed drawing, not only diagrams, but also charts, flowcharts, maps, plans, schemes and other schematics using truly convenient in use and so very helpful software. Having ConceptDraw DIAGRAM as well as ConceptDraw STORE can simplify your work as well as your life as CS Odessa team of IT specialists developed lots of solutions, where you can find already previously created templates and samples, which all are available also on this site. These templates as well as examples can be used as your own drafts for your own unique drawings as you can always change any of the elements of the schemes, plans, flowcharts, charts, maps and diagrams and in this way to edit them.
Thus, if you have to create one of the diagrams based on the Booch method, such as Class diagram, for example, being a type of a static structure diagram, with the help of which you can describe the structure of a system in a way of showing the system’s classes, their operations, methods, attributes as well as relationships between their objects, then you can simply choose one of already pre-made class diagrams in the solution and edit it the way you want: to add more blocks to it and so to put more data, to change the way it looks like, etc. Simple!
Although, if you want to make your own class diagram from scratch, then you have to take these notes into consideration: first of all, in this type of diagram, the classes are all illustrated in a form of boxes, containing top, middle and bottom compartments. The top compartment usually contains the name of the class itself. It is usually centred with the first capital letter in its name. The middle one has the attributes of the class. They are usually illustrated on the left and the first letter is usually lowercase. The very last, the bottom compartment contains the operations, which this class can execute. They are usually also illustrated on the left and the letter is also lowercase.
If you want to create an object diagram as well, which is the one with the aid of which you can show a partial or a complete view of some particular structure of already existing modelled system at a certain period of time, then, again, you can pick any of the examples you like and use them as your drafts, combining or using separately changing anything you want to be changed. In this way it is always quicker and simpler to create diagrams, that is why especially for ConceptDraw DIAGRAM users our CS Odessa team of professional IT specialists, including the designers, developed the incredible and very useful solution – the “Software Engineering” one. This solution can be found in the Software Development area of ConceptDraw Solution Park on this site or, if you have ConceptDraw STORE downloaded to your desktop, then you always can get one from there as well.
State transition diagrams are used from the very beginning of the process of the object-oriented modeling. They are used for defining a machine that has a number of states and which receives the events from the outside world. Each of the events can cause the machine transition from one state to another. The state transition diagram indicates that a full bottle does not receive squirt events. It also shows that an empty bottle does not receive cap events. Thus, you can understand what events should occur and what effect they can have on some particular object using state transition diagram.
Interaction Overview diagram is the one which is used for controlling the nodes flow and it is very similar to another diagram, called the Activity one. Both of them are used for simple visualization of some activities sequence. The difference between the interaction and activity diagrams is that an interaction overview each of the individual activities is illustrated as a frame and each of such frames contains a nested diagram itself. Having the Software Engineering solution means having all of the necessary tools for making class, object, state transition, interaction, module and process diagrams within only a short period of time. This solution includes the vector stencils library “Booch OOD” containing all of the needed specific symbols of the Booch method, such as class symbols, association symbols, aggregation symbols for using while working with ConceptDraw DIAGRAM diagramming and vector drawing software.
Primary Types of Booch OOD Diagrams
The Booch method includes six types of diagrams:
- class,
- object,
- state transition,
- interaction,
- module and process.
The vector stencils library Booch OOD from the solution Software Engineering contains specific symbols of the Booch method such as class symbols, association symbols, aggregation symbols for ConceptDraw DIAGRAM diagramming and vector drawing software. The Software Engineering solution is contained in the Software Development area of ConceptDraw Solution Park.
Use the Software engineering solution to draw Object-oriented design (OOD) diagrams for your business documents, presentations and websites.
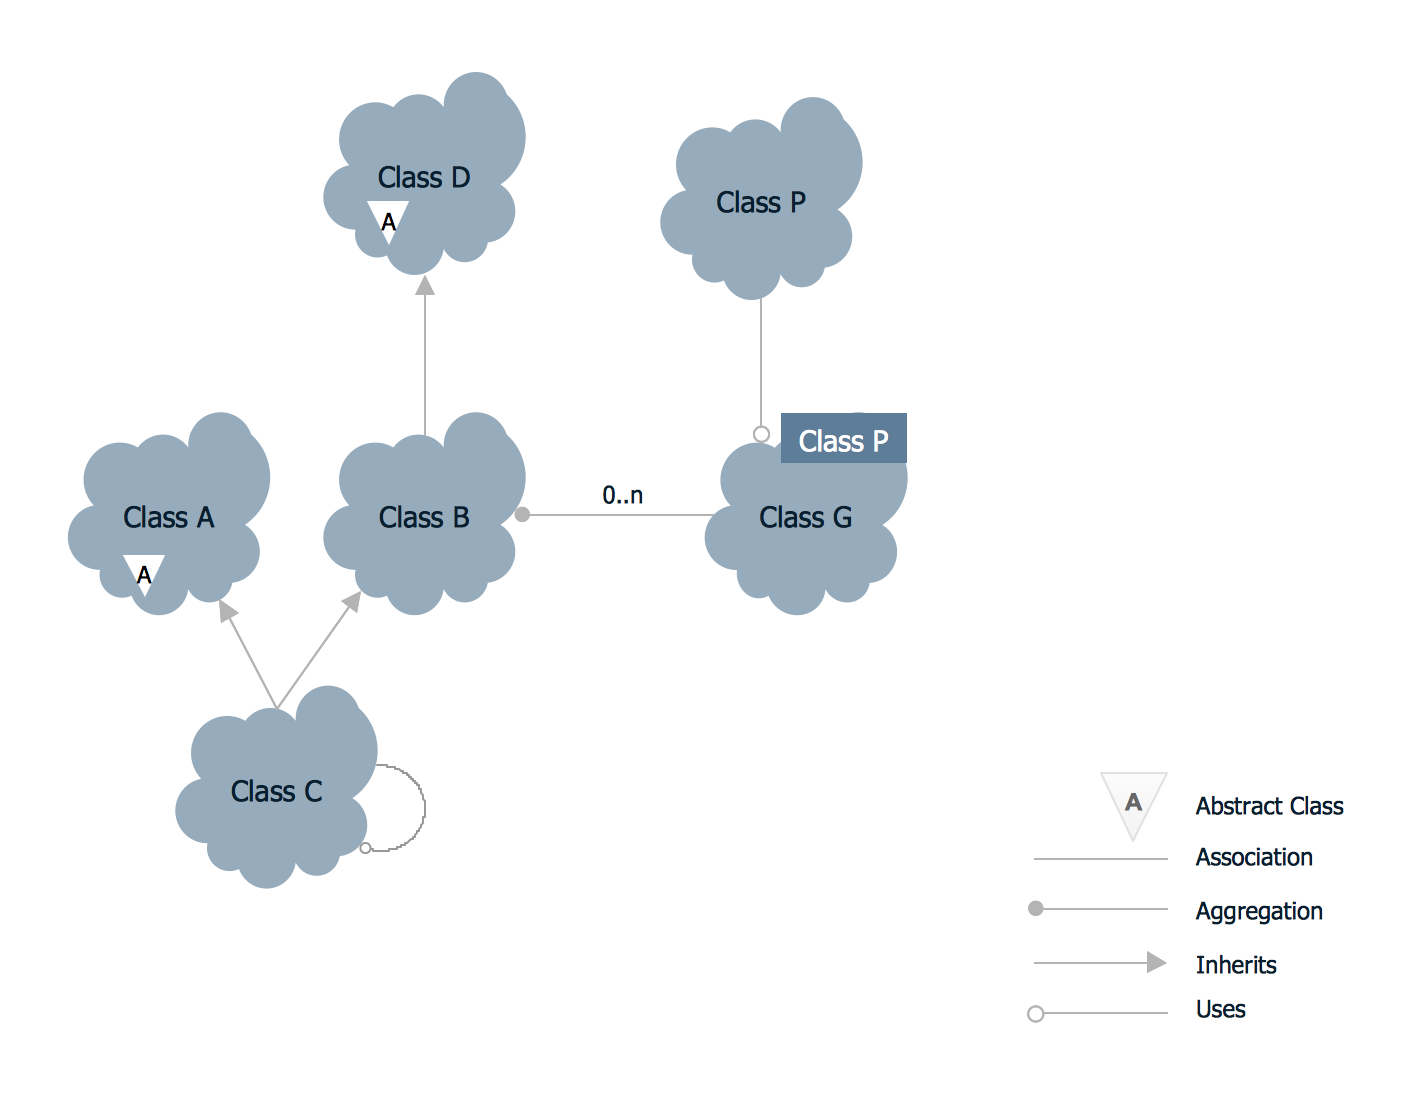
Example 1. Booch OOD Diagram
The example above illutrates the Booch method usage for a climate control system.
ConceptDraw DIAGRAM is a Perfect Tool for:
- Designing and planning tasks such as:
- Jacobson Use Cases Diagram
- SSADMN Diagram
- Yourdon and Coad Diagram
- Command OLE Diagram
- Block Diagrams
- Data Modeling Diagram
- SysML Diagram
- Chen RED Diagram
- Martin RED Diagram
- IDEF0 Diagram
- Gane Sarson Diagram
- Memory Object Diagram
- Data Flow Diagram
- FlowCharts
- Graphic User Interface (GUI)
- UML Diagram
- Program Structure Diagrams
- ORM Diagram
- Developing Visualization Solutions
- Project Planning (Gantt Charts, Timelines, Project Schedules)