Business Architecture
Being involved in such business activity as business architecture, you may find ConceptDraw DIAGRAM diagramming and drawing software a useful tool for making only good looking as well as smart looking illustrations as it is one of the best applications nowadays, in a line with another product of CS Odessa — ConceptDraw STORE.
There’s a Business Architecture Working Group of the Object Management Group which appeared in 2010, known to be describing business architecture as "a blueprint of the enterprise”, known to be providing some common understanding of some organization, used for aligning the tactical demands and the strategic objectives. People who work on developing and maintaining any business architecture are known to be called as the “business architects”. Such people may find Enterprise Architecture Diagrams Solution from ConceptDraw STORE a very helpful one for getting all the necessary tools for making the business architecture related drawings using ConceptDraw DIAGRAM

Example 1. Business Architecture — USDA Enterprise Architecture
Business architecture is sometimes called as “the bridge between the enterprise strategy and the enterprise business model as well as the business functionality of any enterprise” where it is used. The term of the "business architecture" itself can be also used for meaning some architectural description of some enterprise or of some business unit, some profession or some architectural model. According to the Object Management Group, which was already mentioned before, a blueprint of one of the types of business architecture describes "the structure of the enterprise in terms of its governance structure, business information and business processes".
The profession of business architecture is known to be focused on the operational, motivational and analysis frameworks, linking the mentioned aspects of the enterprise all together. The major characteristic of any business architecture: it is known to be representing real world aspects of some business, describing the way they interact with each other. Any business architecture is developed by some practice area, usually interdisciplinary, which is known to be focused on such processes (as well as the results of such processes) of defining and analysing the usual numerous concerns of what exactly business does, in what way it works, in what way it is organized, etc.
Business architecture is also used for designing the competitive structures and numerous processes, leveraging the already existing strengths, identifying the potential investment opportunities which all known to be advancing the business’s objectives, driving innovation. All the products of any business architecture efforts can be used for developing plans, making business decisions as well as guiding any implementations.
Any business architecture effort can be conducted on its own as well as in a way of a part of some enterprise architecture (you can find more information about enterprise architecture in other articled on this site simply going to the “Search” button on the top right corner). An enterprise architecture was very popular in the past, being focused mainly on the technological aspects of change. Such practice was very fast evolving using a business architecture approach for addressing the organizational as well as motivational aspects of change.
The comparison between such terms as “business architecture” and “enterprise architecture” is simply a natural architectural comparison of two related disciplines, as any business architecture is known to be representing some business in the absence of any internet technology architecture and any enterprise architecture is known to be providing an overarching framework for business and internet technology architecture.
To make it possible to develop some particular integrated view of some enterprise, there are many different views of some organization, which are usually developed. Each of such "views" is usually a simple diagram, illustrating a way of understanding the enterprise in a way of highlighting the specific information about it. The main views of any enterprise address several aspects of the enterprise, which were summarized by the Object Management Group in 2012, including such statements as any “Business Strategy view captures the strategic and tactical goals which drive any organization forward”, etc. One of the other statements is that the Business Capabilities view may describe the major business functions of any enterprise as well as its pieces, known to be performing the mentioned functions.
The Value stream view can be defining the so-called “end-to-end” set of different activities which are known to be delivering a value to both external and internal stakeholders. Any Business Knowledge view can establish the customers, orders, suppliers, etc., within some particular organization as well as all the relationships between the mentioned semantics, such as customers names, orders dates, suppliers names, etc.

Example 2. Enterprise Architecture Diagrams Library Design Elements
Any business strategy can consist of such elements as strategy statements, applied and/or generic business models, organizational objectives and goals and others. Any strategic statements are known to be arranged and analysed in a hierarchical way, with help of different techniques, such as well known qualitative hierarchical cluster analysis that always can be illustrated with help of ConceptDraw DIAGRAM Based on the mentioned hierarchy the initial business architecture can be further developed, using general methods as well as a business administration theory.

Example 3. Business Architecture
The drawings which can be related to the described field of business activity, can always be simply created in ConceptDraw DIAGRAM diagramming and drawing software with a usage of ConceptDraw STORE application that is known to be providing numerous “solutions” with the pre-made examples and templates, which all can be used as the drafts for all the ConceptDraw DIAGRAM users.
TEN RELATED HOW TO's:
The UML diagram is a powerful tool which lets visually represent all system's components, the interactions between them and relationships with external user interface.
The Rapid UML solution for ConceptDraw DIAGRAM software offers diversity of UML flowchart symbols for drawing all types of UML diagrams.
Picture: UML Flowchart Symbols
Related Solution:
Any bar chart can be also called as a bar graph or a column chart or graph. Being a chart or a graph that is commonly used for presenting some categorical data with the rectangular bars having their lengths or heights proportional to the values that they represent, such drawings can be made with the help of the ConceptDraw DIAGRAM diagramming and drawing software. The created bars can be plotted either vertically or horizontally and any vertical bar chart can be also sometimes called as a line graph.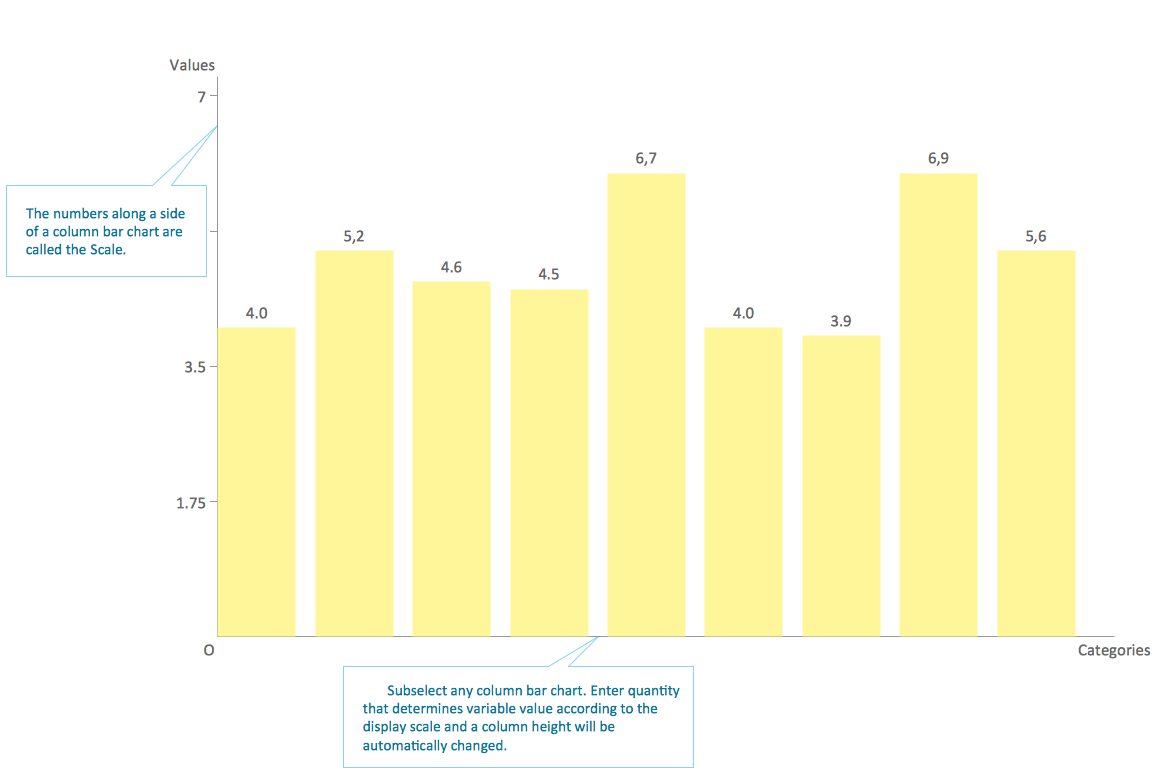
Picture: Column Chart Template
Related Solution:
A flowchart is a powerful tool for examining processes. It helps improving processes a lot, as it becomes much easier to communicate between involved people, to identify potential problems and to optimize workflow. There are flowcharts of different shapes, sizes and types of flowchart vary from quite basic process flowcharts to complex program flowcharts. Nevertheless, all these diagrams use the same set of special symbols like arrows to connect blocks, parallelogram to show data receiving or rectangles for showing process steps.
Basic flowcharts are used to represent a simple process algorithm. A basic flowchart notation consists of rectangles (business processes), arrows (the flow of information, documents, etc.). The same notation is used in items such as the "decision", which allow you to do the branching. To indicate the start of the entire business process and its termination can be used the "Terminator" element. The advantages of Basic Flowchart are simplicity and clarity. With it you can quickly describe the business process steps. Creating of Basic Flowchart does not require any special knowledge, as easily understand by employees with different levels of education and IQ.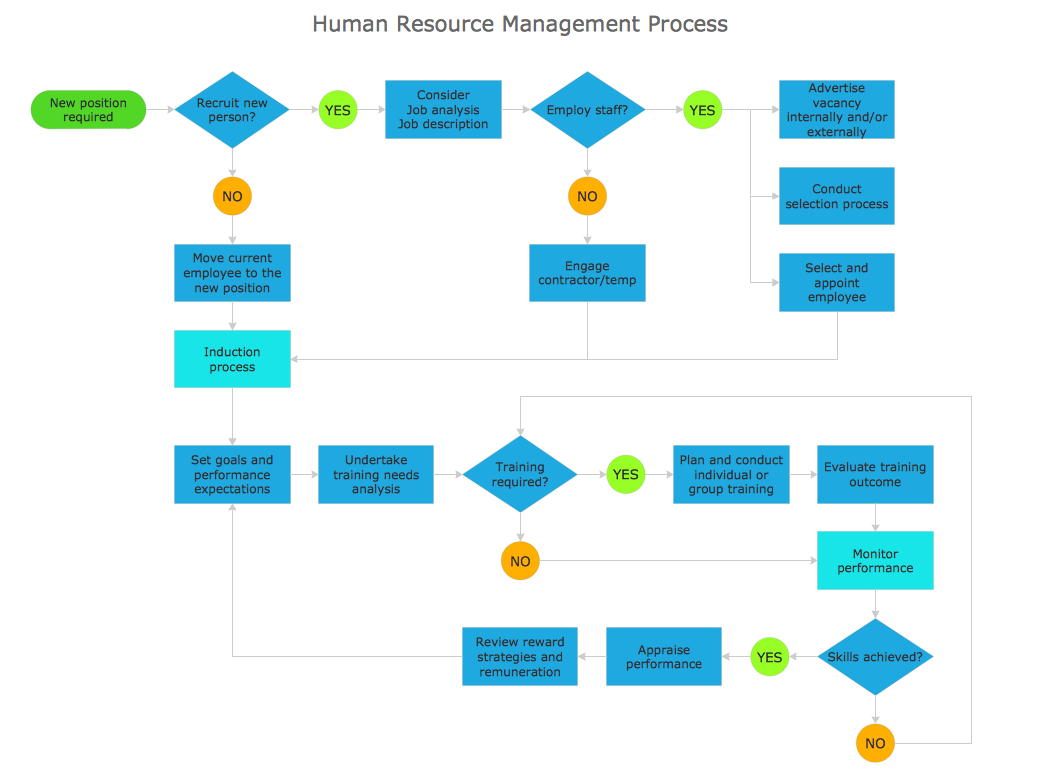
Picture: Types of Flowchart: Comprehensive Overview
Related Solution:
For depicting the onion model are actively used Stakeholder Onion Diagrams. The ConceptDraw DIAGRAM diagramming and vector drawing software extended with Stakeholder Onion Diagrams Solution from the Management Area of ConceptDraw Solution Park offers the number of useful tools and Stakeholder Onion Diagram template for their easy design.
Picture: Stakeholder Onion Diagram Template
Related Solution:
Network Security Architecture Diagram visually reflects the network's structure and construction, and all actions undertaken for ensuring the network security which can be executed with help of software resources and hardware devices. You dream to find powerful software for easy designing Network Security Architecture Diagram? We recommend to use ConceptDraw DIAGRAM extended with Network Security Diagrams Solution from the Computer and Networks Area of ConceptDraw Solution Park.
Picture: Network Security Architecture Diagram
Related Solution:
A flowchart is a simple but very functional tool when it comes to understanding a workflow or to removing unnecessary stages from a process. When drawing flowcharts, keep in mind that there are four common types of flowcharts, like document flowcharts and data flowcharts that show control over a data or document flow over a system. To show controls on a physical level, use system flowcharts. In addition, to show controls in a program, you can draw a program flowchart.
This flowchart diagram represents the piece of an article editing process, that involves the author and editor. It was created using the Basic Flowchart notation that consists from the basic flowchart symbols. The start and the end of the process are indicated with "Terminator" symbols. The "Process" symbols show the action steps consisting from making edits and searching for a compromise, when the author does not agree with the suggestions of the editor. The "Process" symbol is the general symbol in process flowcharts. The "Decision" symbol indicates a branching in the process flow. There are two branches indicated by a Decision shape in the current flowchart (Yes/No, Disagree/Agree). This basic flowchart can be used as a repeating unit in the workflow diagram describing the working process of some editorial office.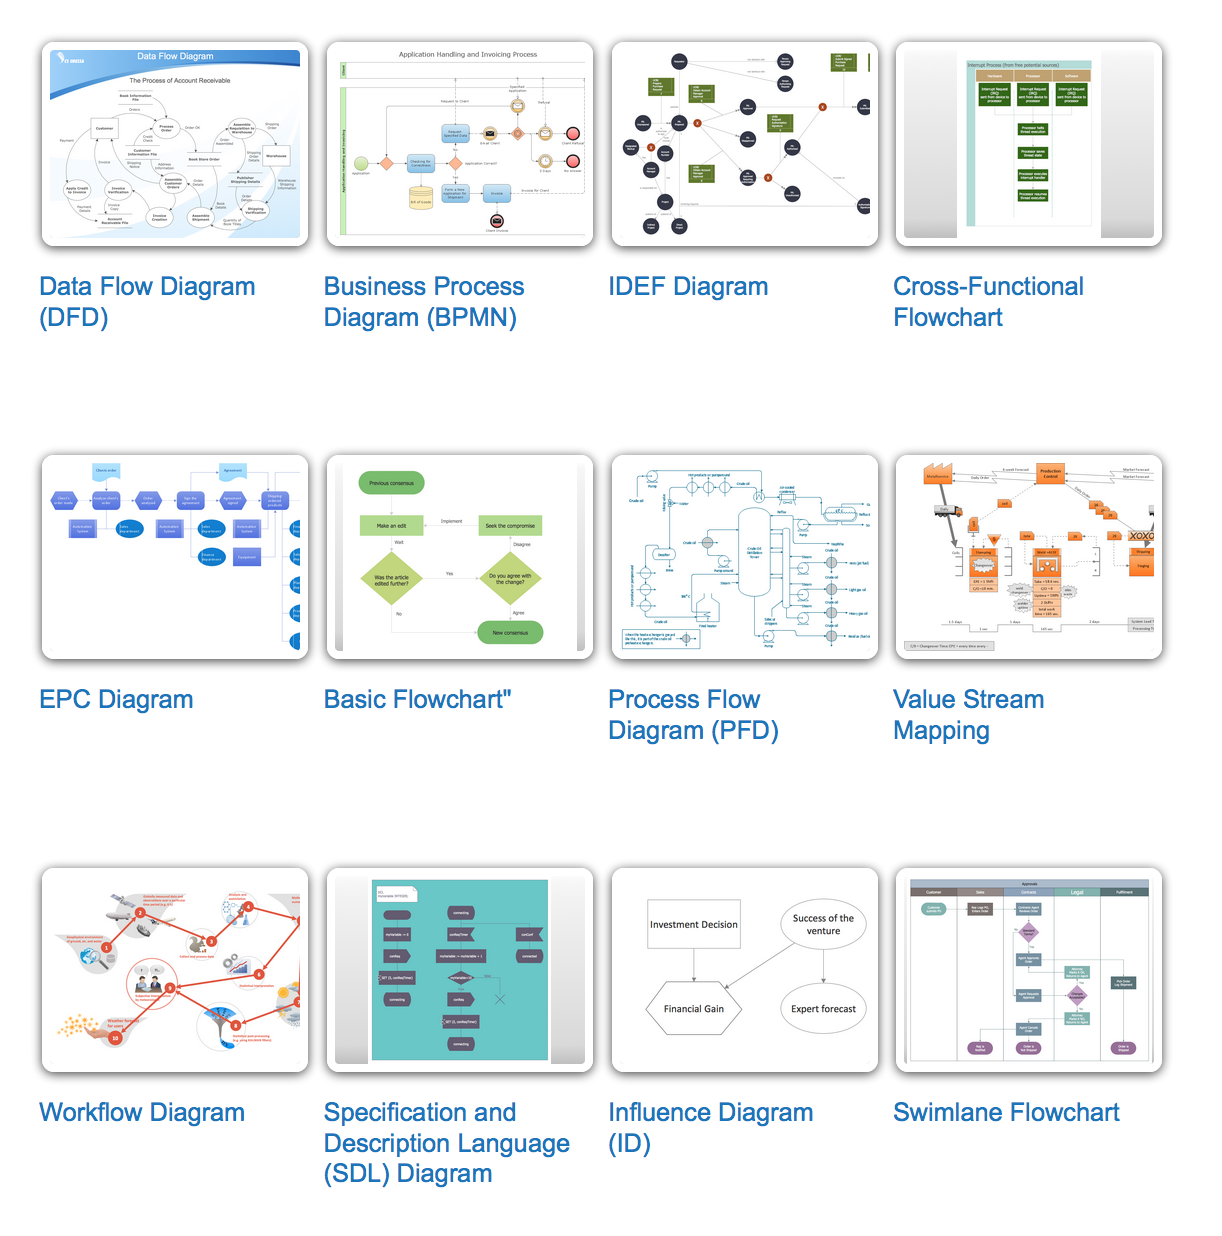
Picture: Types of Flowcharts
Related Solution:
There are numerous articles about the advantages of flowcharting, creating business graphics and developing different charts. Nevertheless, these articles are almost useless without the main component - the examples of flowcharts, org charts and without a fine example, it is difficult to get all the conveniences of creating diagrams. You can find tons of templates and vivid examples on Solution Park.
This illustration shows a variety of business diagrams that can be created using ConceptDraw DIAGRAM. It comprises a different fields of business activities: management, marketing, networking, software and database development along with design of infographics and business illustrations. ConceptDraw DIAGRAM provides a huge set of sample drawings including business process modeling diagrams,, network diagrams, UML diagrams, orgcharts, DFD, flowcharts, ERD, geographical maps and more.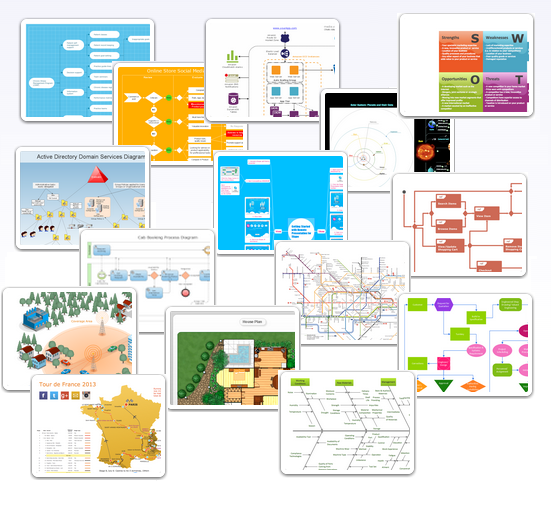
Picture: Examples of Flowcharts, Org Charts and More
Related Solution:
These libraries of vector objects depict the Site Accessories and Parking and Roads elements. They are needed to draw architectural and landscape plans that show the architectural elements around buildings: parking spaces, hiking and biking trails, drainage systems, lights, and vehicle access control elements. These libraries are included into ConcepDraw solution for Site Planning. Site Accessories and Parking, Roads libraries contain near 40 vector images that will help depict an a surrounding territory at building plans.
These libraries of vector objects depict the Site Accessories and Parking and Roads elements. They are needed to draw architectural and landscape plans that show the architectural elements around buildings: parking spaces, hiking and biking trails, drainage systems, lights, and vehicle access control elements. These libraries are included into ConcepDraw solution for Site Planning. Site Accessories and Parking, Roads libraries contain near 40 vector images that will help depict an a surrounding territory at building plans.
Picture: Building Drawing. Design Element Site Plan
Related Solution:
When studying computer science, it is important to have good training manuals. To understand how the networks and data links work, you will probably need a set of network diagram examples depicting all the possible interconnections between network devices. You can find them on Internet or try to create your own.
This example of a network topology diagram was made using ConceptDraw Computer and Network Diagrams solution. It represents a bus topology network diagram. A bus topology means that computers and peripherals in the network are connected to a mutual cable (backbone). This topology is often used for small networks. This diagram was designed using vector libraries of network equipment symbols. They also can be applied while creating various LAN and WAN diagrams.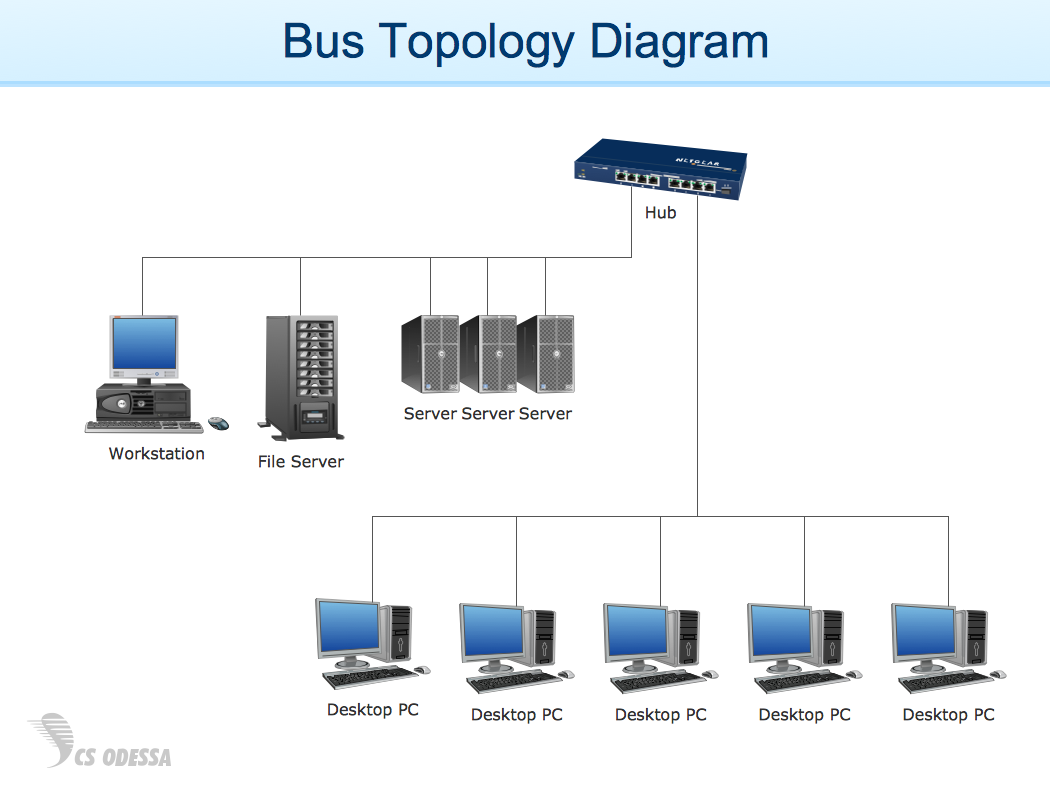
Picture: Network Diagram Examples
It can be tough to get straight into business papers and processes.Otherwise, you can learn how to create flowcharts for an accounting information system and visualize these documents. Accounting diagrams are clear and easy to understand for all the participants of the process.
There are symbols used for creating accounting flowcharts using ConceptDraw DIAGRAM and its Accounting Flowcharts solution. Accounting flow charts are a special kind of flow charts. Actually a variety of flowcharts are often used to facilitate many aspects of a workflow of accounting department. Accounting flowcharts are utilized to support creating accounting documentation, to depict positions responsible for fulfillment of each phase of accounting workflow.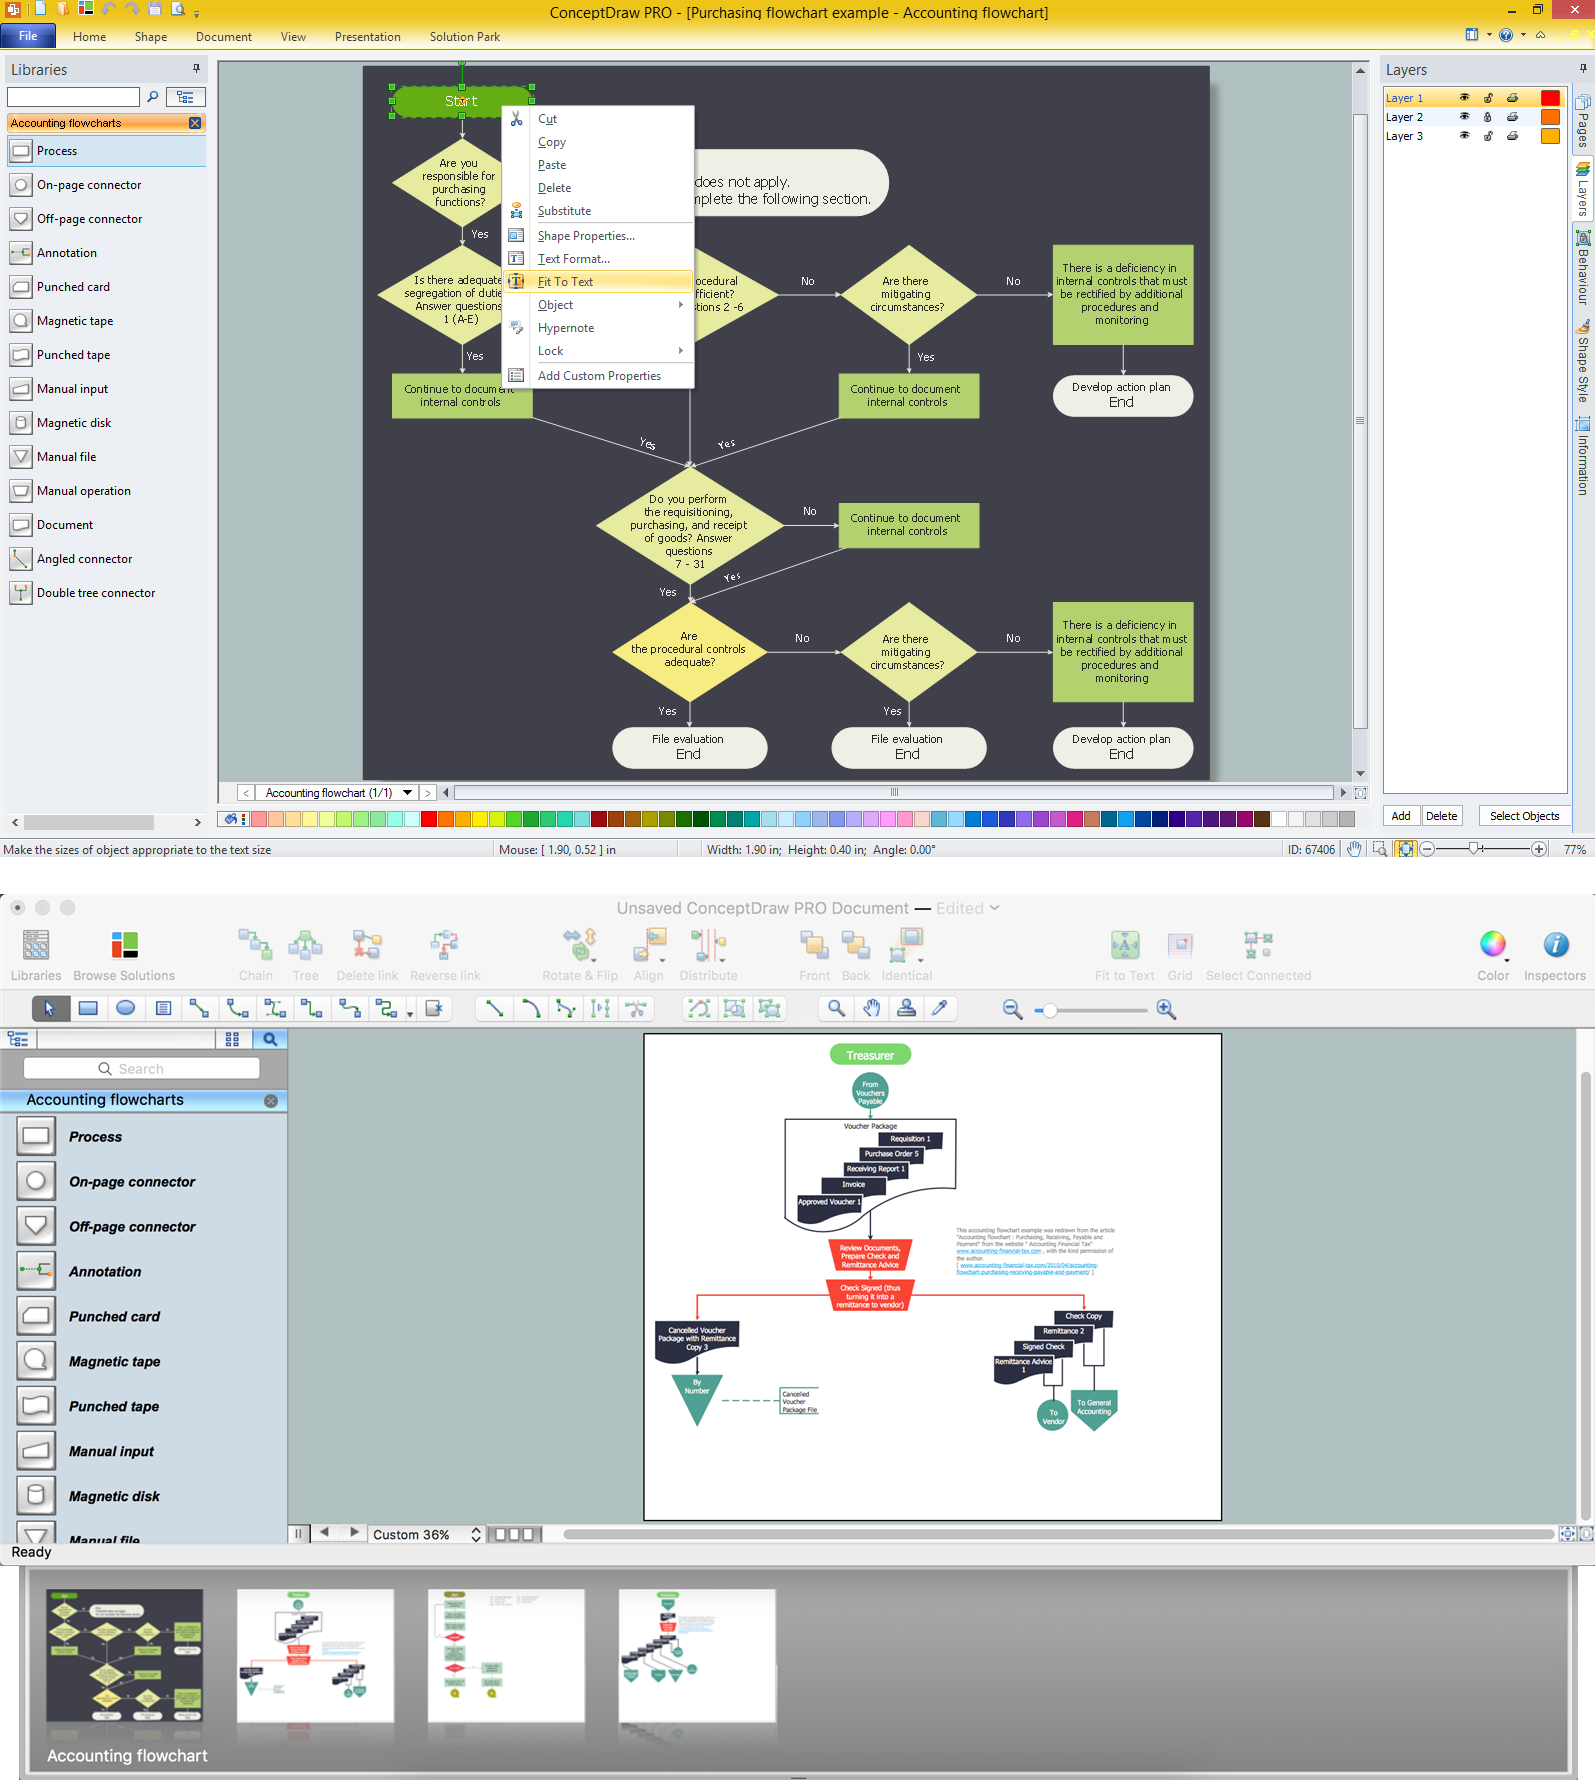
Picture:
How to Create Flowcharts for an
Accounting Information System
Related Solution:

