Made with
ConceptDraw
DIAGRAM 18

Business Processes description with ConceptDraw DIAGRAM

In the given article we will consider “business-process” and “business-processes reengineering” concepts and how the work with business-processes is realized in ConceptDraw.

The activity of a company of any size consists of the big amount of business-processes which repeat from day to day. This could be a transportation of the load or the new software development, sorting of the correspondence or the creation of the air liner. So any action happened inside the company, which has definite conditions at the input, the result at the output, resources and control mechanism is the business-process. At bottom of fact, business-process is any action, directed to the final receipt of the direct or indirect profit.

Let’s make some formal definitions.

Business-process is:

  • A consequence of actions directed to the transformation of data material flows having the aim to increase their value for a client or the process of creation of the added product cost or services, which satisfy client needs.
  • A quantity of inner correlated steps (functions) which start from one or more inputs and finish with the creation of output (product or service), necessary to a client.
  • A process of transformation of inputs into sets of outputs;
  • A totality of consequent actions for solving of any enterprise task.
  • Business-process is an operation, included into the system of operations, the aim of which is production and delivery of services/goods to operations which enter into the system and to other systems as well.
  • Any process can be optimized and the experience of a great number of companies shows that sometimes it is possible to spend several hours on the process which earlier took several weeks. At this the diminution of the time spent on the produce of goods or service does not influence on the quality of the final result! In our century of the strict competition and market overloaded with services and goods the possibility to accelerate and reduce the price of the final product or a service is of great importance. One of the main reasons of economical progress of Japanese corporations is exactly the thoroughly considered and executed strategy of business-processes optimization.

    The process of business-processes optimizations is called reengineering. At that the matter concerns not small change but radical redesign of the existing business-processes.

    But to redesign existing business-processes it is necessary to clearly conceive the current state of business-processes «as is». For description of business-processes several methods are developed.

    The simplest variant of business-processes description is the usage of ordinary block-schemes. This way could be realized with the help of ConceptDraw as there are special libraries of objects and templates for creation of block-schemes. However, this method does not give a visual and convenient result for business-processes optimization. Therefore for description of business processes we recommend you to use more complex but more efficient methods.

    Methodology of the structural analysis and projection (SA/SD). At the heart of it there lies a methodology of the structural projection of software and information systems. SADT methodology is the continuation of SA/SD method.

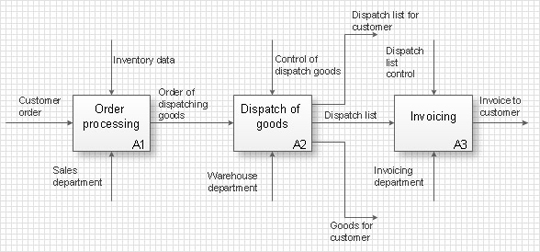
    The most worked out and commonly used methodology of business-processes description is IDEF methodology. Besides business-processes it allows to describe functional blocks, for example production and marketing. ConceptDraw lets creation of business processes description using IDEF0 and IDEF2 methods.

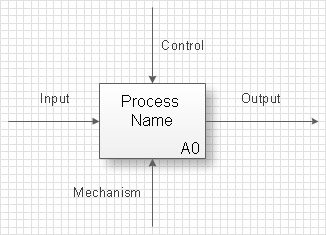
    Accordingly to IDEF method, business-process is described by following way- this is a rectangle (Activity Box) which defines directly the performed action and four arrows which denote the “input”, “output”, “mechanism” (or resources which are used in the process) and “management”
    (or the control of the process)

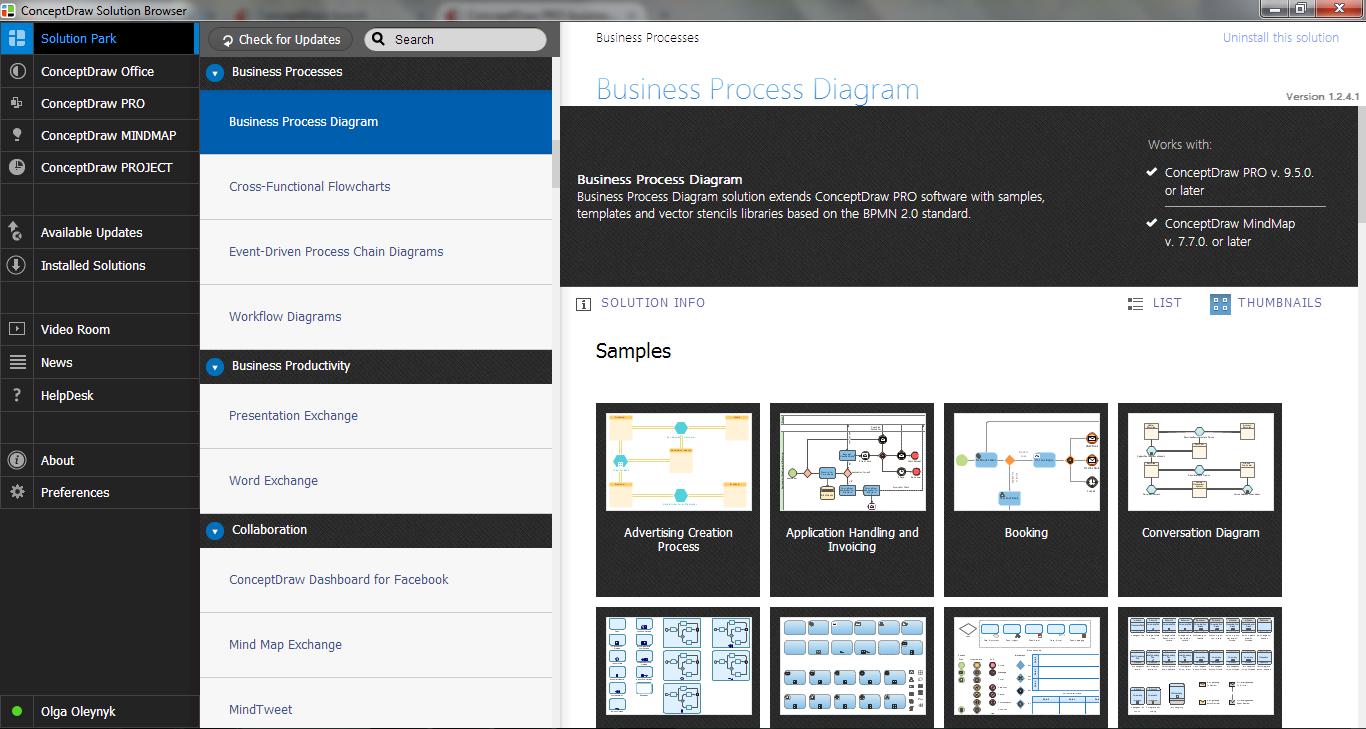
    To create the business-process description in ConceptDraw it is enough to open Business Processes section in ConceptDraw STORE and select a method. Besides IDEF methodology ConceptDraw allows usage of diagrams of business-processes modeling (BPML - Business Process Modeling Diagram), diagrams of quality control (TQM Diagram - Total Quality Management Diagram) and symbols of values flows.

    Business Process Diagram Solution in ConceptDraw STORE

    After this a scheme or a diagram, is created as simple as any other ConceptDraw diagram- with the help of Drag&Drop mechanism you arrange necessary libraries’ objects on a page of your document and connect them among each other with connectors.

    Thus, all the activity of a company can be described as the totality of many small business processes, which can be optimized by the way of reengineering for getting new most effective business processes. The obtained optimized description is called “normative” or “to be” and is realized with the help of the same method with the help of which the description “as is” was created.

    Business Processes description with ConceptDraw DIAGRAM  *


    TEN RELATED HOW TO's:
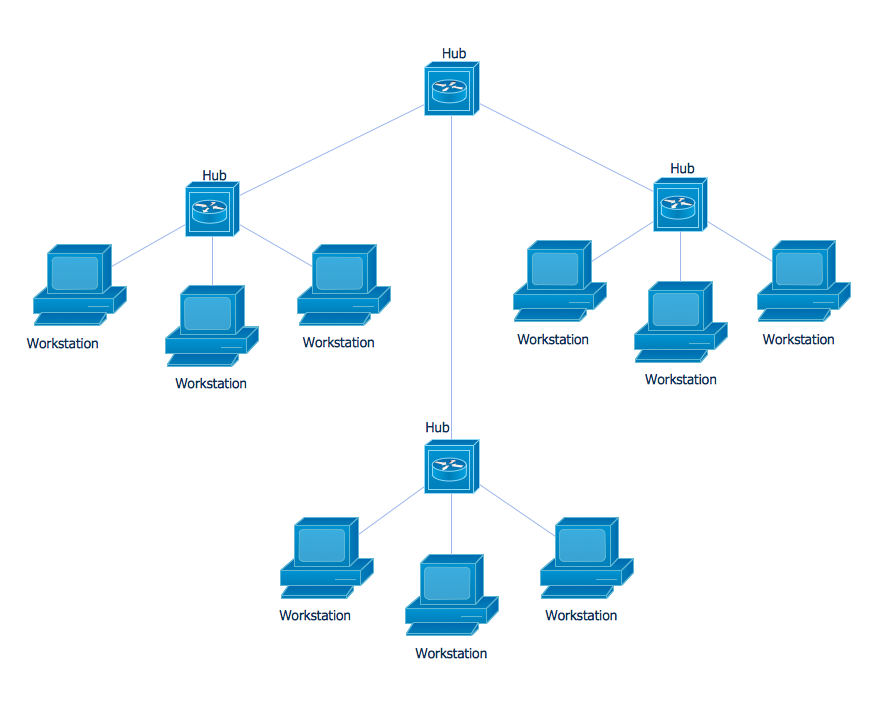
    Nodes of any computer network are somehow organized in a hierarchy or a layout. Some of the common layouts like star network topology are more reliable and some like ring topology withstand high loads better. It is also important to distinguish logical topologies from physical. This diagram represents a typical view of the star network topology. The star network topology is one of the most frequently used network topologies in the majority of office and home networks. It is very popular because of its low cost and the easy maintenance. The plus of the star network topology is that if one computer on the local network is downed, this means that only the failed computer can not send or receive data. The other part of the network works normally. The minus of using star network topology is that all computers are connected to a single point-switch, or hub. Thus, if this equipment goes down, the whole local network comes down.Star Network Topology *
    Picture: Star Network Topology
    Related Solution:
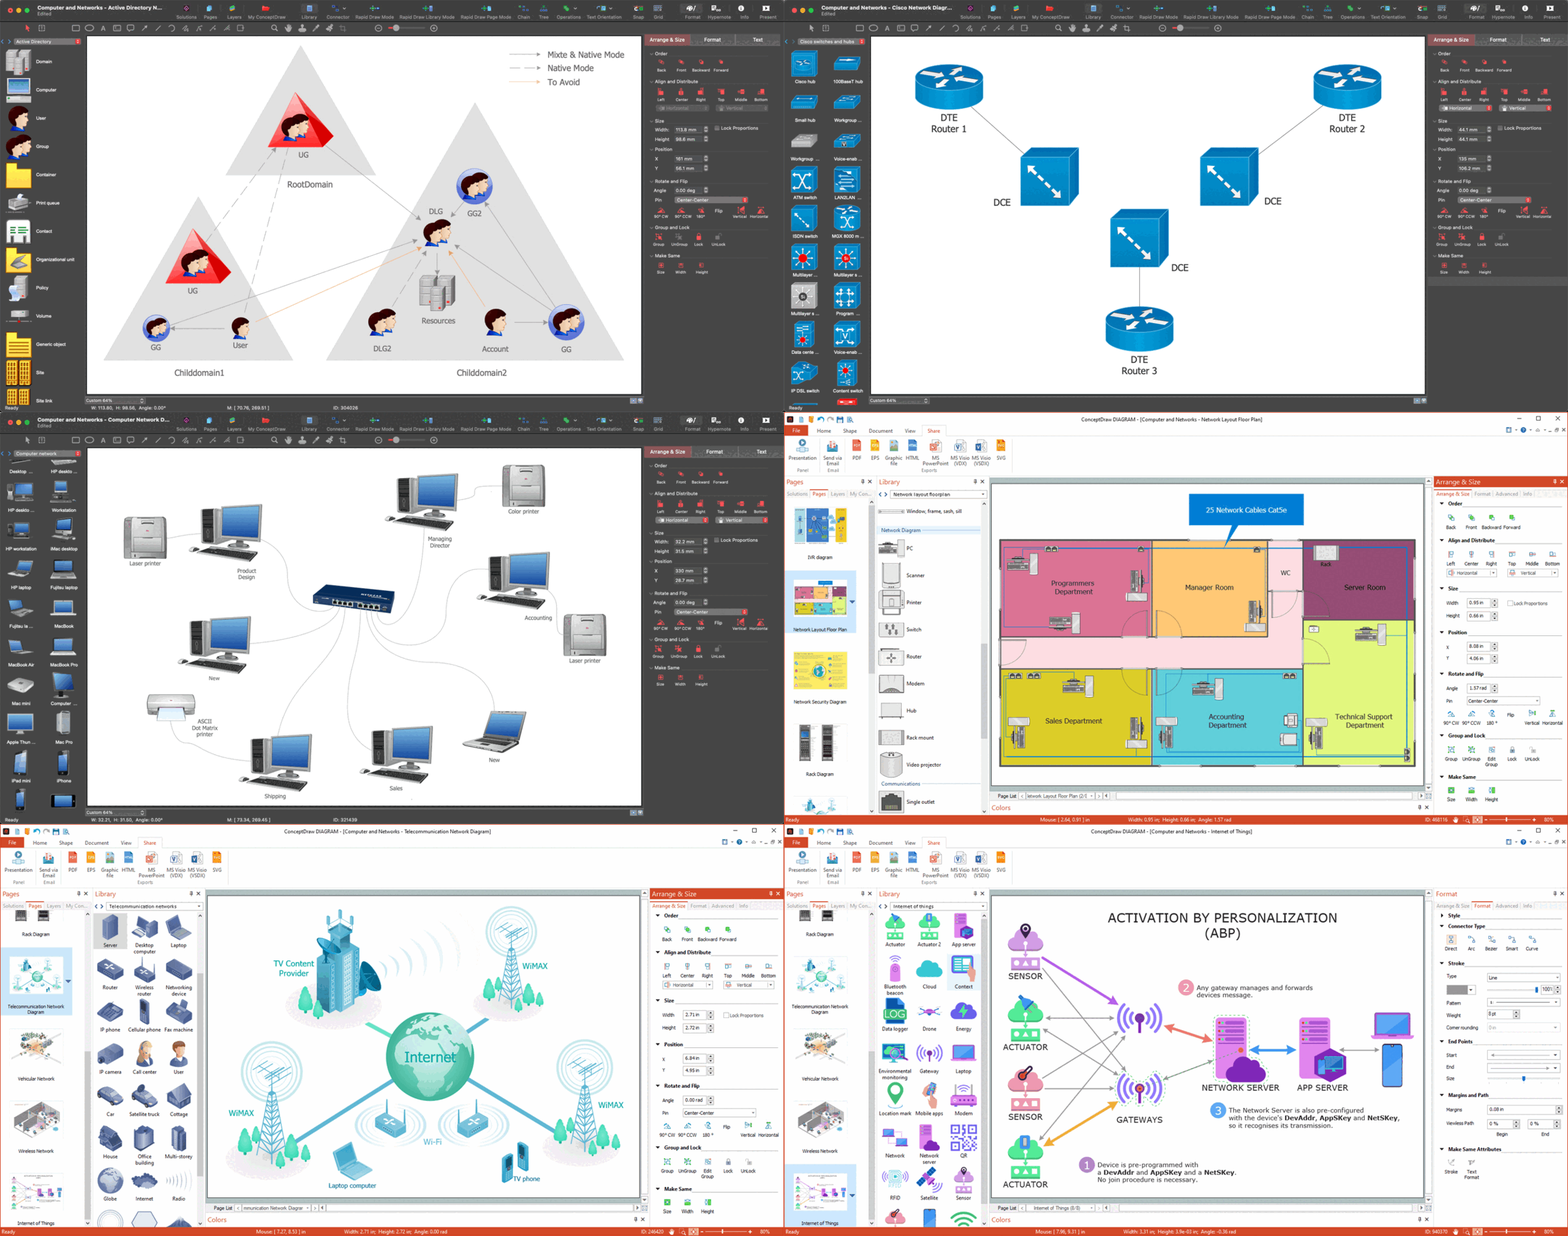
    Why do you need network visualizations? 🔸 Unlock the full potential of network visualization with our in-depth guide on using the ConceptDraw Network Visualization Tool. ✔️ Explore features, tips, and best practices to create stunning visual representations of your network architectureNetwork Visualization with ConceptDraw DIAGRAM
    Picture:
    Network Visualization Guide.
    How to Use ConceptDraw Network Visualization Tool
    Related Solutions:
    Charting Software allows you to create diagrams, charts, graphs, flowcharts, and other business graphics. ConceptDraw DIAGRAM include simple shape drawing tools, examples, templates, and symbol libraries.Create Graphs and Charts *
    Picture: Create Graphs and Charts
    Related Solution:
    Lean Six Sigma (LSS) is a well-known in all over the world methodology of quality improvement and business perfection. ConceptDraw DIAGRAM diagramming and vector drawing software is a powerful Lean Six Sigma Diagram Software thanks to the included Value Stream Mapping solution from the Quality Management Area of ConceptDraw Solution Park.Lean Six Sigma Diagram Software *
    Picture: Lean Six Sigma Diagram Software
    Related Solution:
    For protection various cyber environments are developed and applied large variety of cyber security standards, techniques, security concepts and approaches with different cyber security degrees. The ConceptDraw DIAGRAM diagramming and vector drawing software extended with Network Security Diagrams Solution from the Computer and Networks Area of ConceptDraw Solution Park offers the number of useful tools which will help network security engineers, cyber security specialists, network and computer analysts easily and visually depict the knowledge and skills for research and prevention of intrusions, about protection critical information and analysis of cyber incidents, and for how to assess threats and vulnerabilities.Cyber Security Degrees *
    Picture: Cyber Security Degrees
    Related Solution:
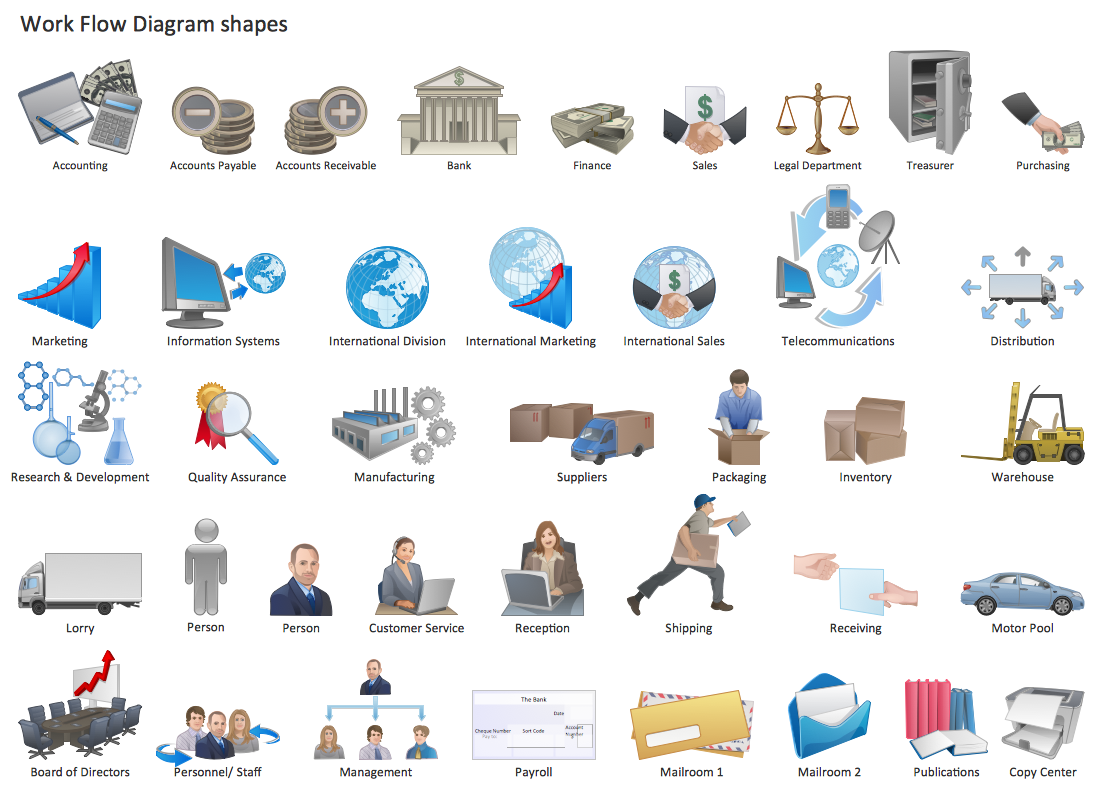
    ConceptDraw DIAGRAM extended with Workflow Diagrams solution from the Business Processes area is a powerful workflow software which can help design the workflow diagrams of any complexity, from simple work flow one to sufficiently complex workflow charts.Work Flow One *
    Picture: Work Flow One
    Related Solution:
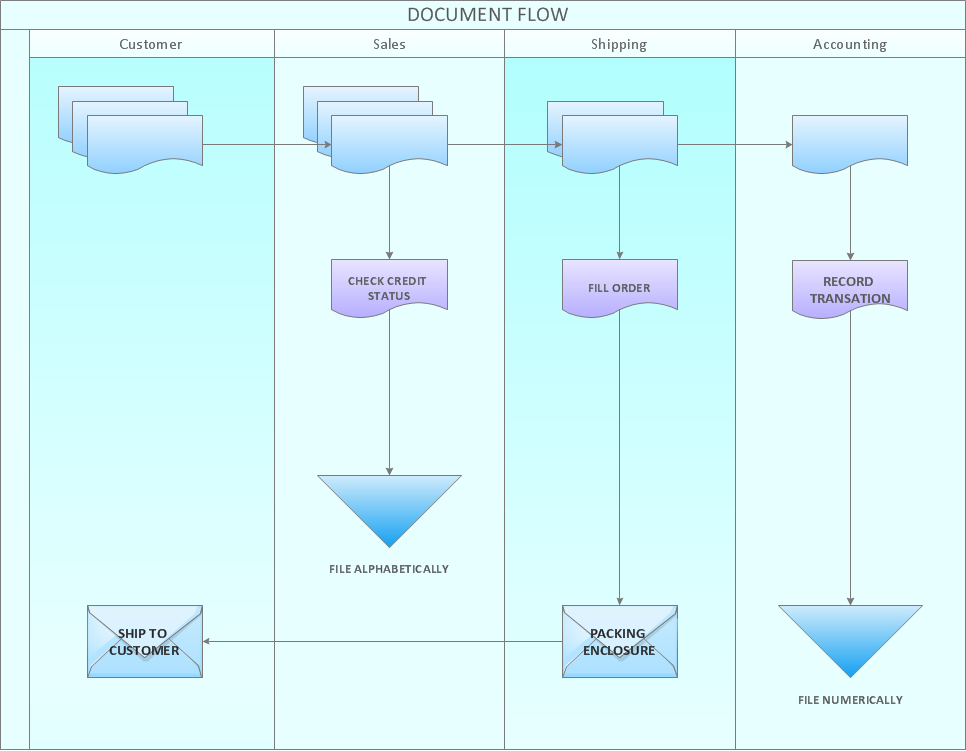
    Use the set of special professionally developed swim lane flowchart symbols - single, multiple, vertical and horizontal lanes from the Swimlanes and Swimlanes BPMN 1.2 libraries from the Business Process Diagram solution, the Swim Lanes library from the Business Process Mapping solution as the perfect basis for your Swim Lane Flowcharts of processes, algorithms and procedures.Swim Lane Flowchart Symbols *
    Picture: Swim Lane Flowchart Symbols
    Related Solution:
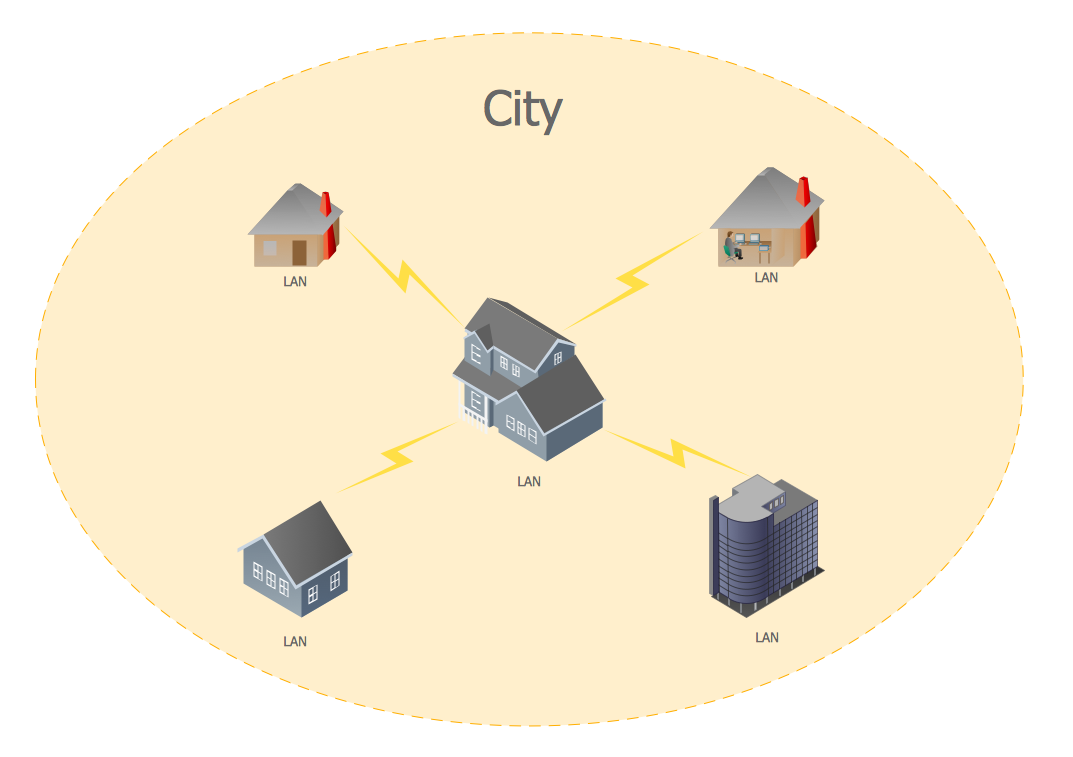
    A list of parameters on which networks differ is very long. A large network with a range up to 50 kilometers is called metropolitan area network (MAN), and this type of network can include several local area networks. Metropolitan networks in their turn connect into global area networks. Here you will see a Metropolitan Area Network (MAN). This is an extensive network which occupies a large territory including a few buildings or even the whole city. The space of the MAN is bigger than LAN, but lower than WAN. MAN comprise a lot of communication equipment and delivers the Internet connection to the LANs in the city area. Computer and Networks solution for ConceptDraw DIAGRAM provides a set of libraries with ready-to-use vector objects to design various kinds of computer networks.Metropolitan area networks (MAN). Computer and Network Examples
    Picture: Metropolitan area networks (MAN). Computer and Network Examples
    Related Solution:
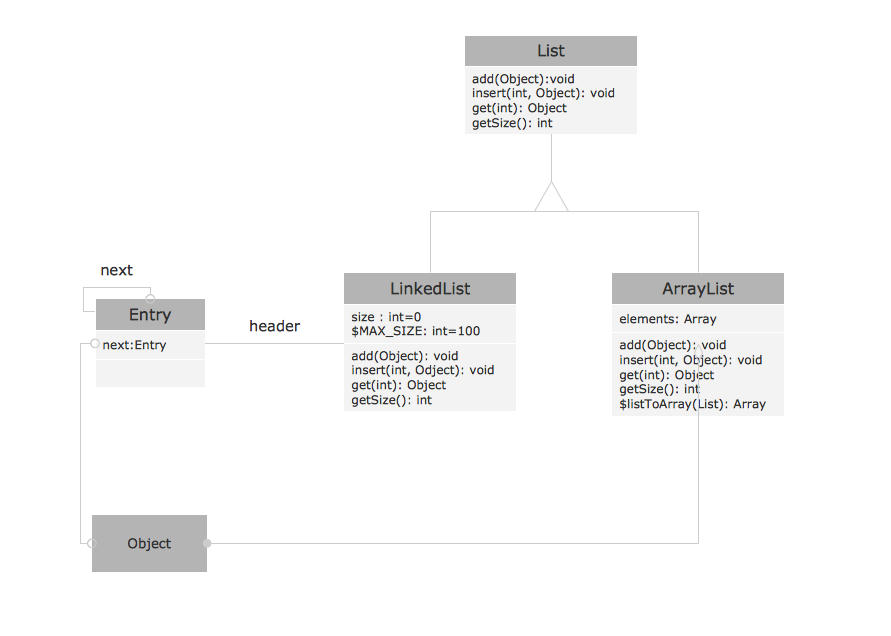
    This sample shows the OMT method. It was created in ConceptDraw DIAGRAM diagramming and vector drawing software using the Rapid UML Solution from the Software Development area of ConceptDraw Solution Park. All diagrams produced with ConceptDraw DIAGRAM are vector graphic documents and are available for reviewing, modifying, and converting to a variety of formats (image, HTML, PDF file, MS PowerPoint Presentation, Adobe Flash or MS Visio XML).OMT Method *
    Picture: OMT Method
    Related Solution:
    ConceptDraw the easy flowchart software that gives users the ability to draw any type of flowcharts. Fast visualization of the structured data with the vector stencils from object libraries by using RapidDraw technology.Easy Flowchart Software
    Picture: Easy Flowchart Software
    Related Solution:
    ConceptDraw
    DIAGRAM 18