Cause and Effect Analysis - Fishbone Diagrams for Problem Solving
Fishbone diagram is a powerful tool used for solving business problems and obstacles. The solving process usually requires the realization of the following steps:
- define a problem;
- identify the problem's root;
- find as many solutions for a given problem;
- evaluate your solutions, identify the best and apply it;
- appreciate the effectiveness of the taken solution.
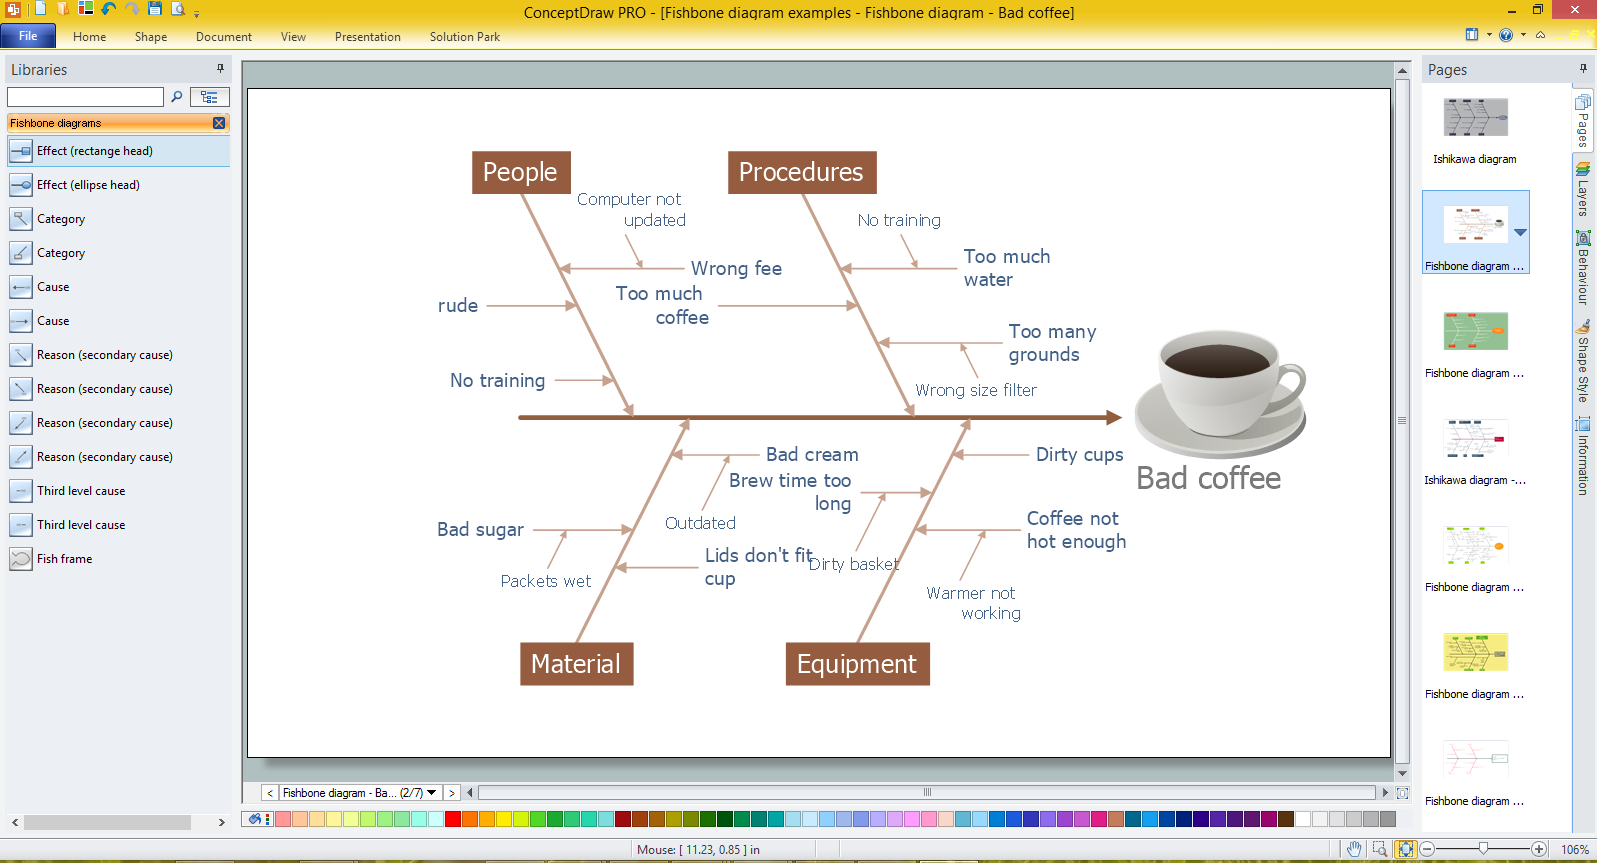
ConceptDraw DIAGRAM software extended with Fishbone Diagrams solution from the Management area of ConceptDraw Solution Park is a helpful tool for cause and effect analysis. It gives the ability to easy identify many possible causes and factors which cause the effects and to draw Fishbone Diagrams for problem solving.

Example 1. Cause and Effect Analysis - Fishbone Diagrams for Problem Solving
Fishbone Diagrams Solution offers the Fishbone Diagrams library with a lot of predesigned vector objects indispensable to solve problems using the Cause and Effect Fishbone diagram.
This solution includes also variety of predesigned templates and samples, any of them can be used as a perfect base for cause and effect analysis. All this collection is available at ConceptDraw STORE.

Example 2. Fishbone Diagram - Templates and Samples
All samples and templates offered by Fishbone Diagrams Solution are professional looking, colorful and attractive, they are available for changing and further successful using as is or at the changed and supplemented view.

Example 3. Fishbone Diagram for Problem Solving in ConceptDraw DIAGRAM /p>
The samples you see on this page were created in ConceptDraw DIAGRAM using the tools of the Fishbone Diagrams Solution. An experienced user spent 10 minutes creating each of these samples.
Use the Fishbone Diagrams Solution for ConceptDraw DIAGRAM Solution Park for effective cause and effect analysis and for drawing your own Fishbone Diagrams for problem solving.
All source documents are vector graphic documents. They are available for reviewing, modifying, or converting to a variety of formats (PDF file, MS PowerPoint, MS Visio, and many other graphic formats) from the ConceptDraw STORE. The Fishbone Diagrams Solution is available for all ConceptDraw DIAGRAM or later users.
TEN RELATED HOW TO's:
Interactive tool helps you find the appropriate response to social media mentions quickly.
Picture: How to Use the ″Online Store PR Campaign″ Sample
Related Solution:
Event-Driven Process Chain Diagrams for improvement throughout an organisation.
ConceptDraw DIAGRAM - business process mapping software that reduces the time needed to create a business process model.
Picture: Process Modelling using Event-driven Process chain
Related Solution:
This sample was created in ConceptDraw DIAGRAM diagramming and vector drawing software using the UML Class Diagram library of the Rapid UML Solution from the Software Development area of ConceptDraw Solution Park.
This sample describes the use of the classes, the generalization associations between them, the multiplicity of associations and constraints. Provided UML diagram is one of the examples set that are part of Rapid UML solution.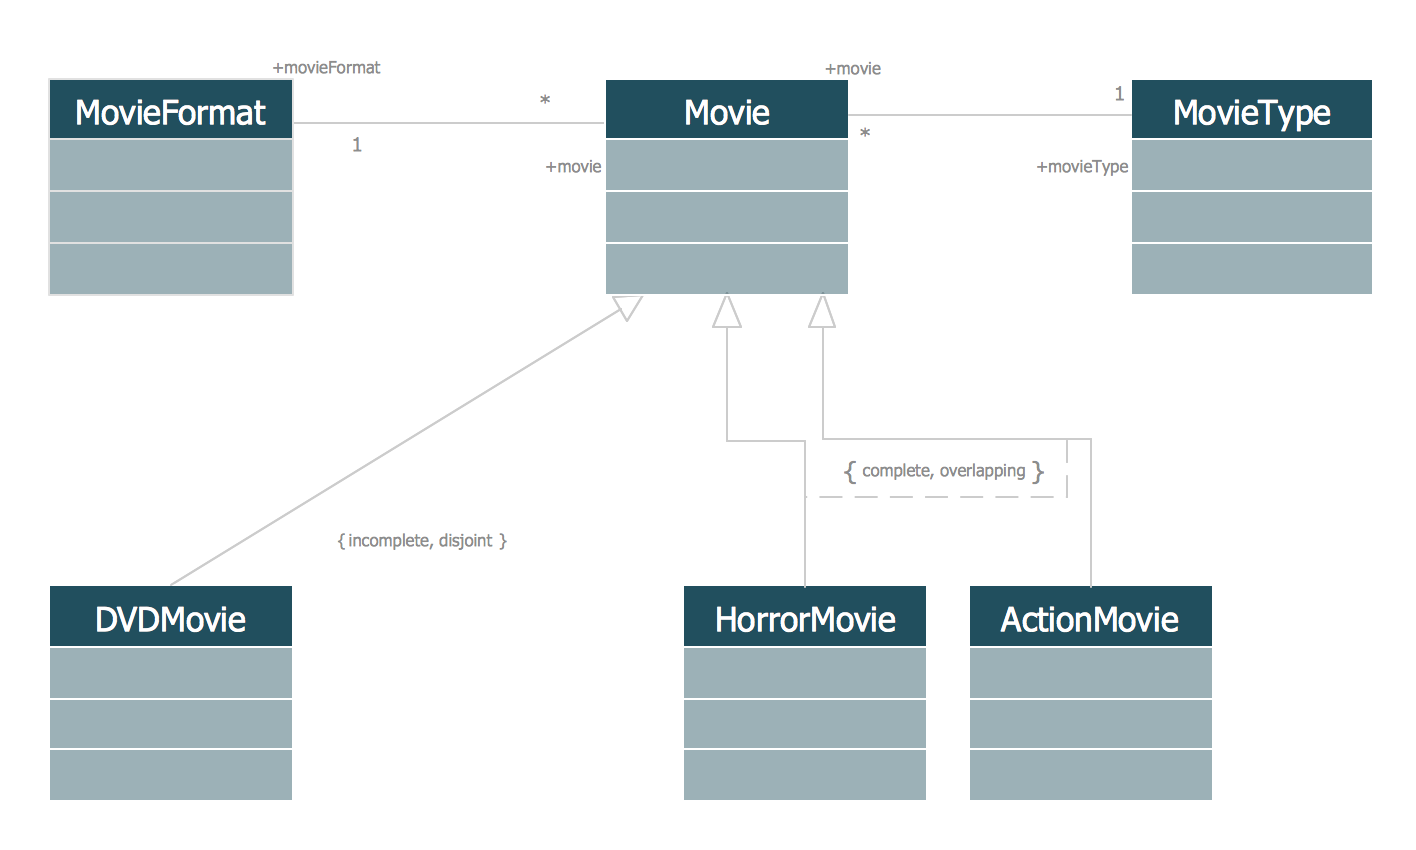
Picture: UML Class Diagram Generalization ExampleUML Diagrams
Related Solution:
ConceptDraw DIAGRAM is a powerful drawing tool that changes the way diagrams are produced.
Diagrama de Topologia or Topology Diagram helps you see the big picture as you develop a service.
Picture: Diagrama de Topologia
Related Solution:
The Value Stream Map is one of the key tools of lean practitioners. It helps aptly describe the manufacturing processes both complex and simple. It supports process improvement, allows identifying waste, and reducing process cycle times. Use ConceptDraw DIAGRAM extended with Value Stream Mapping solution to document processes starting with a professionally designed Value Stream Mapping template.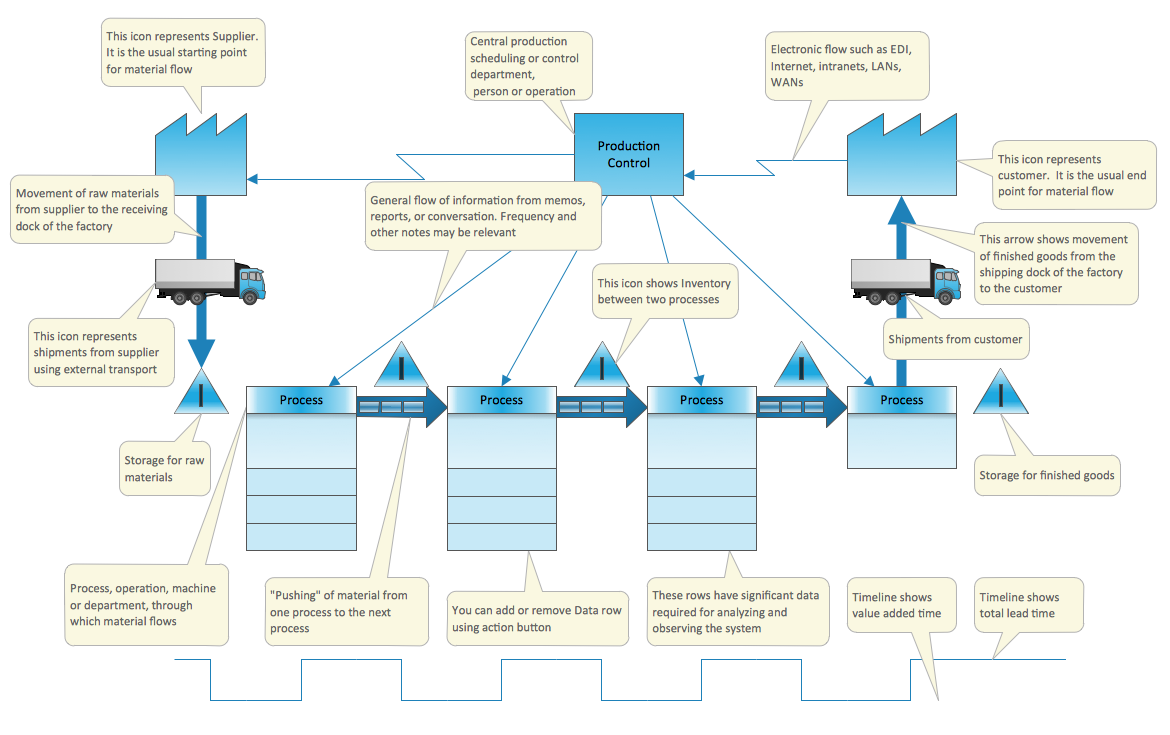
Picture: Value Stream Mapping Template
Related Solution:
ConceptDraw DIAGRAM is a Mac OS X and Windows software. Numerous vector stencils, samples and templates created by designers are included in the basic package. This is classic flowchart maker which exactly follows the industry standards using flowchart symbols geathered during a ten years into solution park.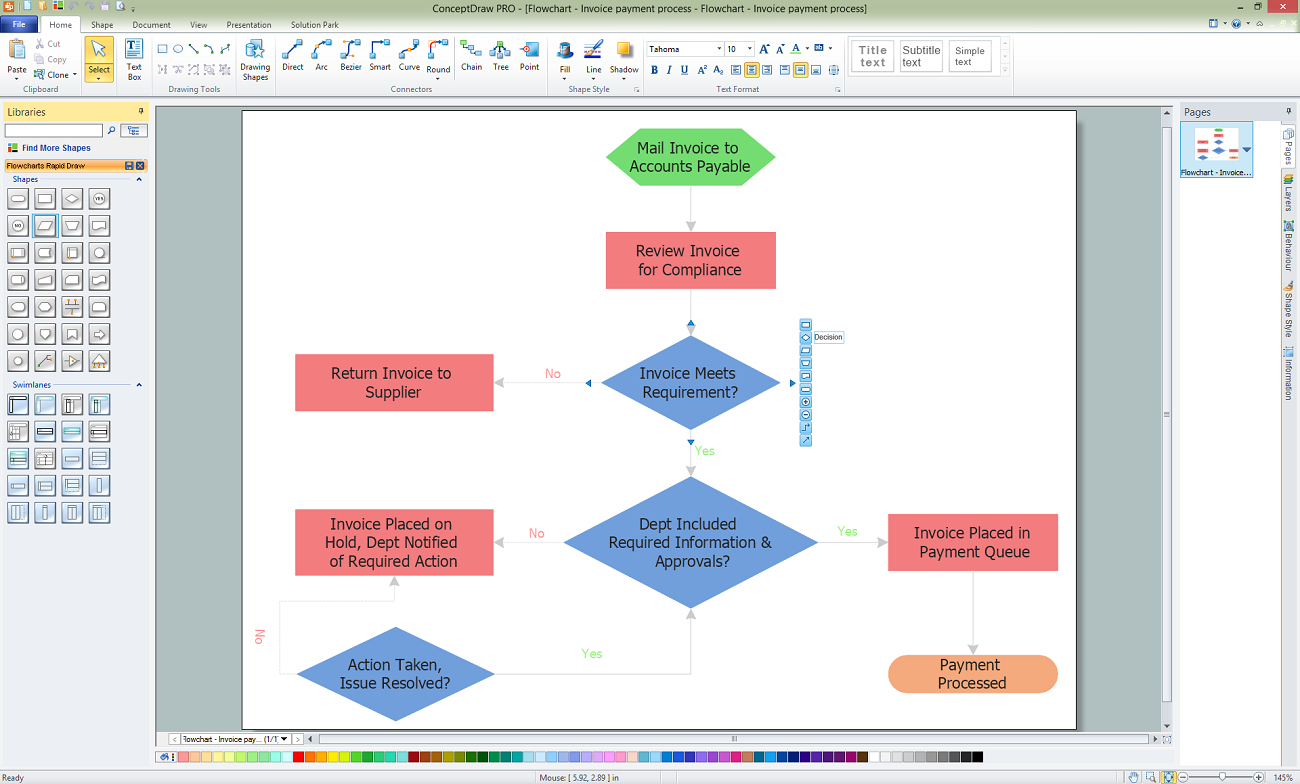
Picture: Flowchart Software
Related Solution:
Business graphic applications show a special knowledge representations and include many features for creating schematic pictures. These graphic tools are known as flowchart maker or flowchart maker software.
Picture: Flowchart Maker
Related Solution:
ConceptDraw DIAGRAM is new software for business and technical drawing. Powerful business drawing tools, extensive libraries with pre-drawn shapes, free samples of business drawings, technical drawings and flowcharts, support of many graphic formats enable users to visually develop their business drawings charts and diagrams in any combination of drawings, diagrams and flow charts.
Picture: ConceptDraw DIAGRAM The best Business Drawing Software
Related Solution:
PERT Chart Software - Activity Network and Project Evaluation and Review Technique, or PERT, charts are a way of documenting and analyzing the tasks in a project.
ConceptDraw DIAGRAM is a powerful diagramming and vector drawing software for designing professional looking PERT Charts quick and easy.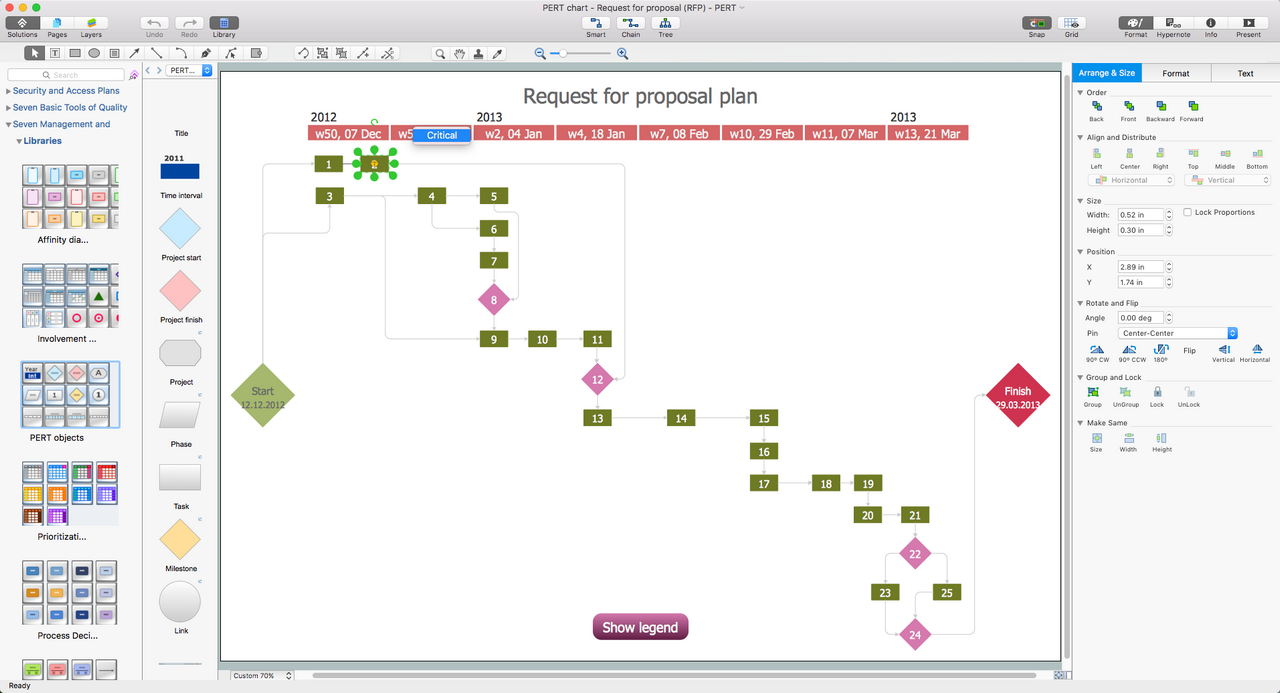
Picture: PERT Chart Software
Related Solution:
ConceptDraw Wireless Network solution includes 81 of professional-looking stencils and several samples that you can modify and make your own diagram.
Picture: How to Create Network Diagrams
Related Solution: