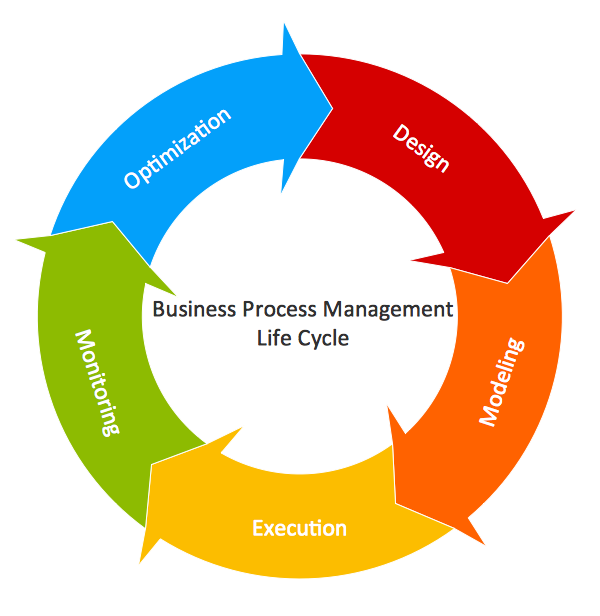
Example 1. Circular Arrow Diagram - BPM Life Cycle
Business Diagrams Solution offers the Circular Arrows Diagrams library with ready-to-use predesigned circular arrow shapes to make your Circular Arrow Diagrams creating fast and easy.

Example 2. Business Diagrams Solution in ConceptDraw STORE
Another way of drawing any circular arrow diagram in ConceptDraw DIAGRAM is to use as the base the predesigned template or sample from the ConceptDraw STORE. The whole collection of templates and samples is available from ConceptDraw STORE.

Example 3. Circular Arrow Diagram - PDCA Cycle
The samples you see on this page were created in ConceptDraw DIAGRAM using the Business Diagrams Solution for ConceptDraw DIAGRAM. These Circular Arrow Diagrams successfully demonstrate solution's capabilities and professional results you can achieve. An experienced user spent 5-10 minutes creating every of these samples.
Use the Business Diagrams Solution for ConceptDraw DIAGRAM software to create your own professional looking Circular Arrow Diagrams of any complexity quick, easy and effective.
All source documents are vector graphic documents. They are available for reviewing, modifying, or converting to a variety of formats (PDF file, MS PowerPoint, MS Visio, and many other graphic formats) from the ConceptDraw STORE. The Business Diagrams Solution is available for all ConceptDraw DIAGRAM or later users.
TEN RELATED HOW TO's:
This sample shows the Flowchart that displays the process of the achievement the consensus, in other words solving for the acceptable solution.
This Flowchart has start point. The rectangles on it represent the steps of the process and are connected with arrows that show the sequence of the actions. The diamonds with yes/no shows the decisions. The Flowcharts are widely used in marketing, business, analytics, government, politics, engineering, architecture, science, manufacturing, administration, etc.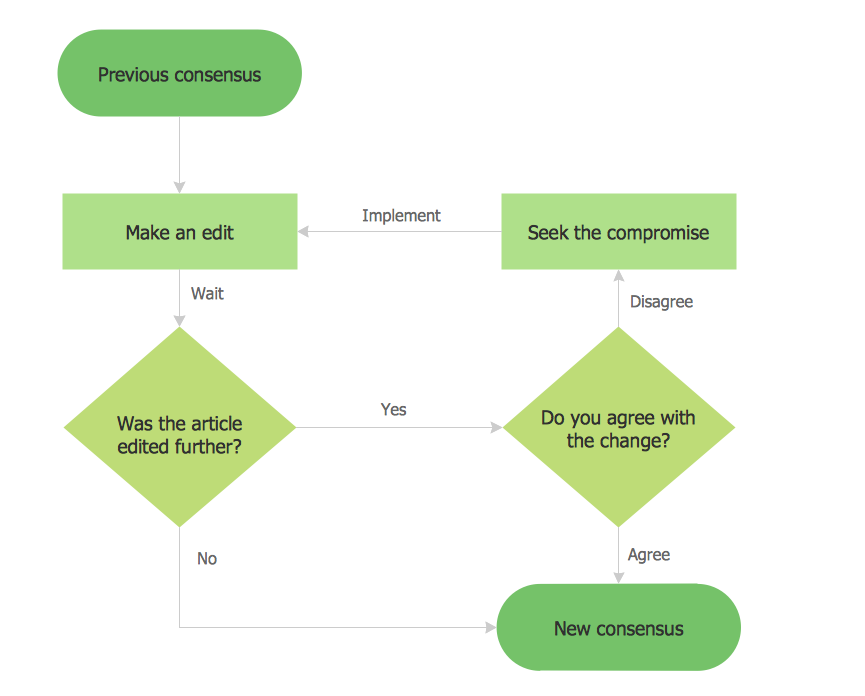
Picture: Example Basic Flowchart. Flowchart Examples
Related Solution:
The Flowcharts are widely used in engineering, architecture, science, analytics, government, politics, business, marketing, manufacturing, administration, etc.
Picture:
Flowchart of Products
Flowchart Examples
Related Solution:
ConceptDraw DIAGRAM extended with Target and Circular Diagrams Solution from the Marketing Area is a convenient and useful tool for creating Relative Circular Diagrams.
Target and Circular Diagrams Solution with large number of templates and samples of Circular Diagrams, and Circular Diagram library with various vector objects will help you in your diagramming process.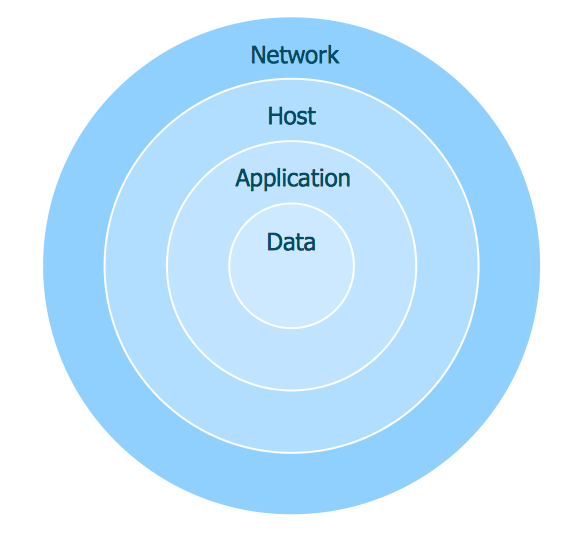
Picture: Relative Circular Diagram
Related Solution:
Any business process consists from a number of tasks carrying out the certain business goal. It is useful to diagram business processes to ensure that they are as foolproof, logical and sequential as possible. This business process diagram describes a typical booking process flow by the example of a cab booking process. It can be used as a roadmap for any booking system implementation. Diagramming a business process allows you to look at the entire project and take into account all types of possible scenarios. Business process diagram helps you investigate and clarify the process thoroughly so that you can find out how it can be improved. Business process diagram supports team communications by ensuring that each process element is clear and everyone in the team is on the same page.
Sometimes your company brings you less profit than you expect it to be, and it’s difficult to reveal the causes. Maybe it’s time to learn new technologies, because business diagram are easily developed by means of special software, so you won’t make any extra effort. In return, you will increase your productivity and get more done in a less time.
Picture: Business Diagram Software
Related Solutions:
The behavior of worker in organization is influences organizational effectiveness. A simple block diagram made with ConceptDraw Block diagrams solution can improve the understanding of expectations of workers regarding what they l contribute to organization and what they wait to obtain. Making block diagram depicting the individual behavior in organization is used in HR management to obtain an optimal and positive overall contribution to the organization.
The behavior of worker in organization is influences organizational effectiveness. A simple block diagram made with ConceptDraw Block diagrams solution can improve the understanding of expectations of workers regarding what they l contribute to organization and what they wait to obtain. Making block diagram depicting the individual behavior in organization is used in HR management to obtain an optimal and positive overall contribution to the organization.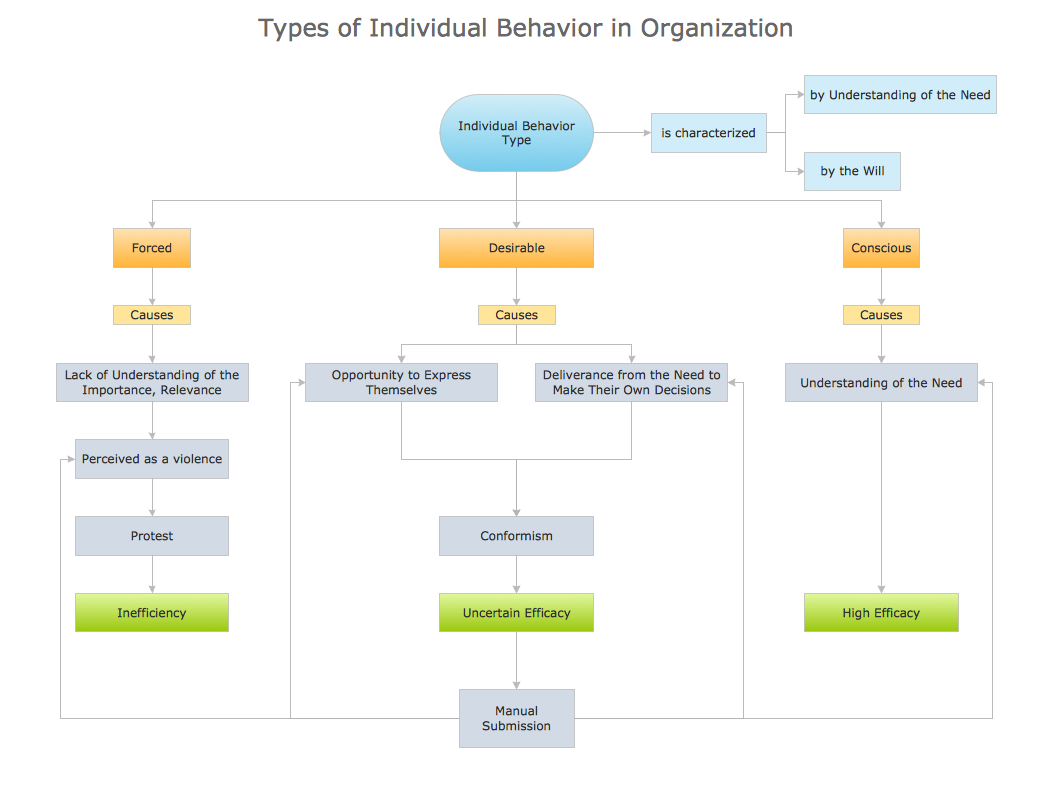
Picture: Basic Diagramming
Related Solution:
Enjoy the flowcharting process with the intuitive interface and powerful tools of the user-friendly ConceptDraw DIAGRAM software: ✔️ represent algorithms, ✔️ break down complex processes, ✔️ display workflows, ✔️ show procedures, ✔️ succeed in decision-making, ✔️ streamline processes, ✔️ increase productivity, ✔️ enhance efficiency
Picture: Flowcharting Software
Related Solution:
To create an Audit Process FlowChart you only need Conceptdaw Software.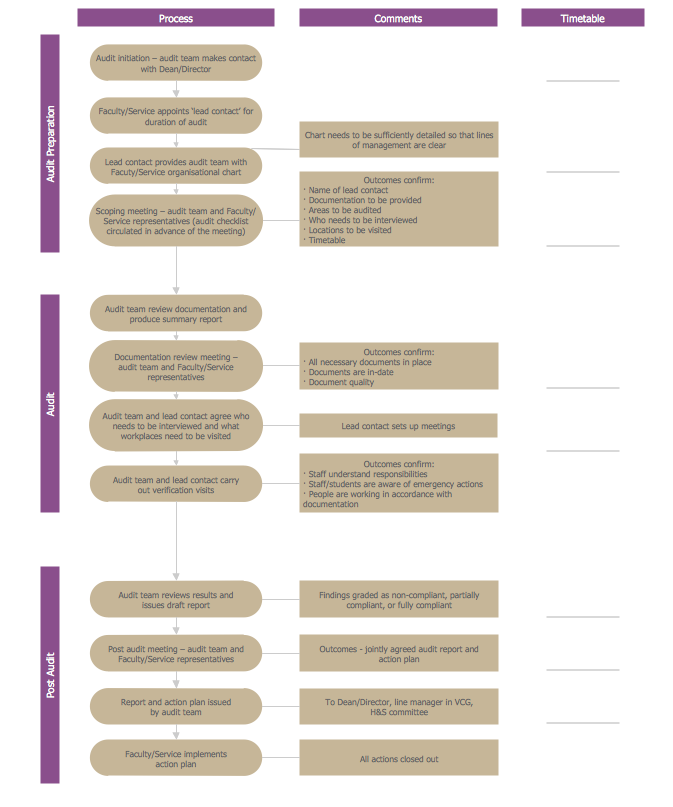
Picture: Basic Audit Flowchart. Flowchart Examples
Related Solution:
You need to draw the Circular Arrows Diagram, Segmented Diagram or Circular Flow Diagram? Any of these diagrams can be fast and easy designed in ConceptDraw DIAGRAM software, which offers the Business Diagrams Solution from the Management Area with extensive drawing tools, predesigned samples and circular flow diagram template. The use of ready template is the easiest way of drawing.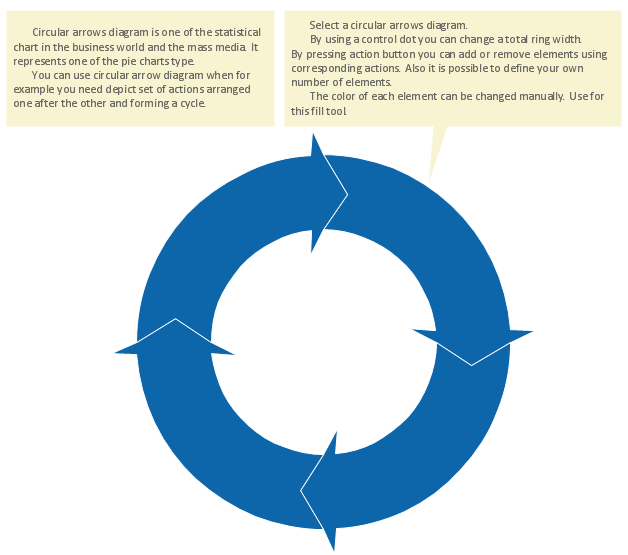
Picture: Circular Flow Diagram Template
Related Solution:
Circular Diagram is a type of diagram widely used in marketing and economics for visualization information in a clear and visual form. ConceptDraw DIAGRAM diagramming and vector drawing software offers the useful tools of the Target and Circular Diagrams solution from the Marketing area of ConceptDraw Solution Park for effective drawing a Circular Diagram of any complexity and design.
Picture: Circular Diagram
Related Solution:
Drawing the diagrams we try to find in help the powerful software and now we have the ConceptDraw DIAGRAM. The ability easily create the SDL diagrams is made possible thanks to unique Specification and Description Language (SDL) Solution from the Industrial Engineering Area of ConceptDraw Solution Park. This solution extends ConceptDraw DIAGRAM 2 libraries - SDL Connectors and SDL Diagrams that contain 70 predesigned SDL flowchart symbols.
Picture: SDL Flowchart Symbols
Related Solution: