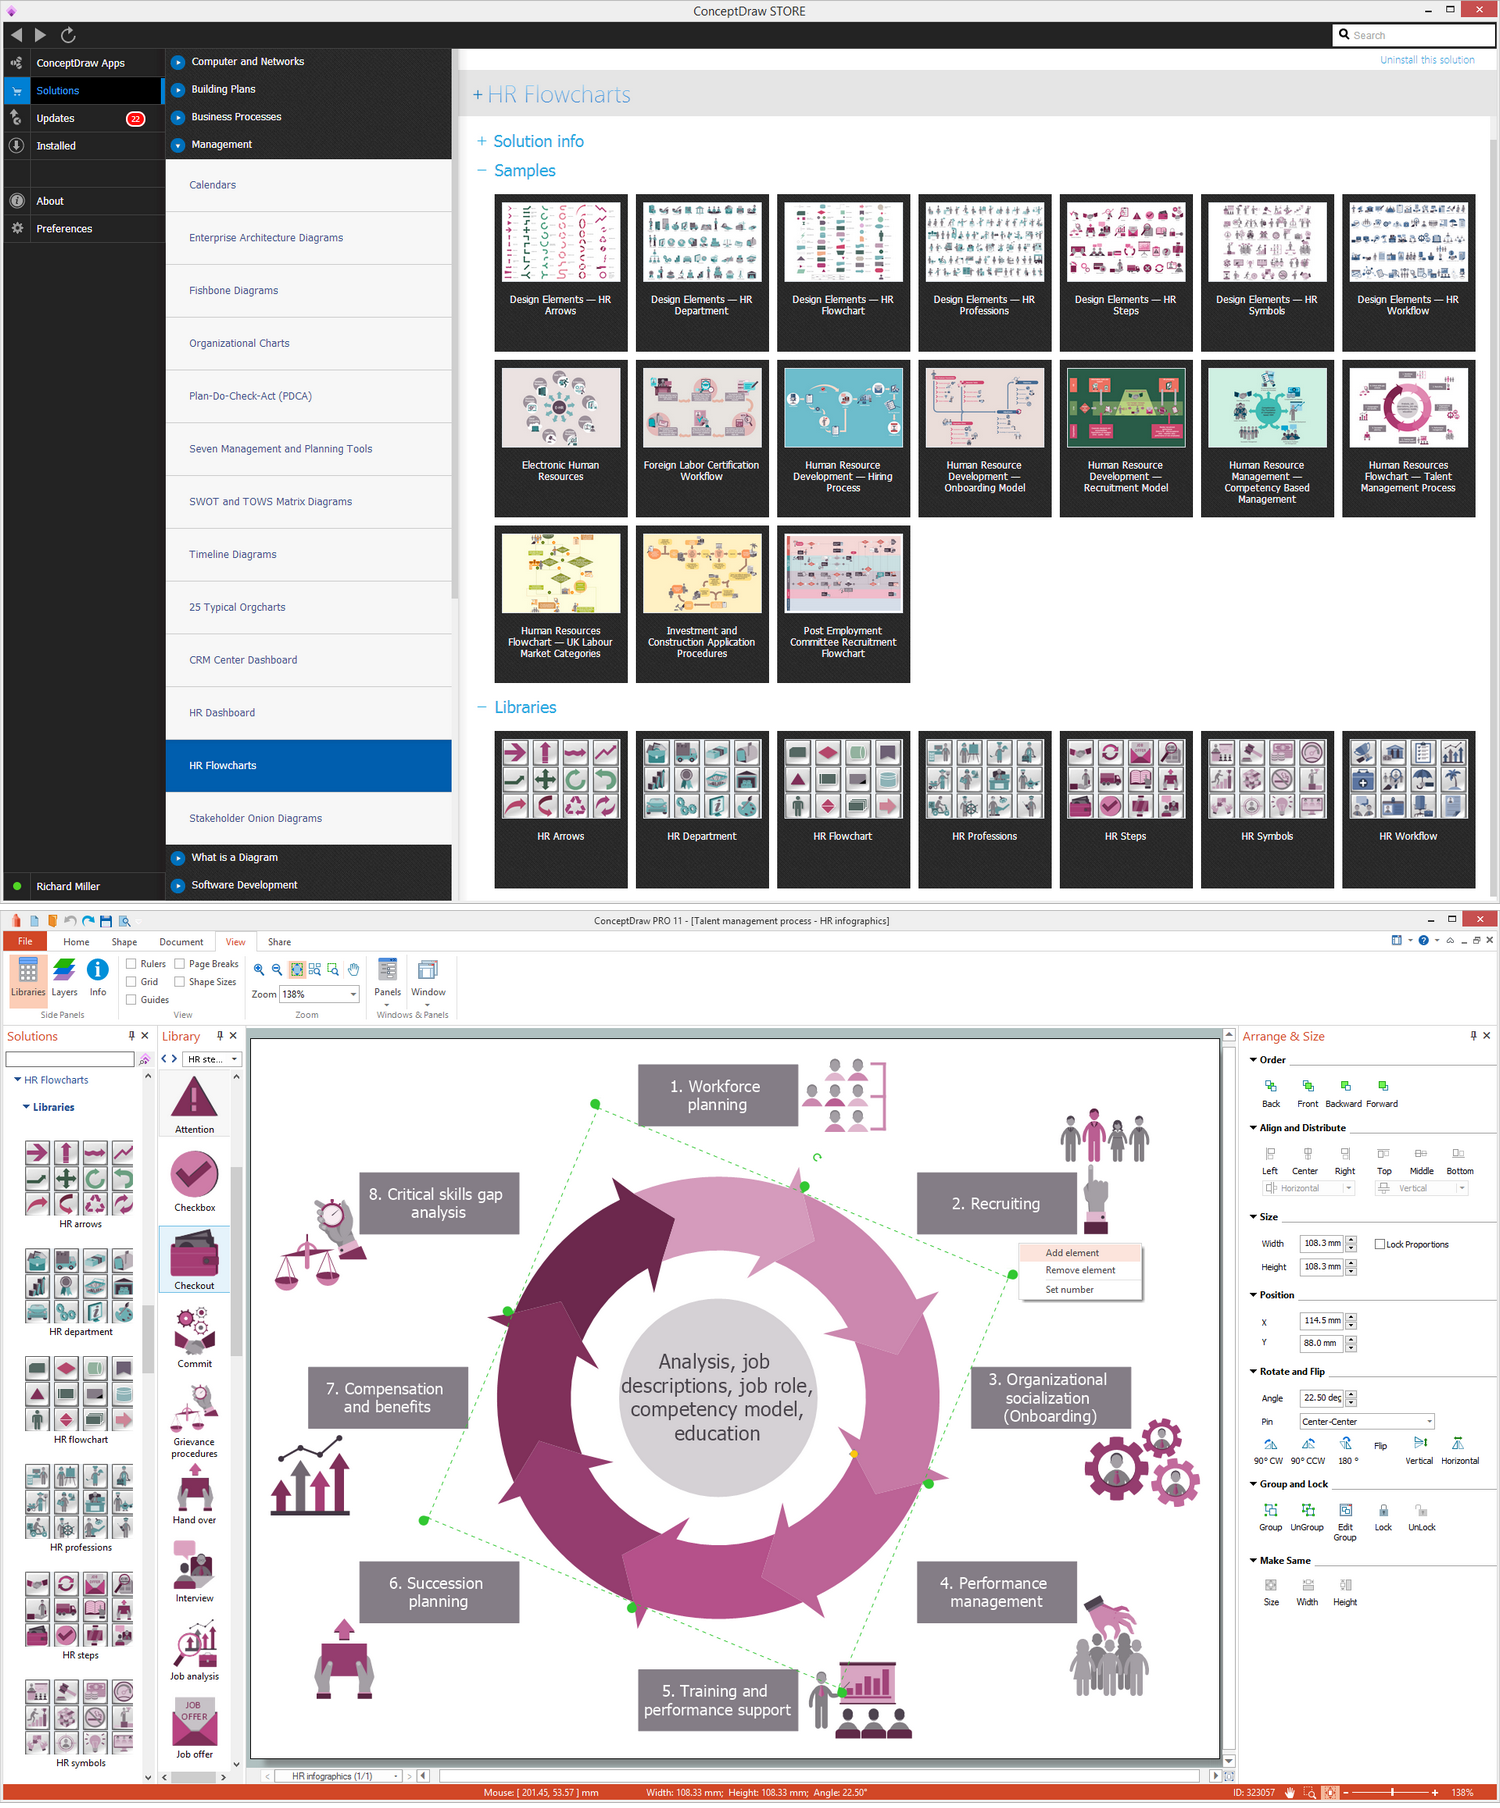
Column Chart Examples
Column graphsThinking about making a column chart? Then the best solution for creating it would be a Bar Graphs one — the one which is truly useful for making such kind of drawings, as it offers a huge variety of the templates which all can be always used as your drafts for making the smart looking results. The mentioned solution is always available for all the ConceptDraw DIAGRAM users in order to make it possible to achieve the set goals to improve your business as well as for simplifying the understanding of some data that has to be explained to your customers, partners, clients and another counterparty.  Column Chart Column Chart
 3D Column Chart 3D Column Chart
 Cylindrical Column Chart Cylindrical Column Chart
Example 1. Column chart examples Any column chart as well as any bar chart or bar graph is known to be simply a chart created with the rectangular bars, having lengths proportional to those values which they are expected to represent. Those bars can be always plotted either vertically or horizontally and a vertical bar chart is the one called a column bar chart by some people. Any column chart is a good option for comparing some pieces of information, such as the work of the different departments and it can be made within only a few minutes as long as you have the Bar Graphs solution downloaded from the ConceptDraw STORE application — the new product of CS Odessa, developed for making it simpler for all the ConceptDraw DIAGRAM users to create any needed column (bar) chart. Free Download Column Chart Software and View All Examples
Example 1. Column chart examples in ConceptDraw STORE You can find a stencil library offering the examples of the column charts which all can be always used as those you can edit any time you need adding your own data and so making it possible to complete the task of creating a professionally looking graph through a fun and entertaining way of correction. All eight available templates can be useful for making your own drawings such as vertical and/or horizontal bar charts, mentioning, for example, the income differences by age which are associated with differences in marital status. Another example, which was previously created by the professional designers of CS Odessa, is a 3D Bar Graph representing the number of members in the CNT between 1911 and 1937. It is made out of the 3D colored cylindrical vector objects, which illustrate the number of members in CNT in each year — 1911, 1919, 1931, 1936 and 1937. You can always change the year as well as other data, such as the number of members making it your own chart with the data you want to be mentioned. |


Example 3. Column chart example — Number of Members in the CNT between 1911 and 1937
The Amino Acid Composition of Complete UniProt Database is another example, offered by the professionals of CS Odessa, which can always be used as a base for the good-looking drawings of ConceptDraw DIAGRAM users. After installing the software and downloading the ConceptDraw STORE application from this site you can make it possible to get the Bar Graphs solution in order to make the column chart examples. Having the mentioned one means having the professionally created coloured graph with lots of pieces of data mentioned in a way of bars with the numbers all represented on the top of each of them.
The forth example is the one called “EPIET” Fellows by Country of Origin, where the European Programme for Invention Epidemiology Training fellowship is represented conducting the training in the European Union countries, giving the practical experience in invention epidemiology for the nurses, microbiologists, medical practitioners and other health specialists. The mentioned horizontal bar chart is a good option to base your own bar or column graph on, taking into consideration the fact that it was made by those who know lots about how to make such kinds of drawings in a proper way, professionally. Thus, there’s a list of countries, such as France, Germany, Spain, Portugal, Finland, Italy, the United Kingdom, Greece, Sweden, Denmark, Japan, Malta, Latvia, Lithuania, Ireland, Luxembourg, South Africa and other mentioned which all can be replaced with your own data, such as other countries of other pieces of information.
Another example, available for all the ConceptDraw DIAGRAM users to change in order to edit it for making their own drawings, is called as a “Percentage of U.S. high school Students”, showing the percentage of U.S. high school students who attended physical education class one or more days during an average school week with the percents illustrated on top of each bar and the bars themselves are those representing the years – 1991, 1993, 1995, 1997, 1999 and 2001. In the same way it is always possible to make another column chart showing the percentage of the pupils attending their classes during some period of time, such as a year, illustrating each of the months with a separate bar.
Besides of the mentioned samples, you can always find more templates, such as those called “Bar Chart – Average Trip Length”, “3D Vertical Bar Graph — Iran Internet Users per 100 person”, “Bar Chart — Nitrate Concentration in Community Water Systems”, “Percentage with Various Levels of Family Income”, “Serious Crime in Cincinnati”, etc.
Moreover, there are other articles about the bar and column charts you can find on this site.