Creating Flowcharts
A flowchart is a graphical representation of a process or an algorithm, or the step-by-step solution of a problem. The range of their applications is extensive - analytics, business, marketing, architecture, engineering, politics, science, manufacturing, government, administration, etc.
ConceptDraw DIAGRAM is the best flowchart software. The ConceptDraw Solution Park provides a Flowcharts Solution from the "Diagrams" area with useful tools for help you create the Flowcharts of any complexity quick and easy.
The Flowcharts Solution is available from the ConceptDraw STORE. Use the ConceptDraw STORE to navigate the ConceptDraw Solution Park, manage downloads and updates, take the access to libraries, templates and samples directly from it.

Example 1. Flowcharts Solution in ConceptDraw STORE
The Flowcharts Solution contains the "Flowchart" and "Flowcharts Rapid Draw" libraries with large quantity of ready-to-use predesigned vector objects.

Example 2. Flowchart Library
It also includes a rich set of templates and samples that you can use as the base for your own flowcharts.
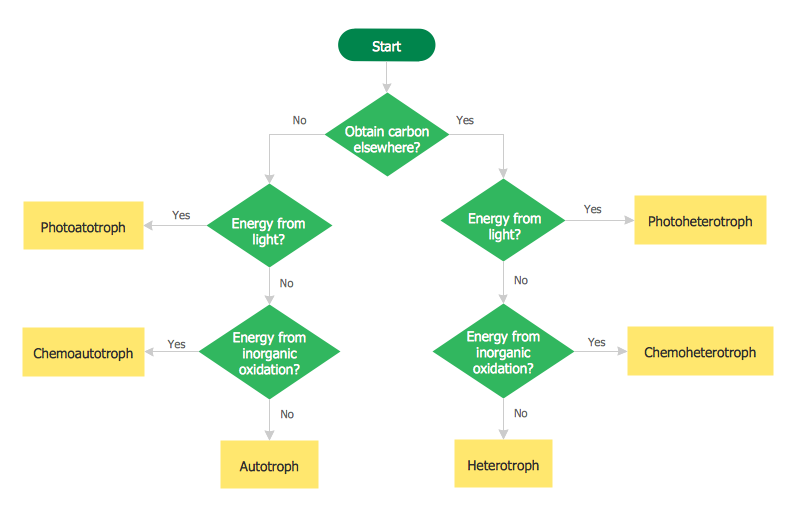
Example 3. Troph flow chart.
This example was redesigned from the file [en.wikimedia.org]
This sample was created in ConceptDraw DIAGRAM using the Flowcharts Solution from the "Diagrams" Area of ConceptDraw Solution Park and shows the definition of belonging to heterotroph, autotroph, or a subtype.
Use Flowcharts Solution for ConceptDraw DIAGRAM to create your own Flowcharts quick, easy and effective.
The Flowcharts designed with ConceptDraw DIAGRAM are vector graphic documents and are available for reviewing, modifying, converting to a variety of formats (image, HTML, PDF file, MS PowerPoint Presentation, Adobe Flash or MS Visio), printing and send via e-mail in one moment.
TEN RELATED HOW TO's:
In ConceptDraw DIAGRAM it really is sp simple to draw even the most complex cross-functional flowcharts. Use the RapidDraw technology and Cross-Functional libraries in ConceptDraw DIAGRAM for the best results.
Picture: How to Simplify Flow Charting — Cross-functional Flowchart
Related Solution:
Tools to deliver presentations remotely via Skype
Picture: How To Share Presentation via Skype
Related Solution:
As concept map consists from conception-blocks and links between them, you can use ConceptDraw library objects and add to a document as much objects as you need. ConceptDraw tools let you to edit, group, move objects, change their appearance and add text signs and raster or vector pictures.
ConceptDraw DIAGRAM diagramming and vector drawing software extended with Concept Maps Solution from the Diagrams Area is effective tool for creating professional looking Concept Maps.
Picture: Concept Maps
Related Solution:
All Gantt charts were made using ConceptDraw PROJECT. ConceptDraw PROJECT works both on Windows and Mac OS X. It allows to schedule a voluntary number of projects in a single Workspace document and lets easily share tasks and resources among them. ConceptDraw PROJECT shares files among Windows and Mac OS X.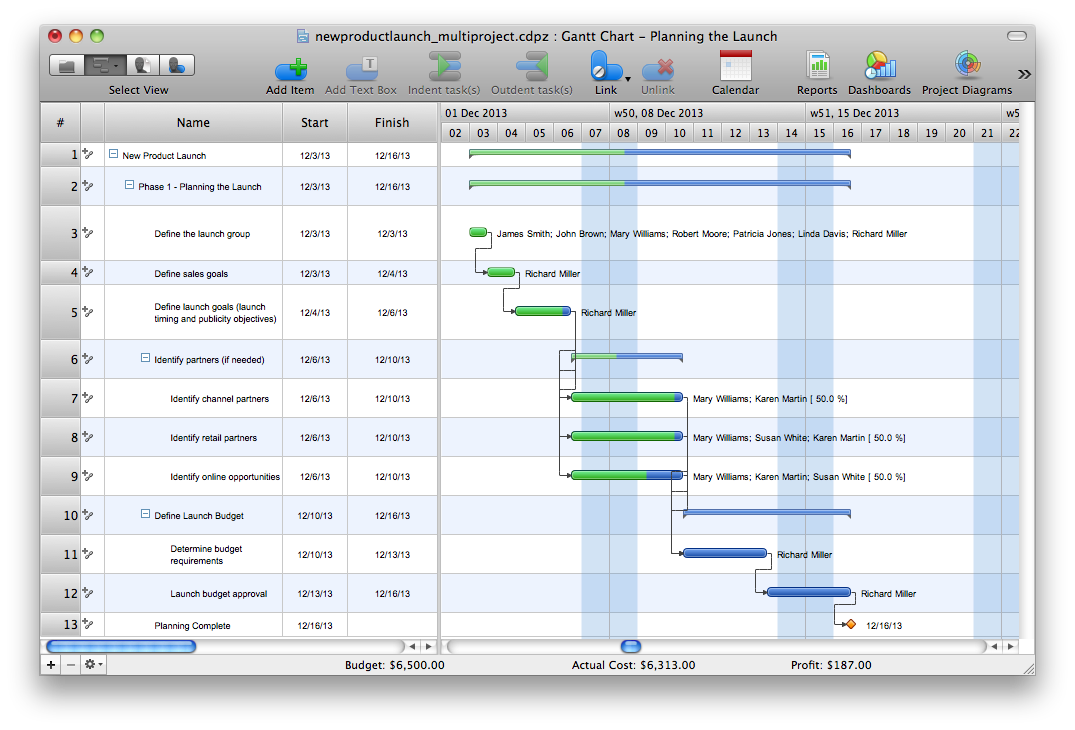
Picture: Gantt chart examples
Collaboration tool for project management enables you to give a new role to knowledge management and document sharing within your team.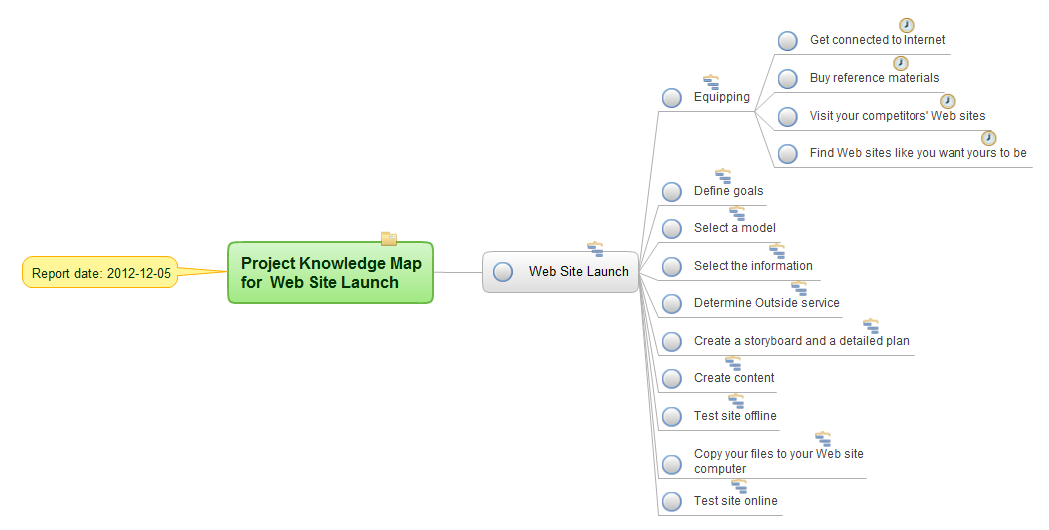
Picture: How To Use Collaboration Tool in Project Management
Related Solution:
Fast creating visualization for structured data is the main capability of ConceptDraw DIAGRAM software. With numerous vector stencils from object libraries and the RapidDraw technology this software becomes the best cross-functional flowchart software.
Picture: Create a Cross-Functional Flowchart
Related Solution:
To draw an effective workflow you have to have an ability to focus on thinking, not drawing. This becomes possible with ConceptDraw DIAGRAM software. Thanks to Arrows10 technology, you are able to place steps and relations onto your workflow diagram without thinking of how to do this, or which stencil to use. This is the most natural and effective way of drawing workflows.
Picture: How to Draw an Effective Workflow
Related Solution:
Perfect charts and graphics diagramming software with rich examples and template. ConceptDraw is ideal to draw Charts and Graphics.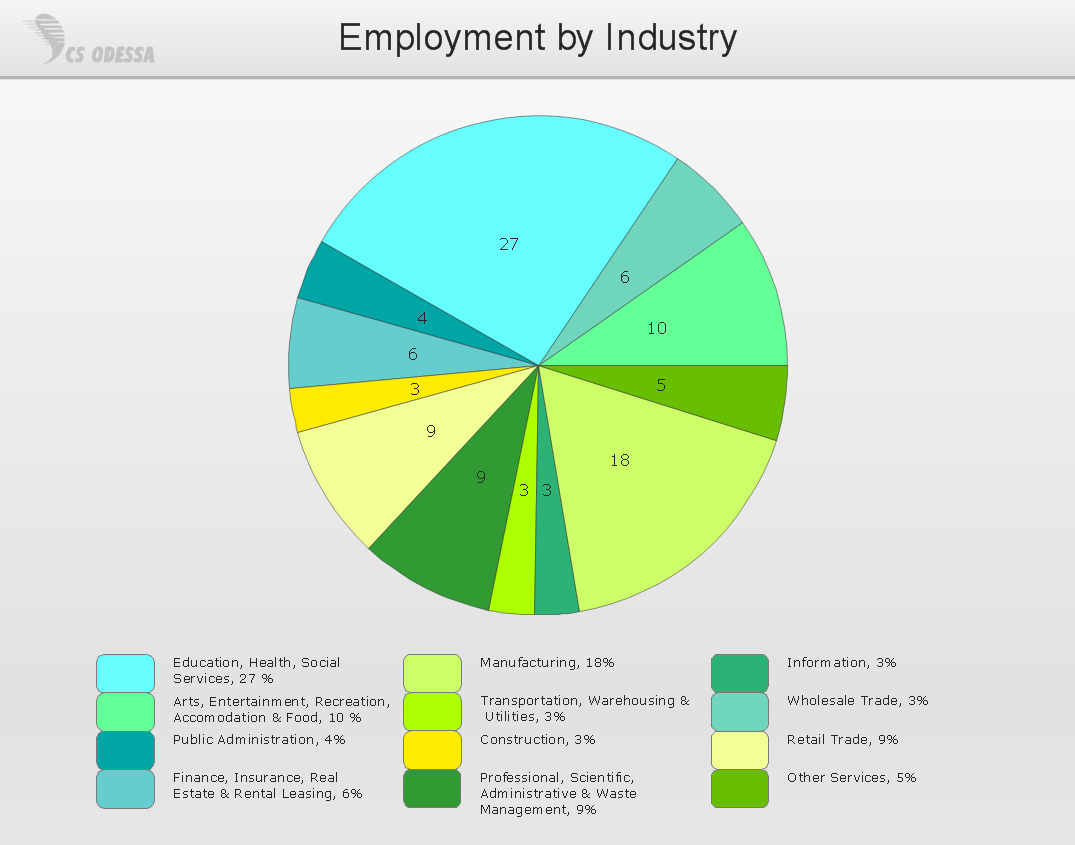
Picture: Basic Diagramming
Related Solution:
29095The Data Encryption Standard (DES) is a symmetric-key algorithm for the encryption of the electronic data.
This diagram was created in ConceptDraw DIAGRAM using the Computer and Networks Area of ConceptDraw Solution Park and shows how the encryption and access control work together to secure data.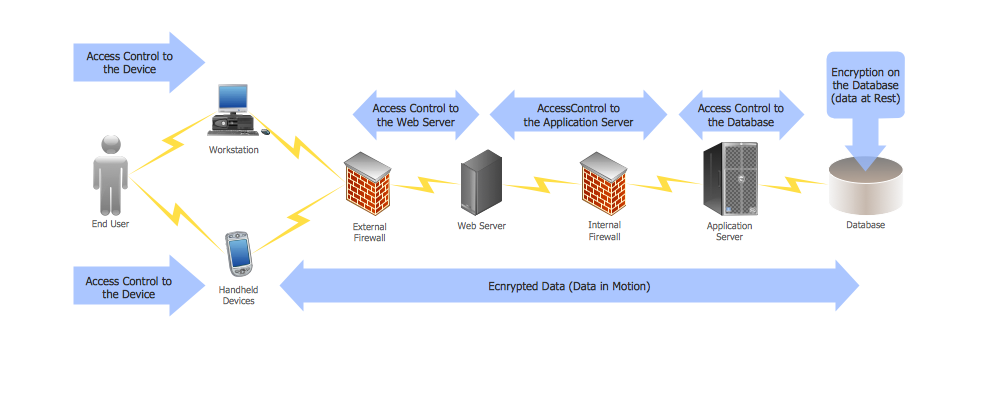
Picture: DES Network. Computer and Network Examples
Related Solution:
Event-Driven Process Chain Diagrams for improvement throughout an organisation.
ConceptDraw DIAGRAM - software that reduces the time needed to create a business process model.
Picture: Structuring a business process as a chain of events and functions
Related Solution:
