
Sample 1. Product proposal documents expanded
This mindmap was created in ConceptDraw MINDMAP mind mapping software by experienced user for 30 minutes as a sample for solution Note Exchange from ConceptDraw Solution Park.
The Note Exchange solution extends ConceptDraw MINDMAP with the ability to exchange with Evernote, and access mind maps anywhere, on any computer or mobile device via Evernote.
Use ConceptDraw MINDMAP enhanced with Note Exchange solution as a specification management tool, sending detailed specification from your mind map to Evernote.
Using the Note Exchange solution you can upload a whole specification map, or specific parts relating to a certain product or service part or requirement, and you can access your specification mind maps wherever you are.
TEN RELATED HOW TO's:
Create a mind map from an existing MS PowerPoint presentation. This input gives you the capability to choose any.pptx file and convert it into a mind map.
Picture: Presentation Exchange
Related Solution:
Good presentation ideas come the same way as we discover the real world, from personal experiences.
Picture: How To Create Good Presentation Ideas
Related Solution:
When trying to figure out the nature of the problems occurring within a project, there are many ways to develop such understanding. One of the most common ways to document processes for further improvement is to draw a process flowchart, which depicts the activities of the process arranged in sequential order — this is business process management. ConceptDraw DIAGRAM is business process mapping software with impressive range of productivity features for business process management and classic project management. This business process management software is helpful for many purposes from different payment processes, or manufacturing processes to chemical processes. Business process mapping flowcharts helps clarify the actual workflow of different people engaged in the same process. This samples were made with ConceptDraw DIAGRAM — business process mapping software for flowcharting and used as classic visio alternative because its briefly named "visio for mac" and for windows, this sort of software named the business process management tools.
This flowchart diagram shows a process flow of project management. The diagram that is presented here depicts the project life cycle that is basic for the most of project management methods. Breaking a project into phases allows to track it in the proper manner. Through separation on phases, the total workflow of a project is divided into some foreseeable components, thus making it easier to follow the project status. A project life cycle commonly includes: initiation, definition, design, development and implementation phases. Distinguished method to show parallel and interdependent processes, as well as project life cycle relationships. A flowchart diagram is often used as visual guide to project. For instance, it used by marketing project management software for visualizing stages of marketing activities or as project management workflow tools. Created with ConceptDraw DIAGRAM — business process mapping software which is flowcharting visio alternative or shortly its visio for mac, this sort of software platform often named the business process management tools.
Picture: Process Flowchart: A Step-by-Step Comprehensive Guide
Related Solution:
How to make great presentation via Skype - It let presenter to control over the slide-show process which plays on each computer of Skype conference call participants synchronously.
Another great feature, at the end of presentation each participant of conference call have the copy of presentation document file. It saves in Presentation History folder. Later, its very easy to return back to presentation history and view it again or show for other team.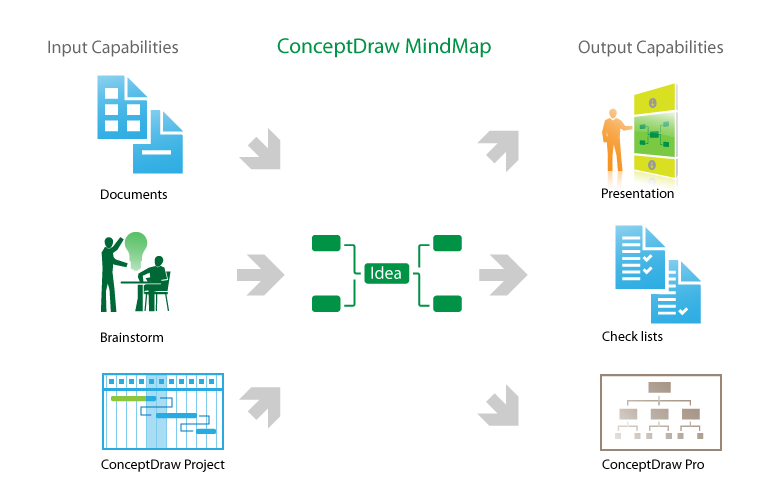
Picture: How to make great presentation via Skype? ...how it works with ConceptDraw MINDMAP?
Related Solutions:
It's no secret that there is a list of skills that every average system administrator should have. And it's important to be able to manage domains via active directory technologies. The best way to keep all the details in mind is to draw a diagram representing users, groups and domains.
This diagram represents an Active Directory Services (Active Directory Domain Services). It can be helpful for system and network administrators to organize a network physical and logical elements (domains, data bases, servers, network equipment, end-user computers etc.) into a secure and logical structure. The logical structure of Active Directory is a hierarchical organization of all network components. The data that is stored in Active Directory comes from some diverse sources. The Active Directory diagram created using ConceptDraw Active Directory Diagram solution. It shows allocating group policies and functions assigned to end users. It helps to plan, manage and maintain the certain user access scenario.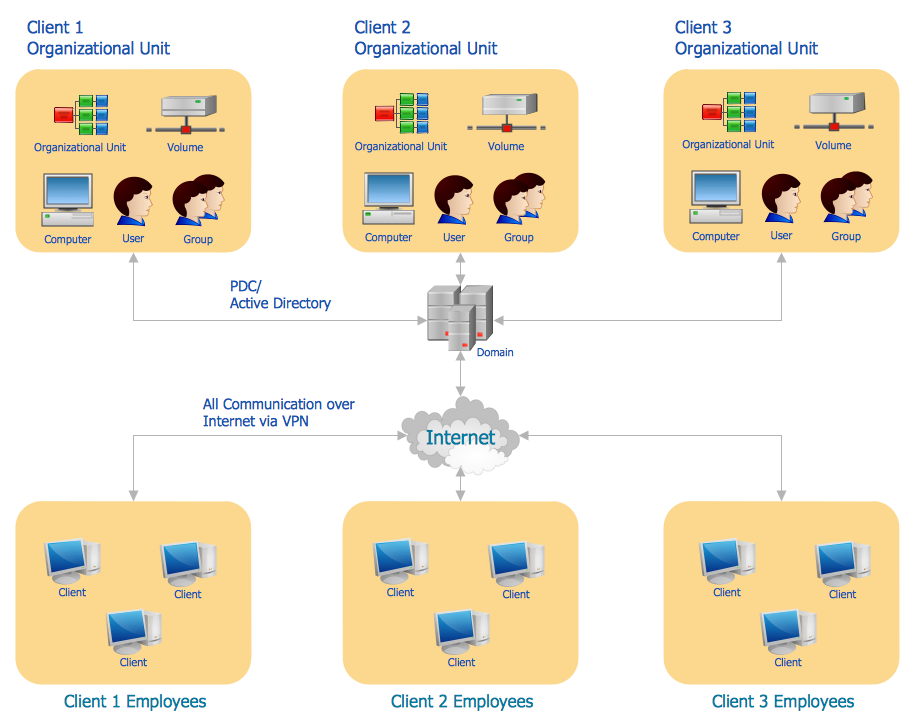
Picture: Active Directory Diagram
Related Solution:
ConceptDraw DIAGRAM extended with IDEF Business Process Diagrams solution from the Business Processes area of ConceptDraw Solution Park is an ideal software for effective database design and drawing IDEF diagrams visually representing all steps of database design process.
Picture: Database Design
Related Solution:
A flowchart is a simple but very functional tool when it comes to understanding a workflow or to removing unnecessary stages from a process. When drawing flowcharts, keep in mind that there are four common types of flowcharts, like document flowcharts and data flowcharts that show control over a data or document flow over a system. To show controls on a physical level, use system flowcharts. In addition, to show controls in a program, you can draw a program flowchart.
This flowchart diagram represents the piece of an article editing process, that involves the author and editor. It was created using the Basic Flowchart notation that consists from the basic flowchart symbols. The start and the end of the process are indicated with "Terminator" symbols. The "Process" symbols show the action steps consisting from making edits and searching for a compromise, when the author does not agree with the suggestions of the editor. The "Process" symbol is the general symbol in process flowcharts. The "Decision" symbol indicates a branching in the process flow. There are two branches indicated by a Decision shape in the current flowchart (Yes/No, Disagree/Agree). This basic flowchart can be used as a repeating unit in the workflow diagram describing the working process of some editorial office.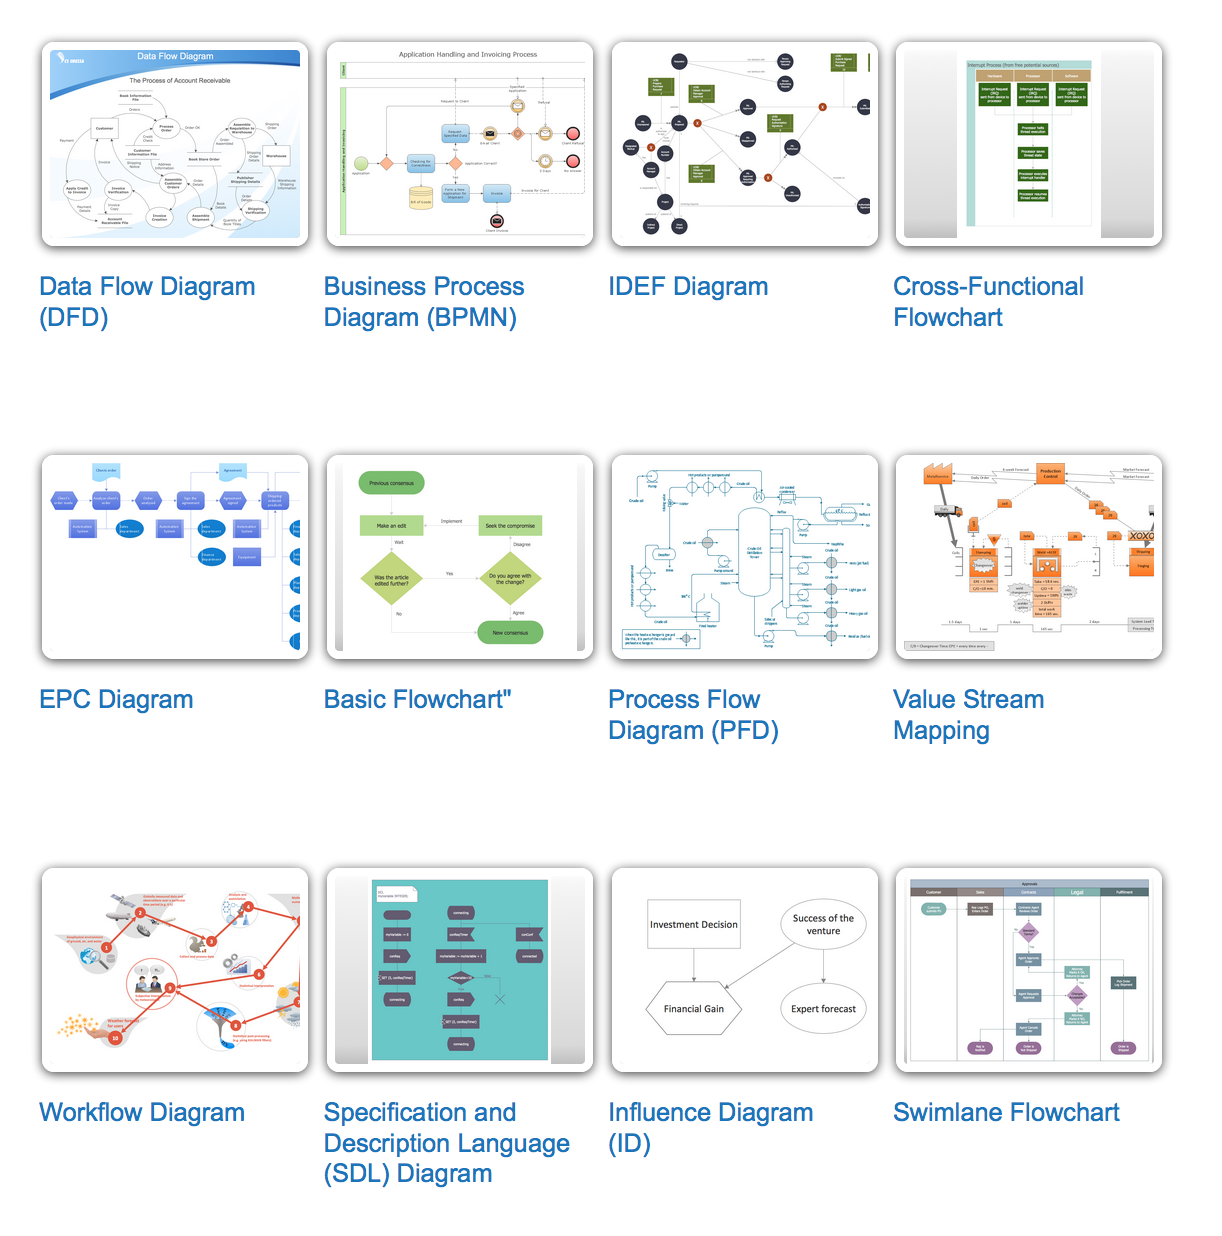
Picture: Types of Flowcharts
Related Solution:
Competitor analysis is a first and obligatory step in elaboration the proper corporate marketing strategy and creating sustainable competitive advantage. Use powerful opportunities of numerous solutions from ConceptDraw Solution Park for designing illustrative diagrams, charts, matrices which are necessary for effective competitor analysis.
Picture: Competitor Analysis
Related Solution:
Using a combination of Interactive Flowcharts with Action Mind Maps helps professional social media teams be more proactive and prepared with proper responses. Social Media Response solution minimizes Time-to-Response, improves the quality of responses, and assists in your entire marketing strategy.
Picture: That Helps Professional Social Media Teams
Related Solution:
ConceptDraw MINDMAP - an excellent tool for exporting mind maps to PowerPoint to visualize and presenting your project. You can simply generate, change, update your mindmap and then make a presentation in PowerPoint.
Picture: How To Do A Mind Map In PowerPoint
Related Solution: