
Example 1. Diagram of a Pyramid - DNA model of seduction
With useful tools of Pyramid Diagrams Solution you can easily create a pyramid with any quantity of levels. The Pyramid Diagrams library from the Pyramid Diagrams Solution contains 28 predesigned vector objects for drawing a diagram of a pyramid of any type and style.

Example 2. Diagram of a Pyramid - Ecosystem goods and services
Pay also your attention for the extremely large collection of predesigned samples and templates. All they are available for viewing and editing from ConceptDraw STORE. Don't miss your chance to take advantage of them.

Example 3. Diagram of a Pyramid - Global liquidity inverted pyramid
The samples you see on this page were created in ConceptDraw DIAGRAM software using the Pyramid Diagrams Solution. Each diagram of a pyramid represented here successfully demonstrates solution's capabilities and professional results you can achieve. An experienced user spent 5 minutes creating every of these samples.
Use the Pyramid Diagrams Solution for ConceptDraw DIAGRAM software to create your own professional looking 2D and 3D pyramid diagrams quick, easy and effective, and then successfully use them in your life and work activity.
All source documents are vector graphic documents. They are available for reviewing, modifying, or converting to a variety of formats (PDF file, MS PowerPoint, MS Visio, and many other graphic formats) from the ConceptDraw STORE. The Pyramid Diagrams Solution is available for all ConceptDraw DIAGRAM or later users.
SIX RELATED HOW TO's:
When we start to speak about databases, we must always mention database structure visualization. One of the most common ways to do it is to create an entity relationship diagram, and to put appropriate symbols on it. It is important either for database projecting and for its' future maintenance.
Entity Relationship Diagram describes data elements and their relationships within a database. There are a set of special symbols that depict each element of an entity relationship diagram. Entities - represents some stable components such as supplier, employee, invoice, client, etc. Relation symbols show how the entities interact. Attributes define characteristics of the relationships. Attributes can be one-to-one or many-to-many. Physical symbols is used in the physical models. They represent items such as fields, tables, types and keys. ERD physical symbols are the building material for the database. Notation lines are used to illustrate the relationships. The most common method is Crow’s Feet notation. You can use ConceptDraw Entity-Relationship Diagram (ERD) solution to represent a database using the Entity-Relationship model.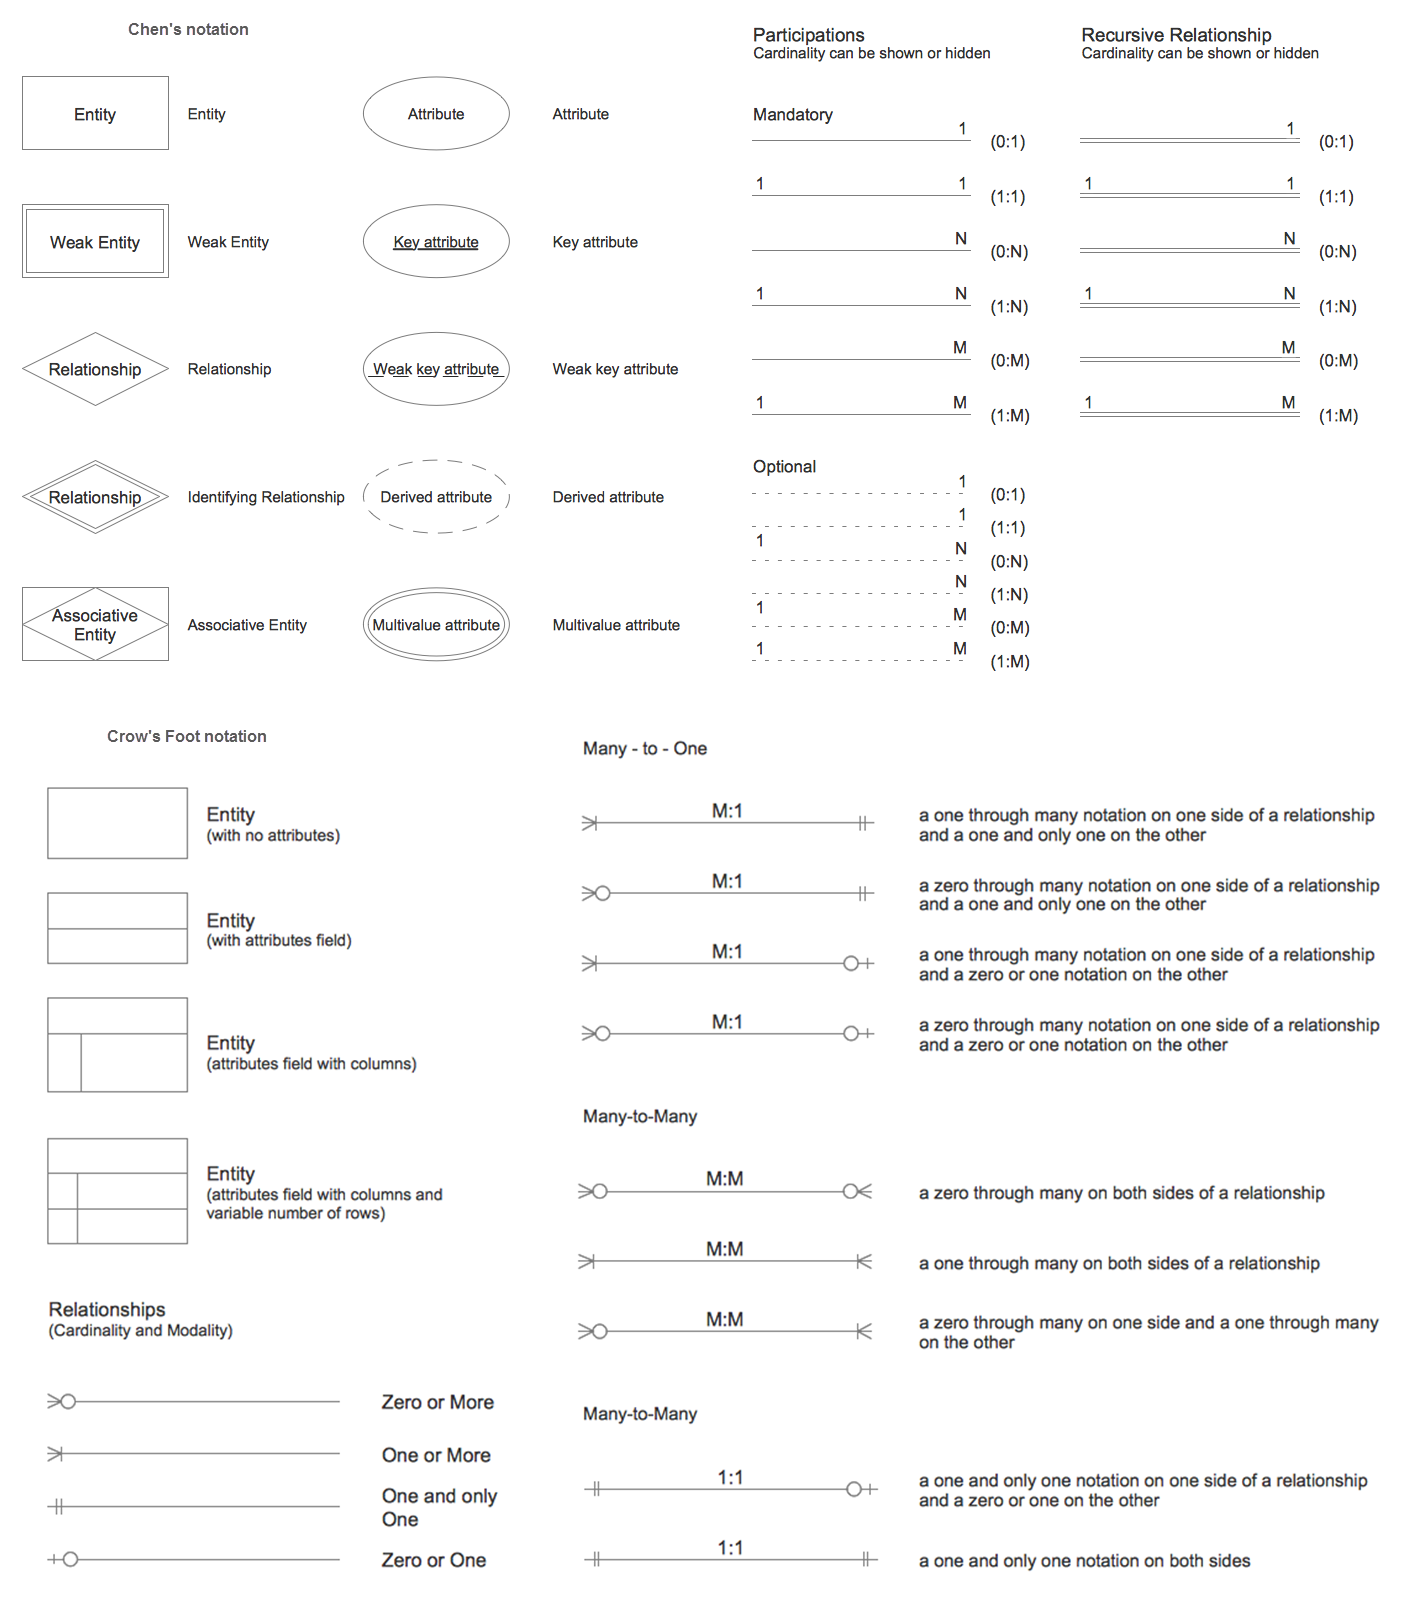
Picture: Entity Relationship Diagram Symbols
Related Solution:
ConceptDraw offers you a number of ready-made organizational chart templates which you can use in your drawing. They are grouped in topical sets as organizational chart template files.
Use the Organizational Charts Solution for ConceptDraw DIAGRAM to create your own Organizational Charts of any complexity quick, easy and effective.
The Organizational Charts designed with ConceptDraw DIAGRAM are vector graphic documents and are available for reviewing, modifying, converting to a variety of formats (image, HTML, PDF file, MS PowerPoint Presentation, Adobe Flash or MS Visio XML), printing and send via e-mail in one moment.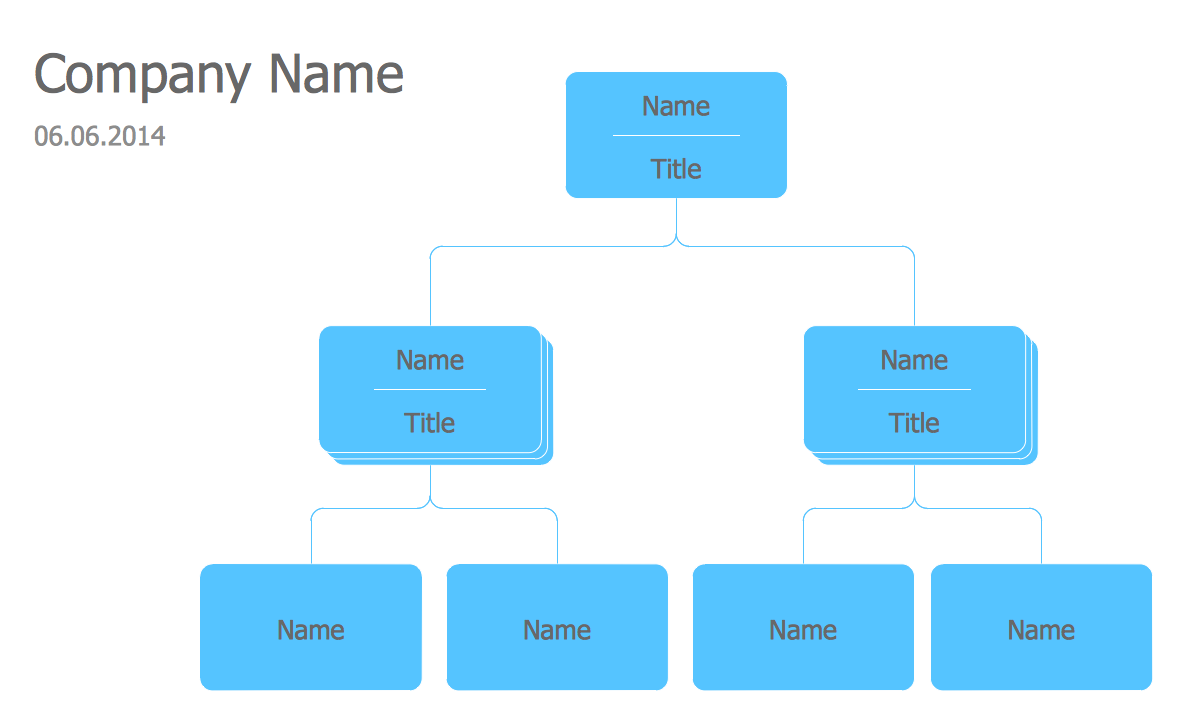
Picture: Organizational Chart Templates
Related Solution:
There are three main types of organizational structures which can be adopted by organizations depending on their objectives: functional structure, divisional structure, matrix structure.
ConceptDraw DIAGRAM diagramming and vector drawing software enhanced with 25 Typical Orgcharts solution from the Management area of ConceptDraw Solution Park is ideal for designing diagrams and charts of any organizational structure types.
Picture: Organizational Structure Types
Related Solution:
Easy charting software comes with beautiful chart templates and examples. This makes it easy to create professional charts without prior experience.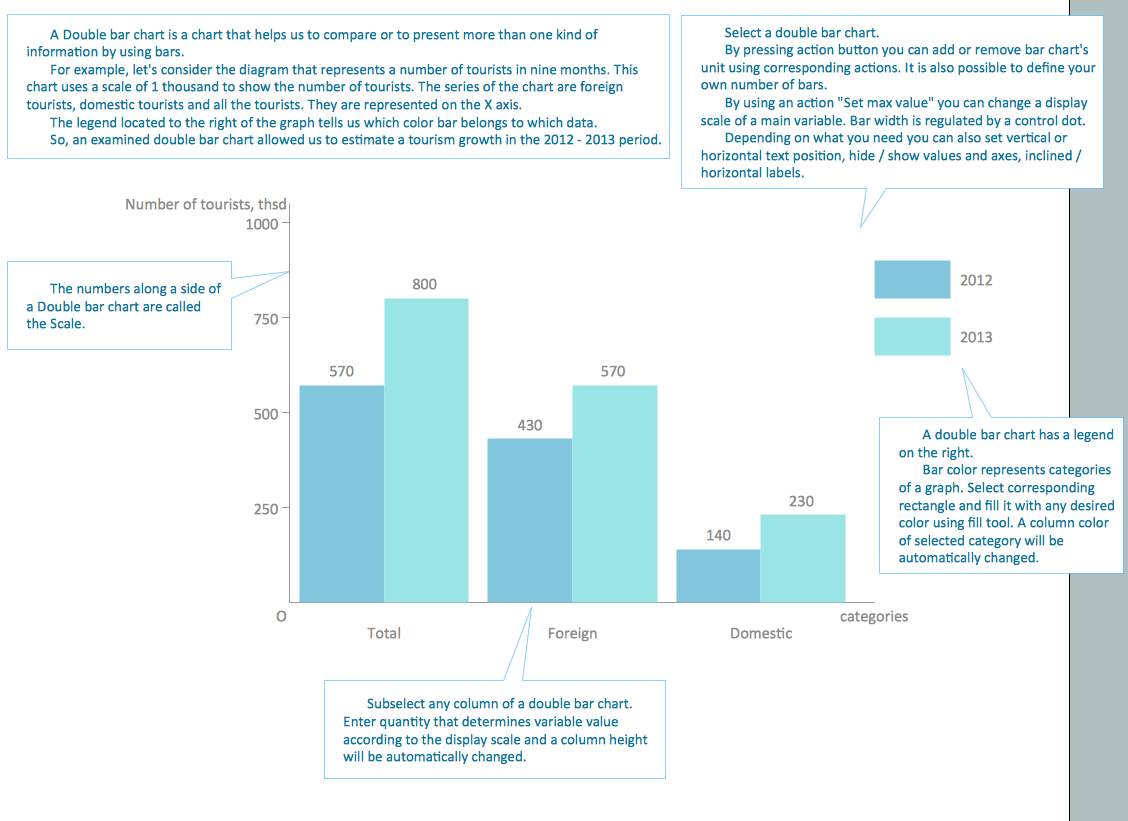
Picture: Chart Templates
This method of problem analysis is widely used in IT, manufacture industries and chemical engineering. If you want to take a fresh look on your problem, you can draw a fishbone diagram with ConceptDraw DIAGRAM software, which supports both MAC OS and Windows. You can see and download fishbone diagram samples and templates in ConceptDraw Solution Park.
This Fishbone (Ishikawa) diagram can be applied as template for performing the cause and effect analysis of a service industry problems. It can help to determine factors causing problems. Causes in this diagram are categorized according to the 4S’s principle that means Surroundings, Suppliers, Systems and Skills. Grouping causes allows to reveal main interactions between different events. This diagram was made using ConceptDraw Fishbone diagrams solution. It can help to reveal the causes effected a complicated issue. Of course it can be used together with other methods of approaching to the problem solving.
Picture: Draw Fishbone Diagram on MAC Software
Related Solution:
Bureaucratic companies usually are characterized by a strict hierarchy and clearly defined responsibilities. However, sometimes organizational structure of a company reminds of somewhat tangled. To clarify it, you can create an orgchart that will represent the company as a tree with its' departments as branches.
This organization diagram represents a tree-like organizational structure. This is a typical example of a top-level branches of the hierarchical organizational structure. This part of the tree shows heads of branches who are subordinated completely to the president. The information and solutions are distributed though a tree structure down to the company's departments. Each of the sub-division has its own structure that is reflected in the corresponding organizational chart. This orgchart diagram was created using the vector graphic library supplied with ConceptDraw Organizational Charts solution.
Picture: Organizational Structure
Related Solution:

