Create a Flow Chart
ConceptDraw DIAGRAM is a powerful business and technical diagramming software tool that enables you to design professional-looking graphics, diagrams, flowcharts, floor plans and much more in just minutes. Maintain business processes performance with clear visual documentation. Effectively present and communicate information in a clear and concise manner with ConceptDraw DIAGRAM
Start creating your own flowcharts with ConceptDraw DIAGRAM and accomplish great results in the moment. The software contains built-in object libraries of vector stencils that allow you use RapidDraw technology.
Sample 1. RapidDraw Flowchart Template
Clicking on direction arrows you can add new objects to the flowchart. Users can start drawing their own flowchart diagrams in fast and simple way.
ConceptDraw DIAGRAM is the only professional diagramming software that works on both Windows and Macintosh platforms. All its documents and libraries are 100% compatible and can be exchanged hassle-free between the platforms.

Sample 1. Flow Charts
With ConceptDraw Office ConceptDraw DIAGRAM provides you with the tools you need to generate reports documentation and presentations that entirely reflect project performance.
Comprehensive tools for information visualization
Vector Drawing Tools
The huge set of vector drawing tools can compete with any professional illustration program. Customizable Grid and Snap tools help to position your shapes precisely. Alignment, Distribution and Make Same tools will automate routine operations with multiple shapes.
Libraries and Cliparts
Wide collections of shapes and Cliparts help you create a different types of diagrams, such as Business Process, Network Diagram, Organization Chart as well as various sorts of technical drawings.
Smart Connectors and Custom Connection Points
Lines stay linked to their shapes, so you don't need to redraw your diagram every time you move something. Smart connectors can follow shapes around, as well as display gaps or bridges where they cross other connectors. Every shape can be turned into a connector. You can easily add connection points to any part of the shape.
Layers and Texture fill
You can use unlimited number of layers to organize related shapes in one document page. Use one of the preset textures fill to create professionally looking objects.
Presentation mode
With Presentation Mode you can perform an attractive full screen presentation from ConceptDraw documents without a need to use any special application.
TEN RELATED HOW TO's:
This template shows the Context Diagram. It was created in ConceptDraw DIAGRAM diagramming and vector drawing software using the Block Diagrams Solution from the “Diagrams” area of ConceptDraw Solution Park.
The context diagram graphically identifies the system. external factors, and relations between them. It’s a high level view of the system. The context diagrams are widely used in software engineering and systems engineering for designing the systems that process the information.
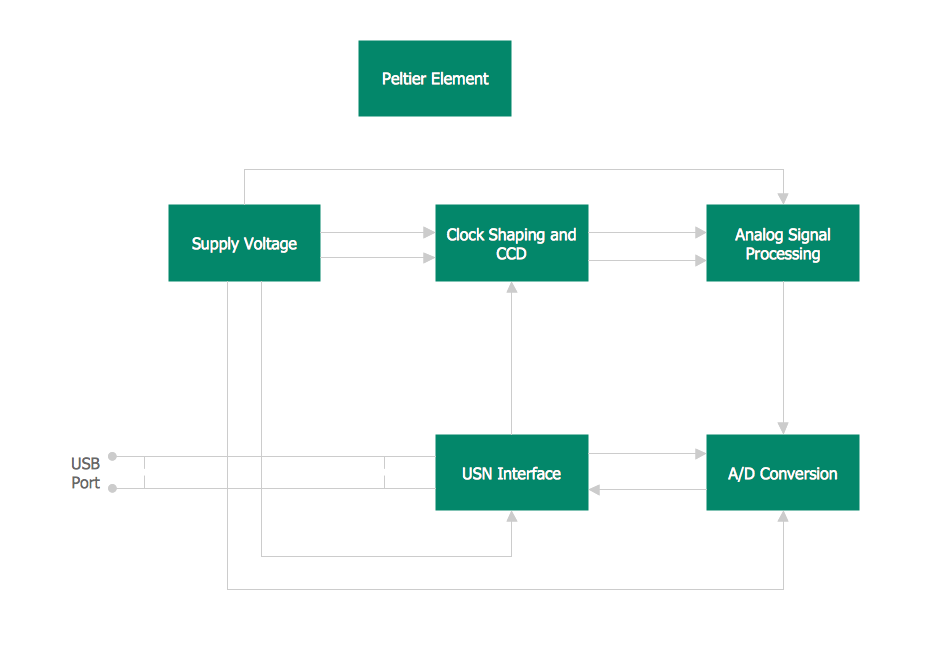
Picture: Context Diagram Template
Related Solution:
Any information system receives data flows from external sources. In order to visualize them there is a list of data flow diagram symbols that describes how the system components cooperate. If you want to create a data flow diagram, ConceptDraw DIAGRAM Solution Park has DFD Library that contains both Yourdon and Gane-Sarson notations.
This figure shows the content of vector libraries, delivered with ConceptDraw solution for data flow diagram (DFD). There are three libraries composed from about 50 vector objects used to make data flow diagrams.
They include a complete set of objects utilized by Yourdon-Coad and Gane-Sarson notations - two primary notations that are apply for data flow diagramming. Also, one can discover additional "Data flow diagram (DFD)" library that provides a data flow diagram elements for designing level 1 and context-level data flow diagrams.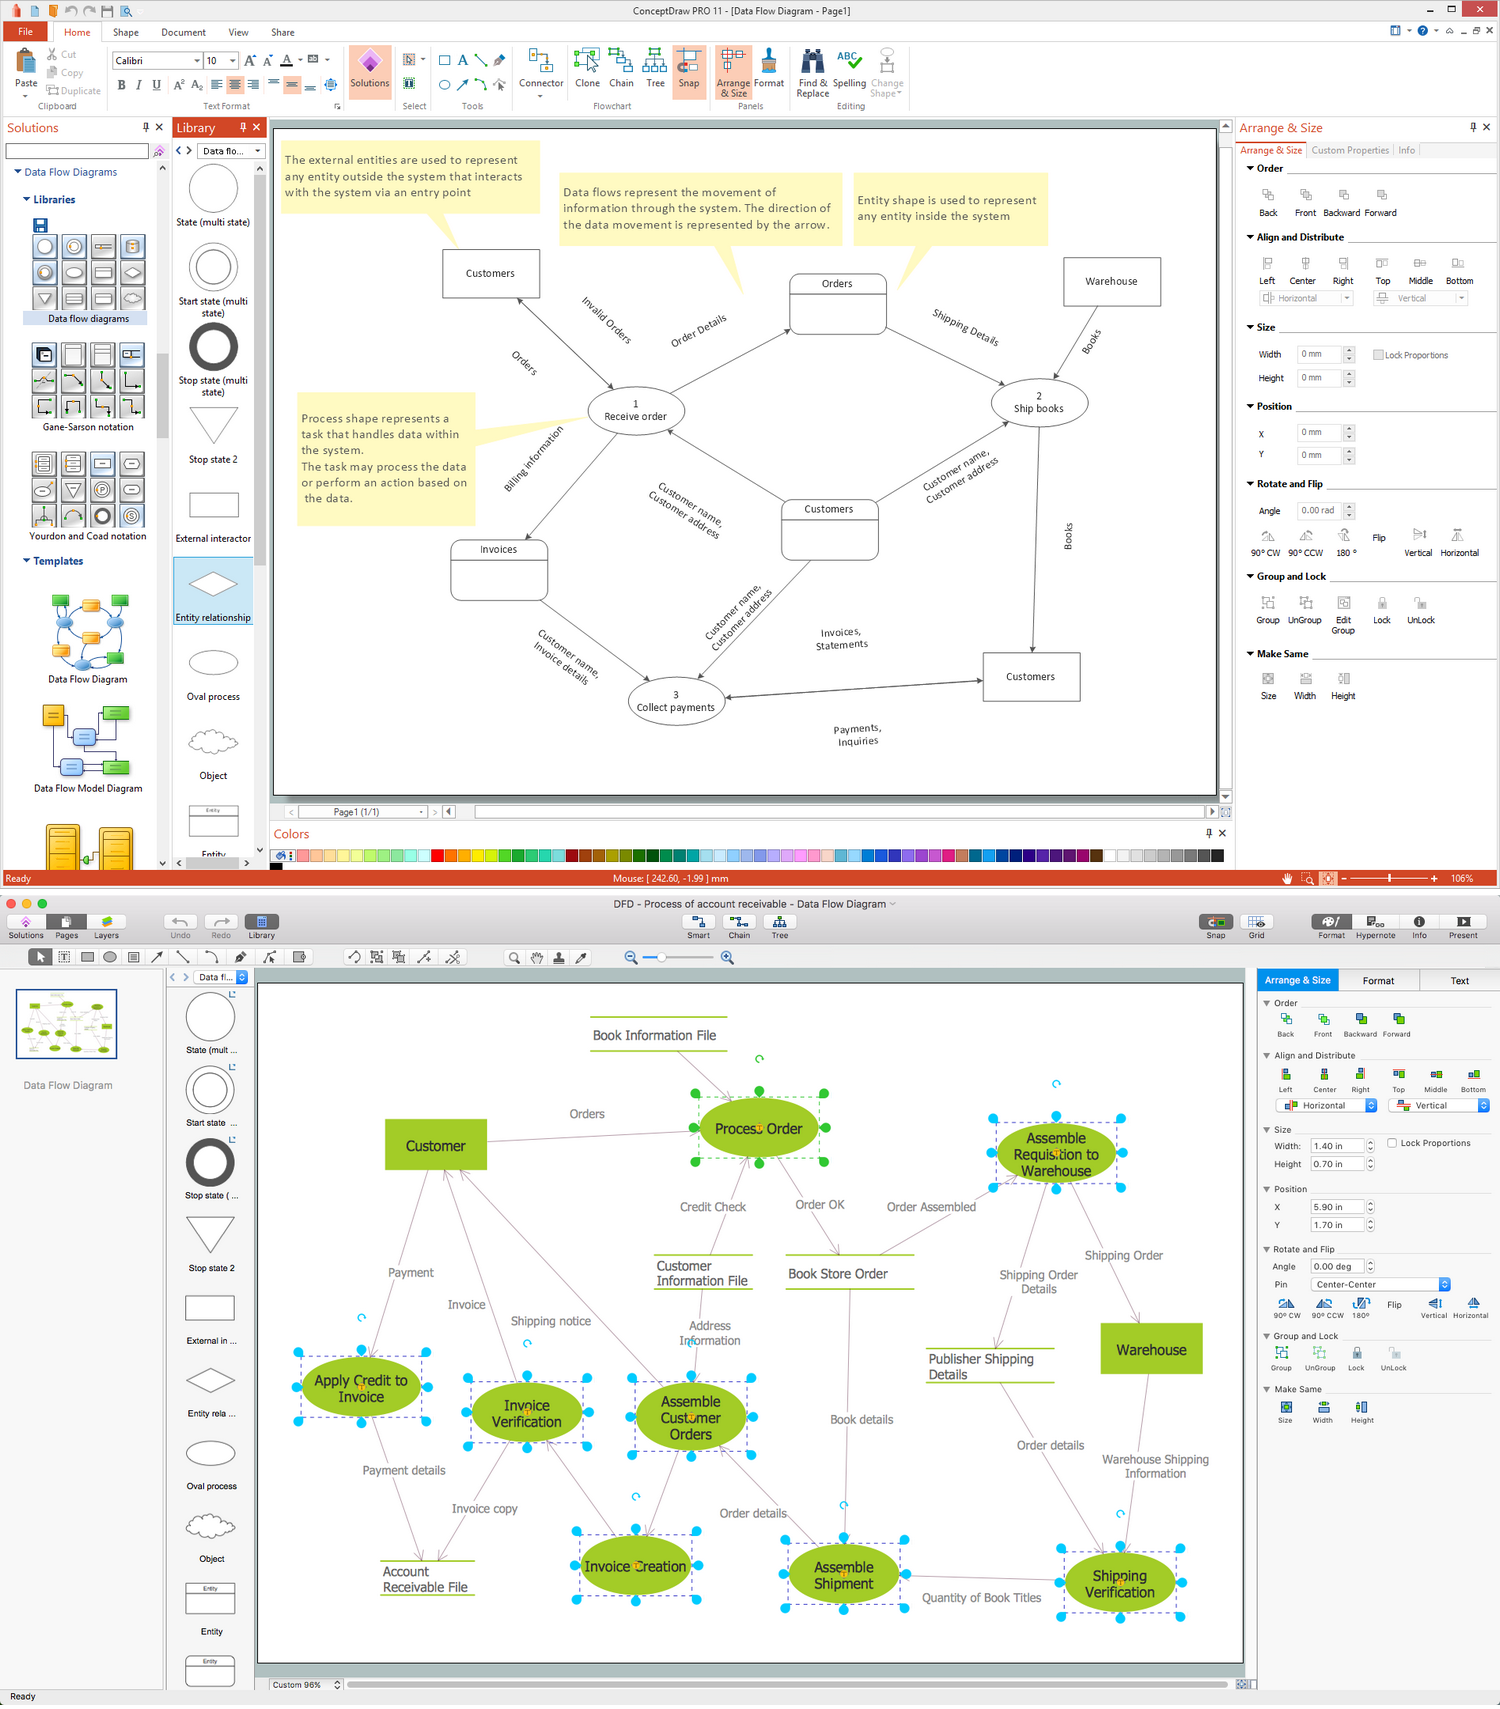
Picture: Data Flow Diagram Symbols. DFD Library
Related Solution:
ConceptDraw DIAGRAM diagramming software provides vector shapes and connector tools for quick and easy drawing diagrams for business, technology, science and education.
Use ConceptDraw DIAGRAM enhanced with solutions from ConceptDraw Solution Park to create diagrams to present and explain structures, process flows, logical relationships, networks, design schemes and other visually organized information and knowledge.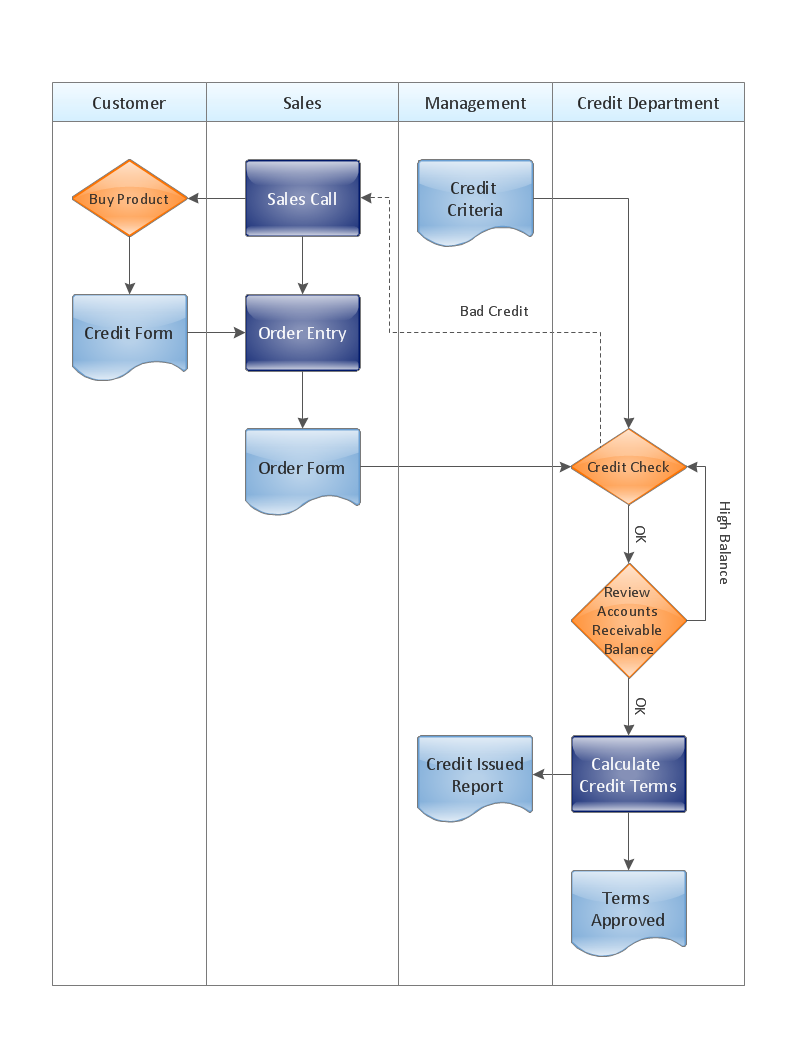
Picture: Cross-Functional Flowchart - The easiest way to draw crossfunctional
Sometimes it's difficult to find a path in work processes or to understand the requirements, especially when you are a newcomer. To get your thoughts straight, create a workflow diagram, and put everything on it. This will not only help you to get into the workflow, but also show it’s weaknesses.
This illustration captures the workflow process of payment an invoice for the electricity consumed by certain enterprise. It was drawn in ConceptDraw DIAGRAM using its solution for Workflow Diagrams. Making a workflow charts means that you need to depict consistently all processes engaged to the workflow process. Then, you should connect them with symbols meaning study and analysis. Next, add symbols of decisions. A work flow diagram made precisely and correctly can help to clarify your work flow to any person.
Picture: Workflow Diagram
Related Solution:
Looking for a professional flow chart creator? Learn what a flowchart creator is, see real examples, explore symbol libraries and templates, and follow a step-by-step guide to create flowcharts in ConceptDraw DIAGRAM with the Flowcharts Solution.
Picture: Flow Chart Creator
Related Solution:
ConceptDraw software has been developed for drawing any type of flowchart. Use RapidDraw - thi is flowchart maker technology for adding new objects to a flowchart quickly. This is technology of fast drawing technique focused on making great-looking flowcharts quickly. To get started using it download flowchart maker ConceptDraw DIAGRAM.
Picture: Flowchart Program Mac
Related Solution:
Using the Business Diagrams Solution you can create your own professional-looking Venn Diagrams quick and easy.
Picture: 3 Circle Venn Diagram. Venn Diagram Example
Related Solution:
DataBase icons - Amazon AWS pro diagrams - AWS diagrams are part of architecturing tools provided with ConceptDraw Solution Park.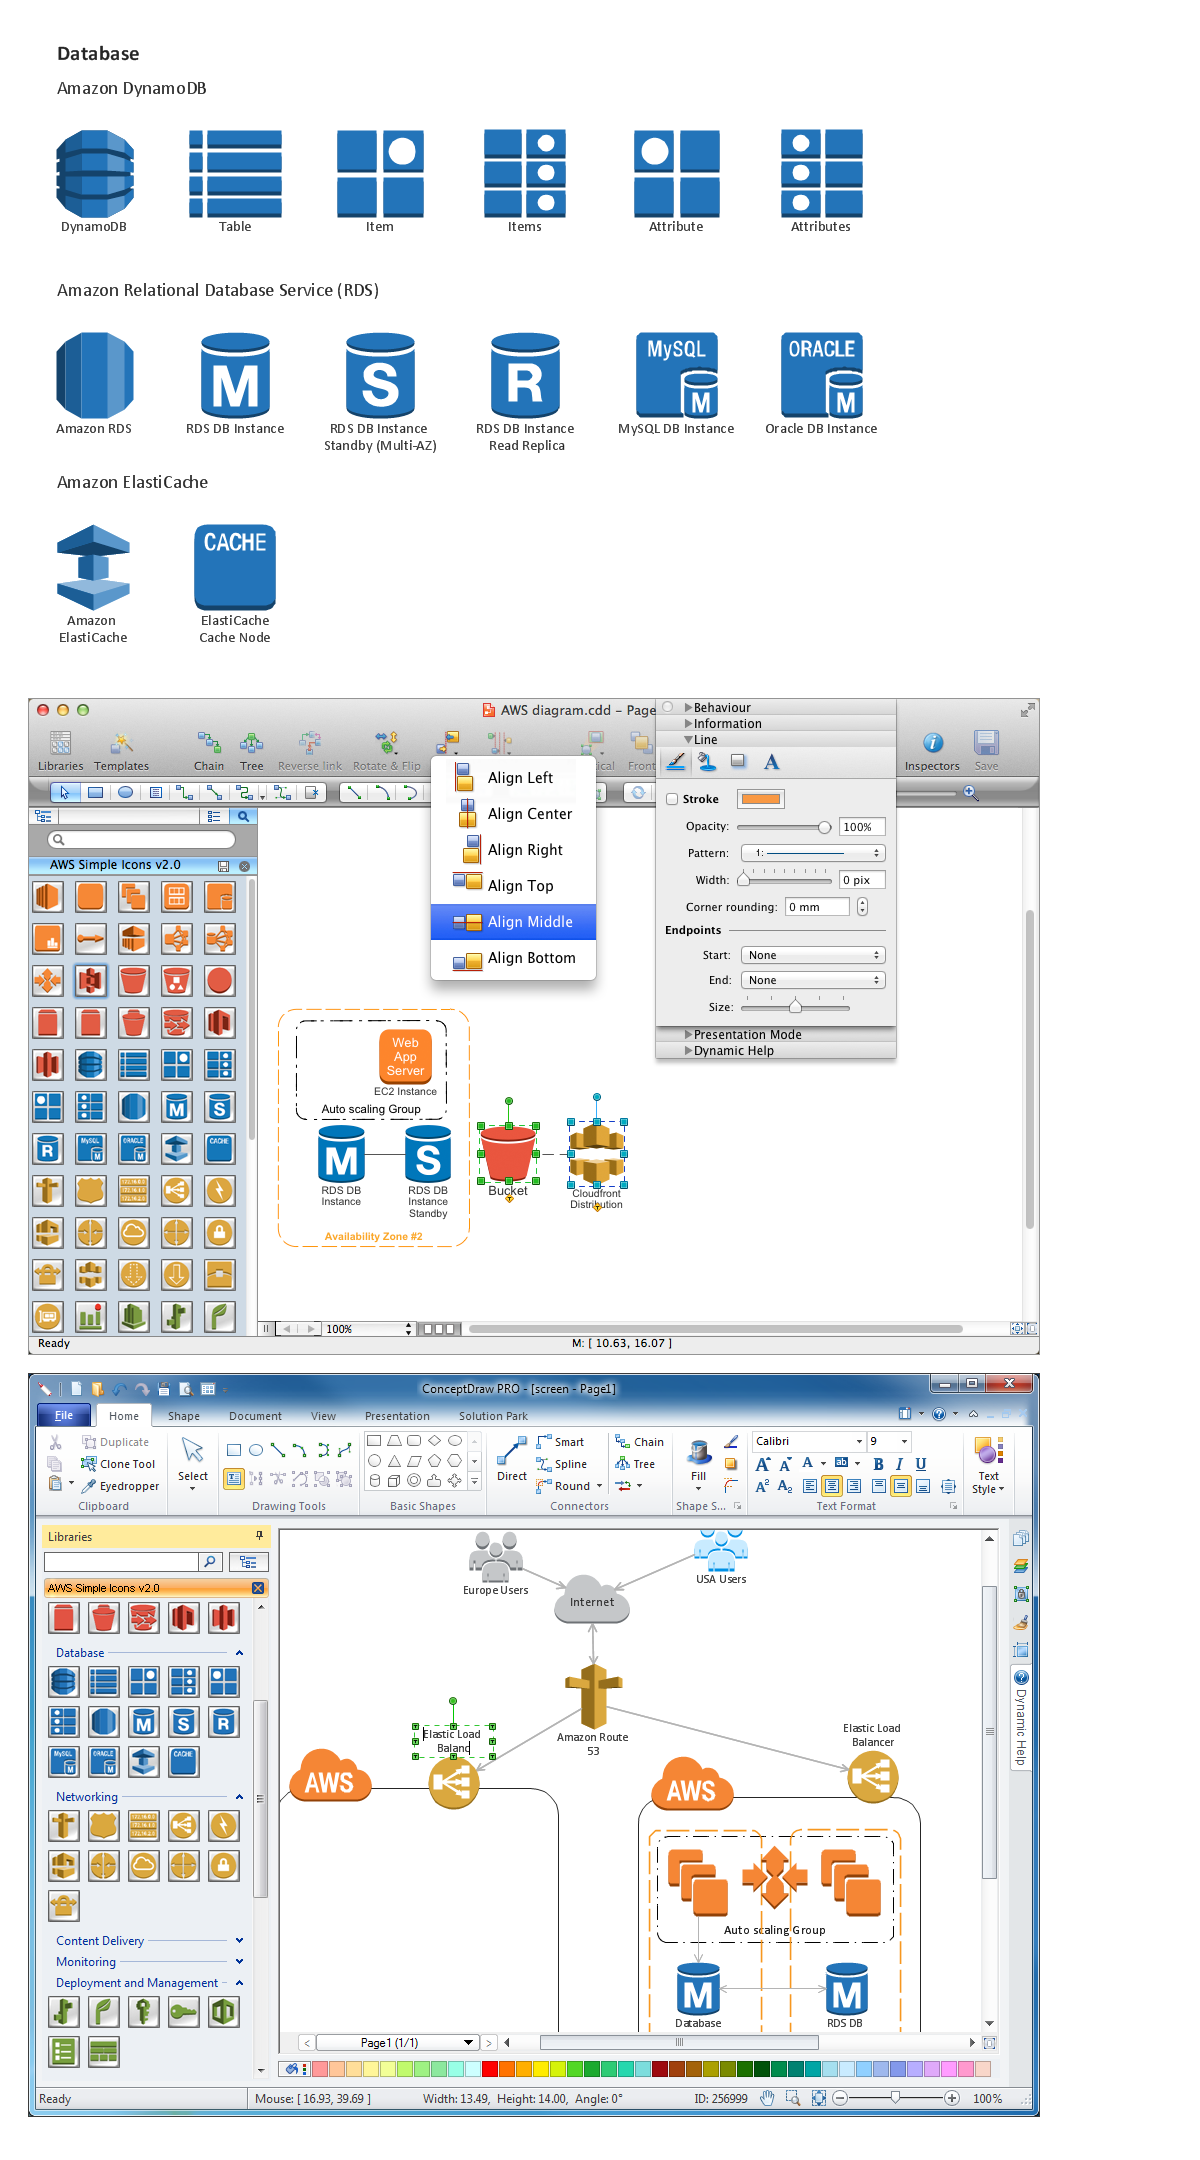
Picture: Diagramming software for Amazon Web Service icon set: Data Base
ConceptDraw gives the ability to draw Flowchart documents. Flowcharts solutionis a powerful tool that extends ConceptDraw application for drawing business flowcharts.
ConceptDraw DIAGRAM vector diagramming and business graphics software enhanced with with templates, green and interactive flowchart makers, samples and stencil libraries from ConceptDraw Solution Park which all focused to help with drawing flowcharts, block diagrams, bar charts, histograms, pie charts, divided bar diagrams, line graphs, area charts, scatter plots, circular arrows diagrams, Venn diagrams, bubble diagrams, concept maps, and others.
Picture: The Best Flowchart Software Available
Related Solution:
The growth–share matrix (BCG Matrix) was created by Bruce D. Henderson for the Boston Consulting Group in 1970 to help corporations to analyze their business units and to help the company allocate resources. How is it easy design the BCG Matrices in ConceptDraw DIAGRAM diagramming and vector drawing software supplied with unique Matrices Solution from the Marketing Area of ConceptDraw Solution Park.
Picture: BCG Matrix
Related Solution:
