Create Flow Chart on Mac: The Comprehensive Guide
A Flowchart is a commonly used type of chart that describes an algorithm, process, or workflow. It applies the boxes of various kinds to represent the steps and connects them with arrows showing their order. The Flowcharts help to understand the processes, visualize the process steps, and effectively find the flaws and bottlenecks. There are many types of Flowcharts, such as Cross-Functional Flowcharts, Data Flow Diagrams, Swimlane Flowcharts, Workflow Diagrams, Business Process Diagrams, Process Flowcharts, etc.
In terms of designing, documenting, managing, and analyzing complex processes, representing process operations, showing the steps of some processes or a diagrammatic representation of a solution to a given problem, or helping to visualize some process as well as to understand it, we recommend drawing Flowcharts which will become a clear explanation of all needed elements for those who these Flowcharts are being created for. And for making such Flowcharts you definitely need a good, smart, and professional application. But times when you had difficulties in searching for an appropriate software depending on your OS, had passed. If you are still looking for great software to create Flowcharts, no matter on Mac or Windows, here is the answer. ConceptDraw DIAGRAM software with tons of samples, libraries, and tutorials is a powerful software used to create diagrams and Flowcharts both on Mac and Windows without effort. The Flowcharts solution from the Diagrams area of ConceptDraw Solution Park and ConceptDraw Rapid Draw functionality are greatly effective tools for designing various types of Flowcharts for business processes.
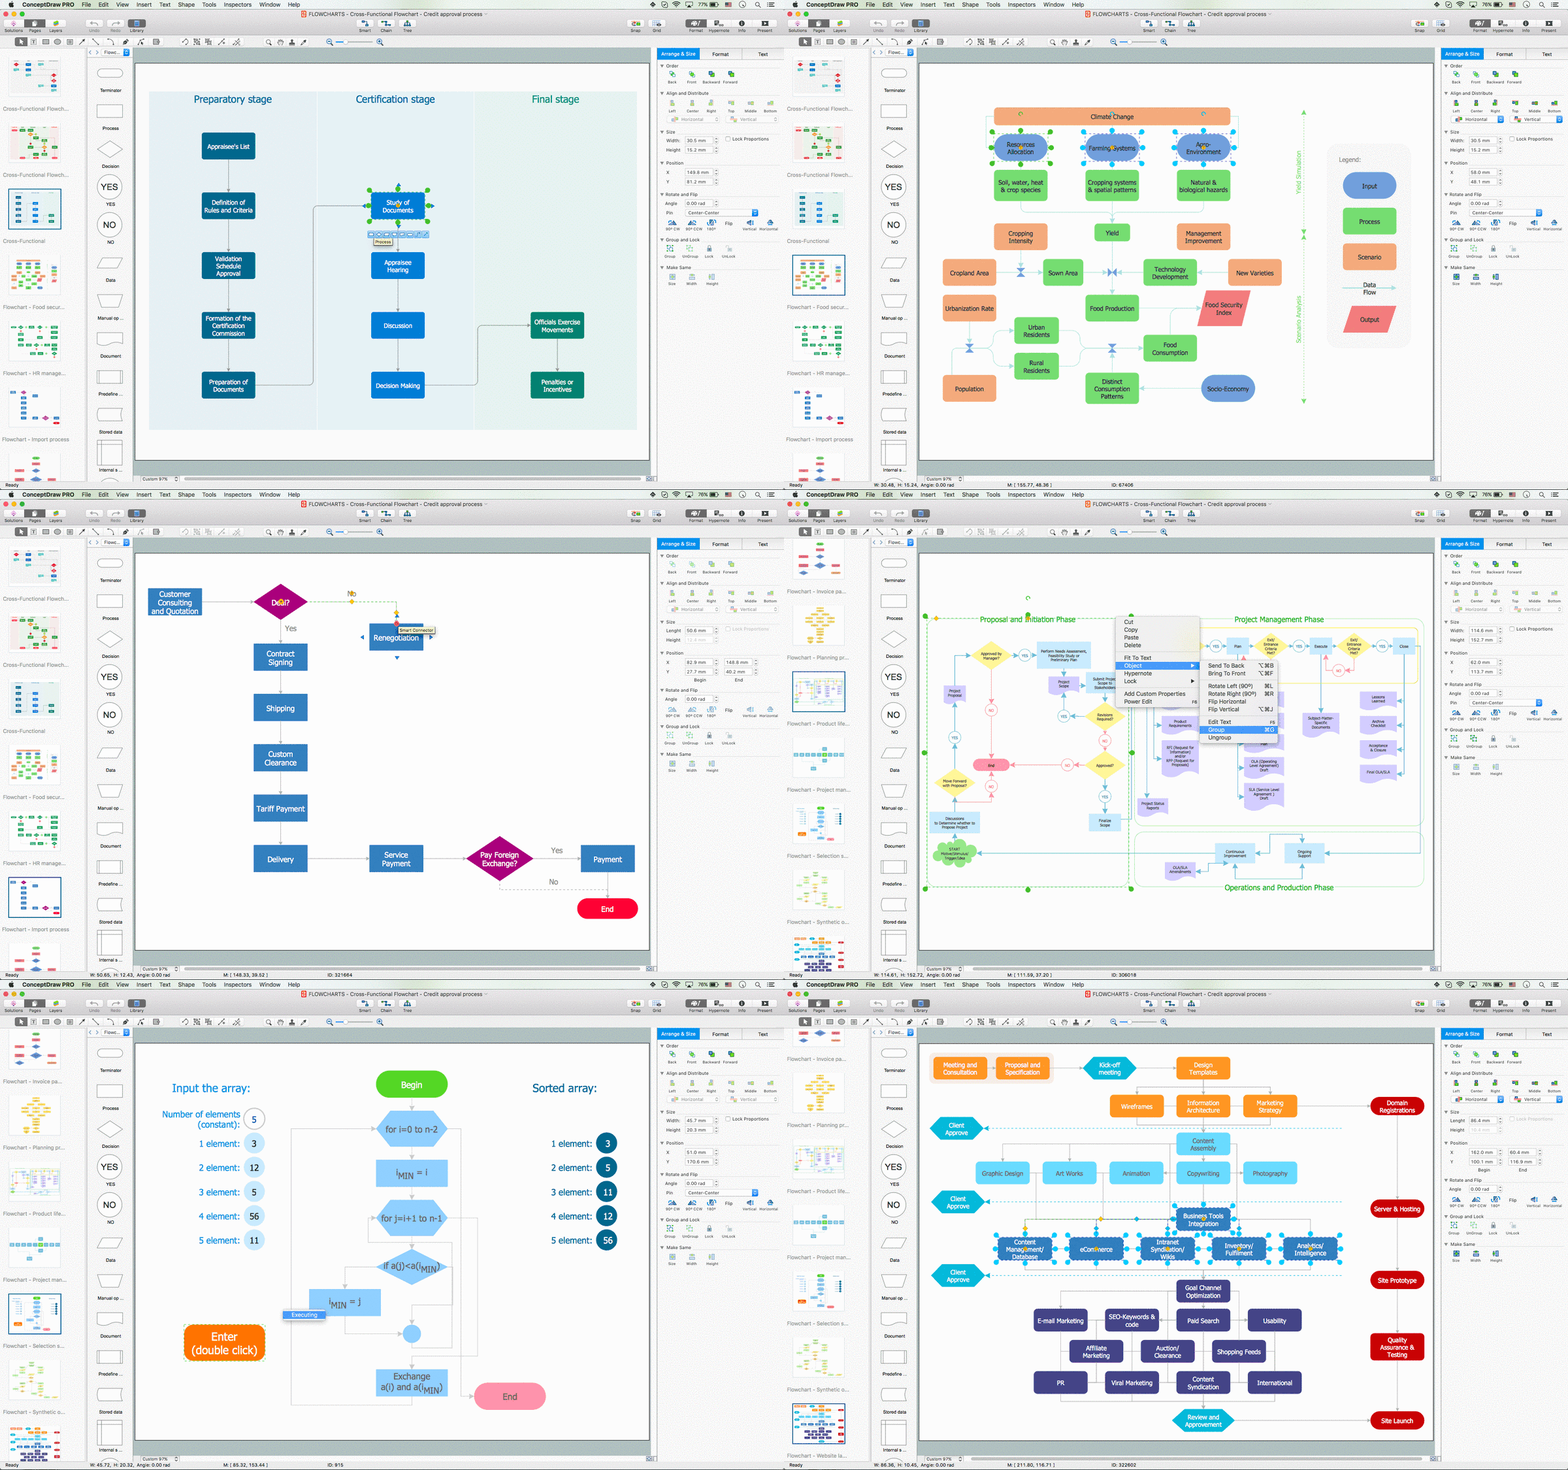
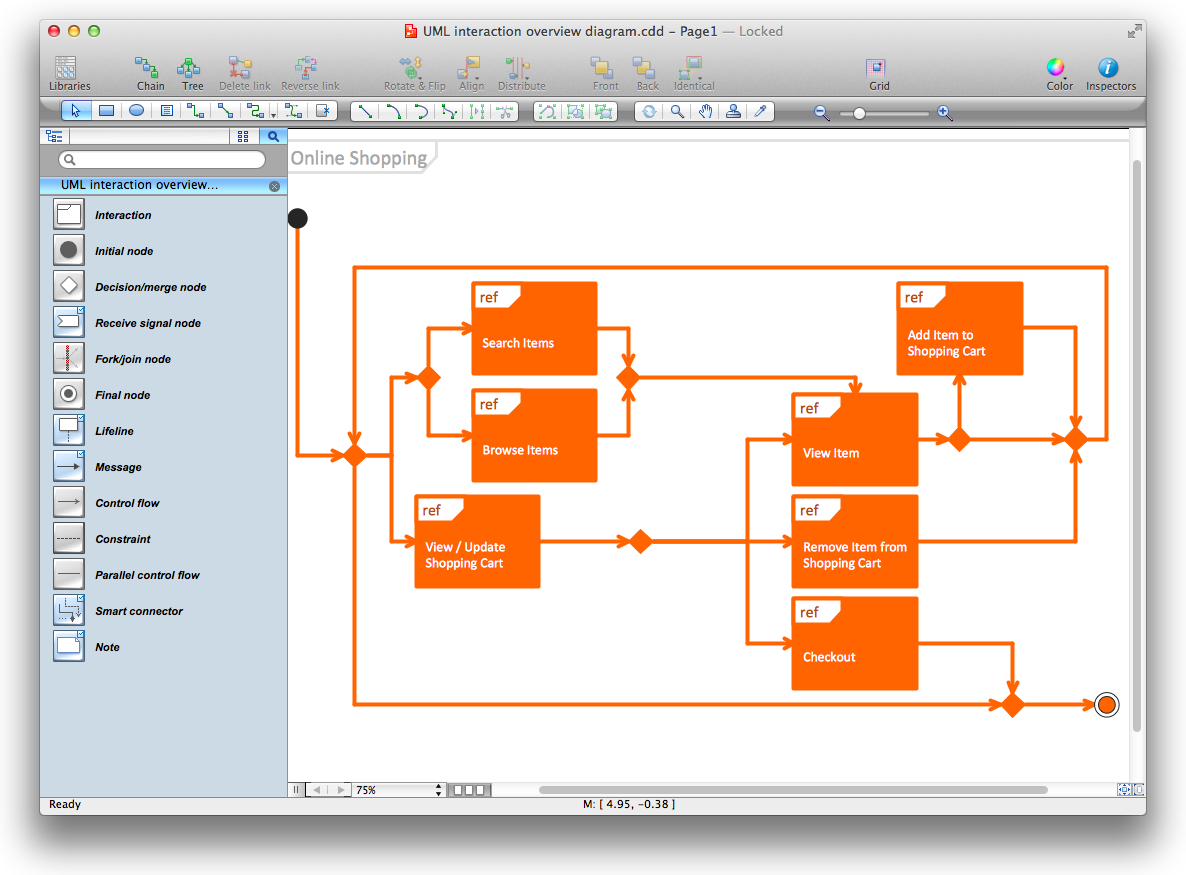
Example 1. Flowchart Creator Mac — ConceptDraw DIAGRAM Software
Flowchart Benefits
If you wonder why to be bothered creating charts if you can simply insert any needed text into your presentation, then it’s important to remember that visual representation of the same data is always easier to understand and that having charts in your business documents can simplify the understanding of the large quantities of data and so the relationships between different parts of this data. Thus, charts can usually be read and understood more quickly than the complex flow tree, that’s why they are used in a wide variety of activities.
ConceptDraw DIAGRAM software helps you to analyze, design, document, manage, represent, visualize, and understand the complex processes of some working system and to systematize its work, create diagram, and make sure that everything works very well and the elements are there where they should be, in their places.
Best Practices to Simplify Flowchart Creation on Mac
At the same time, ConceptDraw DIAGRAM flowchart app for Mac is more than a Flowchart design software. If you are looking for software, that can be an appropriate one for creating both your charts and your maps, in this case, ConceptDraw DIAGRAM is also for you. It is a software, which you can use as a smart and useful tool for drawing all variety of charts and maps, as well as flowcharts, diagrams, schemes, plans, and other simply great-looking models.
Having a classic diagram maker Mac ConceptDraw DIAGRAM means having a huge range of many different tools, such as design symbols and examples, which all can be found in ConceptDraw Solution Park — samples, templates, and design elements. If your work requires creating Flowcharts, which are basically the types of diagrams, representing some particular algorithm, process, or workflow, showing the steps in a way of the boxes of various shapes connected with the numerous arrows, then the best Mac flowchart software ConceptDraw DIAGRAM is an excellent process flow visualization tool. Thus, you can always create Flowchart Mac or Process Flow Diagram showing the arrows illustrating the flow of material as well as symbols, such as valves, tanks, and other equipment, which are all available for your use in the libraries from the solutions.
The kinds of business activity, where the Flowcharts may need to be created, can include such processes, as analyzing, designing, documenting, managing, representing, and showing the steps, representing the solutions to a given problem in visual form, representing the process operations, visualizing processes in order to help to understand them.
ConceptDraw DIAGRAM macOS Software
It is very simple to start creating your own charts, flowcharts, or diagrams with ConceptDraw DIAGRAM Windows and Mac OS Flowchart software. Having it and using the pre-made examples as your drafts you will accomplish great results within a very short period of time. ConceptDraw DIAGRAM application is known to be a great alternative to MS Visio for Mac and one of the best diagram tool for Mac to visualize any structural data fast and easy using the vector stencils from the stencil libraries and the so-called “RapidDraw technology”.
Cross-Functional Flowcharts
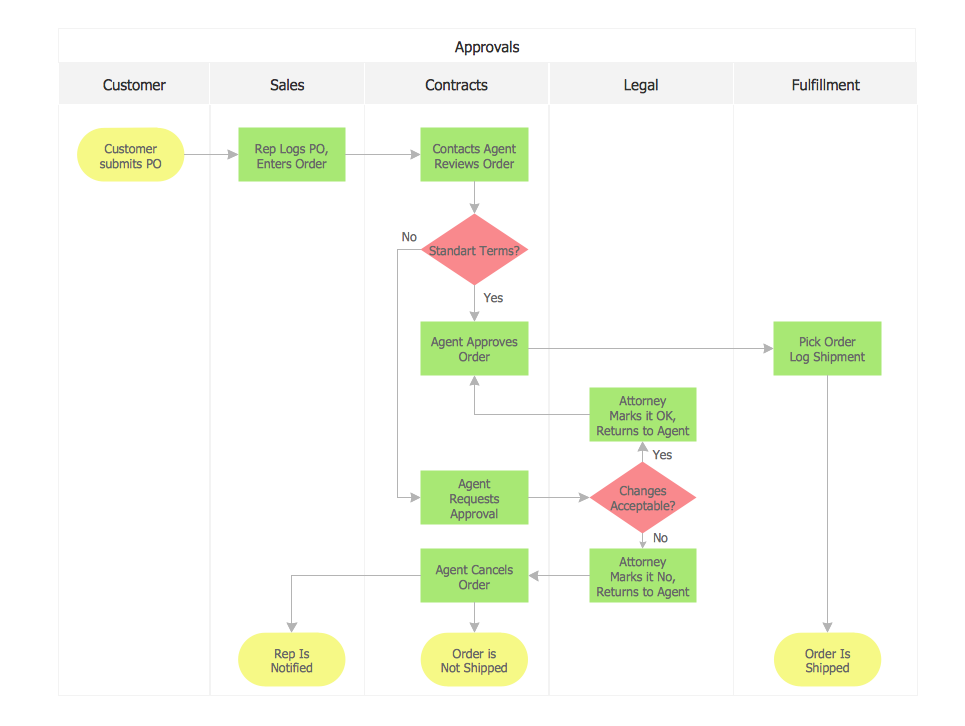
There are many different flowchart types, you can create in ConceptDraw DIAGRAM flow diagram software Mac OS, as for example Cross-functional flowcharts that are used to describe a process where different people are involved in, as well as at least a few departments or other functional areas. As it’s known it can be sometimes difficult to keep track of who is responsible for each step of the business process and who is in charge of the final result. Dividing such a Flowchart into columns can be useful for analyzing the number of times this process was “handed over” to different people.
Process flow diagrams can be used to present the relationships with components in the drawings, while Cross-functional flowcharts are usually used to show the relationship between a business process and the functional units (e.g., departments) responsible for that process. To be able to make such a Flowchart, it is always better to use ConceptDraw DIAGRAM Cross Functional Flowchart software that allows visualizing as well as communicating the operations of some business process flow step by step, mentioning all responsible departments or people in particular for each operation.
Cross-functional flowcharts can be created horizontally and vertically. In a vertical layout, the bands represent the functional units that run vertically (from the top to the bottom of the page), highlighting all the functional units. In a horizontal layout, the bands represent all functional units running horizontally across the drawing page, highlighting the process itself. Any Cross-functional diagram, displaying the workflow as well as the functional positions, helps to mention who exactly is involved with each of the steps in the workflow.
Any type of such Cross-functional flowchart can be made for only a few minutes using ConceptDraw DIAGRAM Mac flowchart software as well as “top-down flowcharts”, “block diagrams” (also known as a “decision tree” or “logic diagram”), “flow process chart”, “workflow diagrams”, “process maps”, “state change charts”, and other. Thus, you can always make any of the mentioned above charts, as well as many other Flowcharts, with the help of ConceptDraw DIAGRAM and ConceptDraw STORE application, full of the so-called “solutions”, containing the stencil libraries and the pre-made examples of any needed drawings.
Using Samples to Create a Flowchart on Mac
To be able to draw a Flowchart in a very short period of time, you can use our samples as well as many libraries full of design elements, which you can find in ConceptDraw STORE and ConceptDraw DIAGRAM application. It will appear to be your best assistant and counselor as it is very simple to use, and having these examples will definitely simplify your work and so your life. Try the genius software on your Mac and make sure you will not be disappointed, but you’ll recommend it to all of your friends, colleagues, and partners.
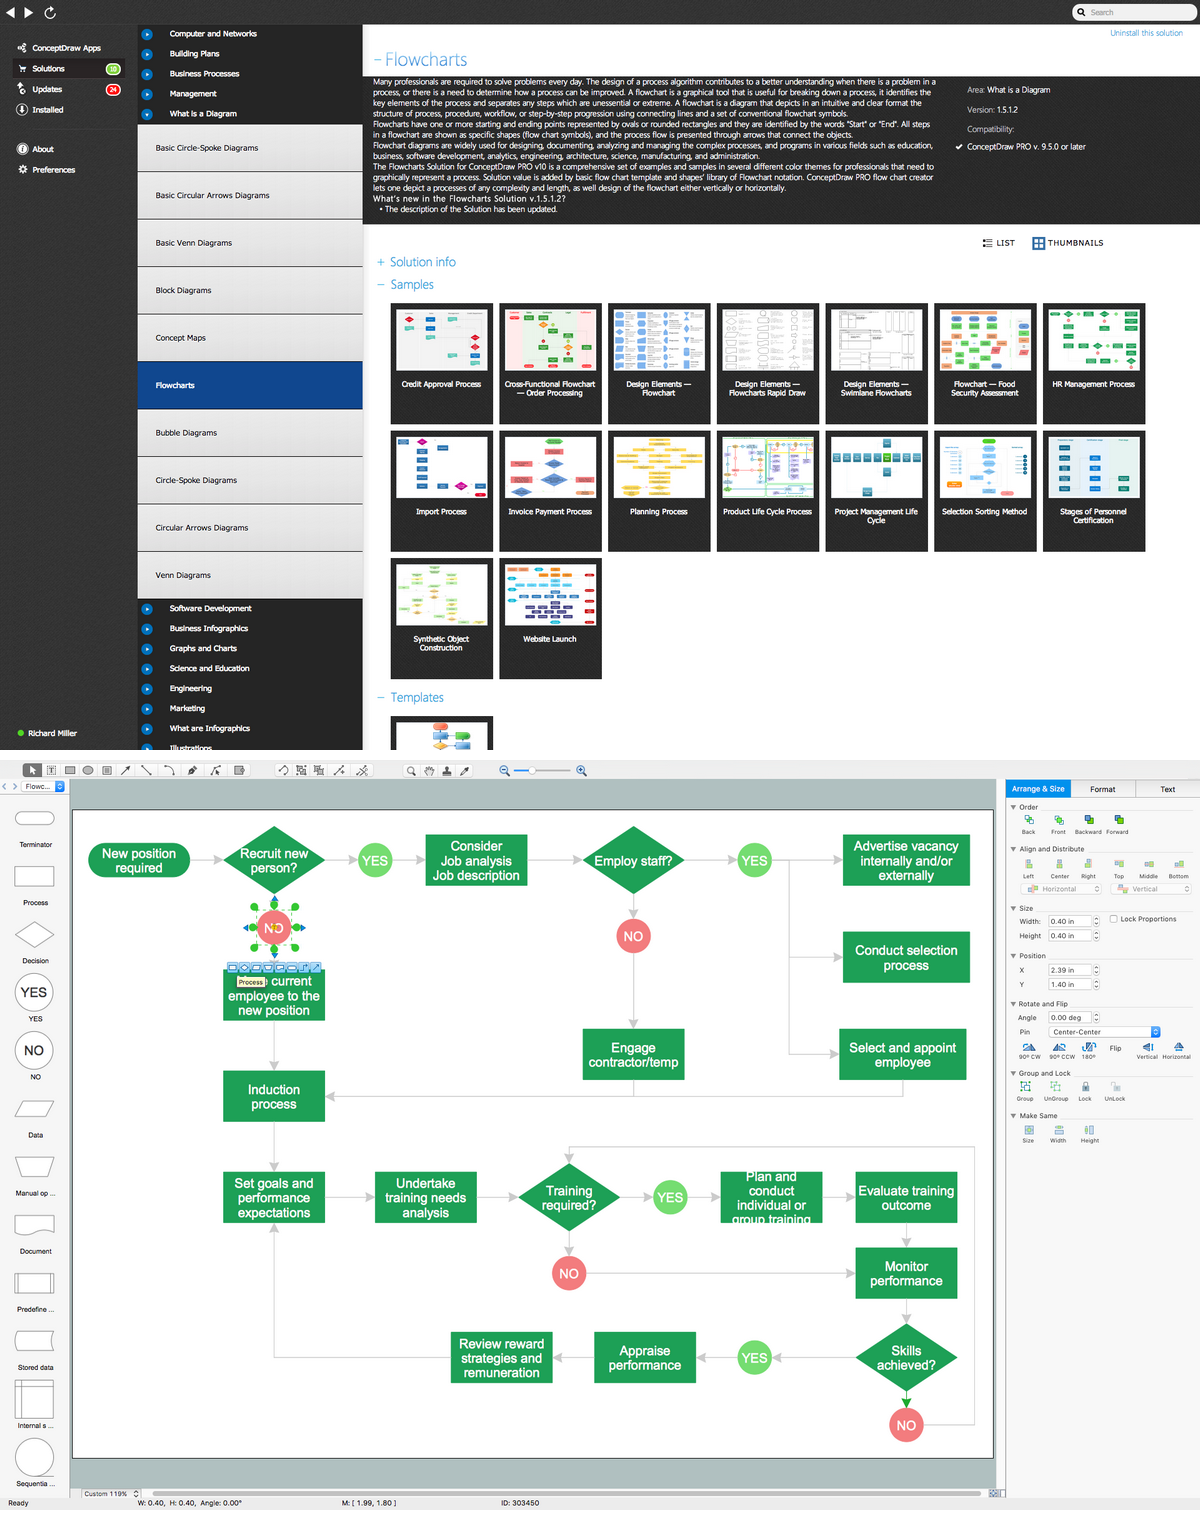
Example 2. Flow Chart on Mac — HR Management Process
The Flow chart example "HR management process" was created using the ConceptDraw DIAGRAM Flowchart Maker Mac, the vector drawing software extended with the Flowcharts solution from the Diagrams area of ConceptDraw STORE also using green flowchart making technique of Rapid Draw technology.
Conclusion
If you are looking for the best professional Mac flowchart software, then now you know which one to download. ConceptDraw DIAGRAM is a diagramming software commonly used for creating Flow charts both on Windows and Mac. Things are much simpler for you as this application allows using its pre-made examples and templates as well as many stencil elements in order to draw great-looking, smart, and professional charts as well as Flowcharts, schemes, diagrams, and plans fast and simply.
Start creating your own diagrams with ConceptDraw DIAGRAM and accomplish great results in just a few minutes. It is the best professional Mac OS flowchart software that gives users the ability to draw any type of Flowchart simply. ConceptDraw DIAGRAM Mac diagram software also supports popular Apple OS X features such as Quick Look, Full-Screen Mode, Version Browsing and Autosave. You can export your one and multi-page diagrams to SVG or graphic formats such as TIFF, JPEG, PNG, and PDF.