Draw Fishbone Diagram on MAC Software
There’s a great quantity of different diagrams you can make using only one software — ConceptDraw DIAGRAM Diagram is known to be a symbolic representation of information according to some so called “visualization techniques”. Diagrams have been used since the ancient times, becoming more and more popular each year as there allow people to understand the large amount of data much quickly than a simple text. Diagrams are also known as “graphs”, but the most common term “diagram” can have both a general or a specific meaning. Thus, a diagram can be understood as a specific kind of visual display, showing the qualitative data with shapes, which are connected with help of arrows, lines and other visual links. The diagram can be treated as a visual information device, which can be used as a collective term standing for the technical genres, such as tables, graphs as well as different technical drawings.
In science diagrams are known to be the pictorial and abstract representations of information: line graphs, engineering blueprints, maps, and architects’ sketches, sometimes even consisting of a few photographs. In computer graphics, diagrams are known to be the abstract, not so much literal, representations of some data, including such terms as maps, infographics, technical illustrations and technical drawings. In this case the diagrams are known to be the displays of the relationships and abstract information, not so much of a quantitative data, which is also known as “numerical” one. So, in computer graphics, diagrams are treated as one of the forms of simply visual formatting devices.
Within each diagrams there are at least a few so called “building blocks”, which are as simple as that — the geometrical shapes, that are connected with help of lines or some other visual links, such as arrows. Another meaning for the term of a “diagram” is that it is a simplified figure, caricatured in a way intended to convey the essential meaning of some data. The mentioned simplified figures can be based on a set of rules, such as a use of a particular basic shape.
One of the most used types of diagrams is so called “Ishikawa” ones, known also as “fishbone diagrams” or “herringbone diagrams”. These diagrams are also known as “cause-and-effect” ones as they can be used for representing the cause and so the effect of some feature, influencing on the final data. “Ishikawa” or “fishikawa” diagrams are simply the causal diagrams, “invented” by Kaoru Ishikawa, that’s why they have such a name. They were for the first time created in 1968, showing the causes of some specific event and still, nowadays, they are very popular for product designing as well as quality defect prevention for identifying the potential factors causing some unexpected overall effect. Each cause for imperfection is a source of variation and the causes are usually grouped into the bigger categories for their identification as well as classification of these sources of variation.
The mentioned “effect” within the “cause-and-effect” diagram is shown as the fish's head, usually facing to the right. And the “causes” all extend to the left as its bones, “fishbones”. The ribs branch off the backbone for the major causes, having the sub-branches for root-causes to as many levels as you want to mention on your diagram. Having ConceptDraw DIAGRAM software means enabling yourself to create a great looking “fishbone” diagram within only a couple of minutes having the needed solution from ConceptDraw STORE — application, developed to be used while working in ConceptDraw DIAGRAM software providing the needed tools, such as pre-made examples of fishbone diagram as well as the stencil libraries full of design elements, which also can be used for your professionally looking drawings.
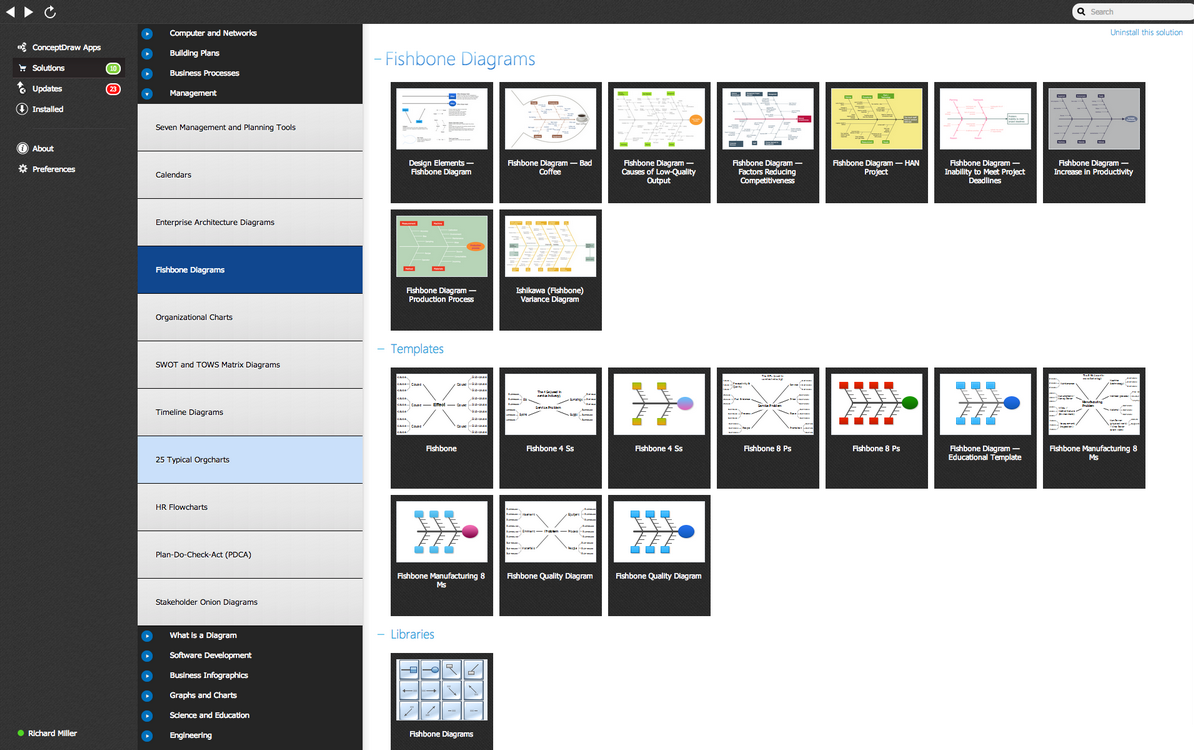
Example 1. Fishbone Diagrams Solution
The quality management processes can be easily simplifies with the “fishbone” diagrams usage, being used as a great tool in modern management. A fish skeleton is one of the best structures to be used for representing the needed data and such diagrams can be also used in the root-cause analysis, which is intended to reveal key relationships among the various variables. The possible causes within such analysis provide the additional insight into the process behaviour, which can be all illustrated within one diagram — “fishbone” one — in a way of grouping such causes into categories on the main branches off the fishbone.
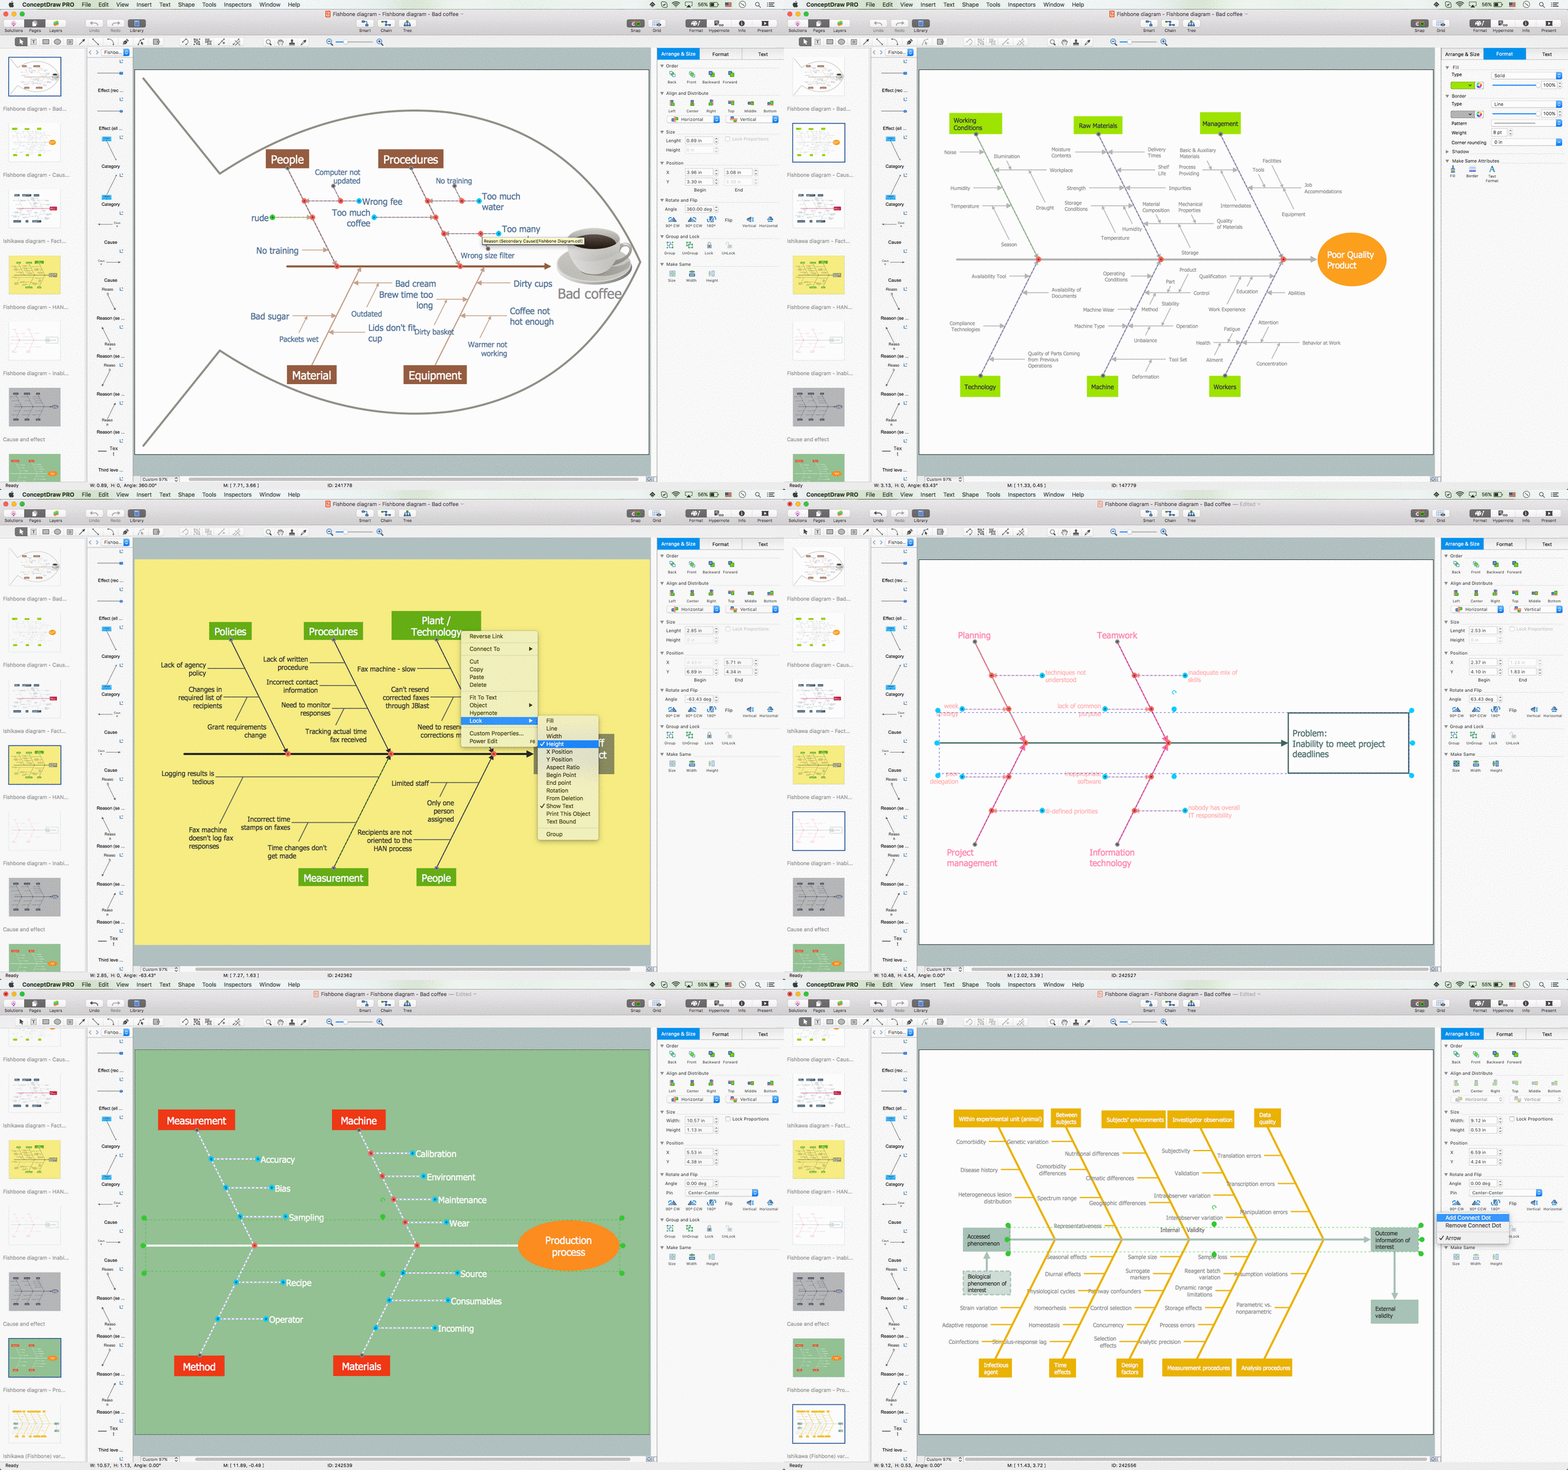
Example 2. Draw Fishbone Diagrams on MAC Software
Within the mentioned “root-cause analysis” the categories for the Ishikawa diagram can be used for identifying the crucial attributes for planning in product marketing, such as “product” (or “service”), “price”, “promotion”, “place”, “process”, “people” (“personnel”), “physical evidence” and “performance”. The four categories of possible cause can look like: “surroundings”, “suppliers”, “systems” and “skills”. All of these categories can be illustrated within one diagram, using ConceptDraw DIAGRAM software and so the Fishbone diagrams solution, which was designed especially for ConceptDraw DIAGRAM users to give them a wide range of the opportunities for passing all 5 drawing steps with and ease and so to draw any needed “Fishbone diagram” using the ConceptDraw DIAGRAM software on Mac getting the final smart looking result only within a couple of hours or even minutes, which depends on how good they are with the previously mentioned software.
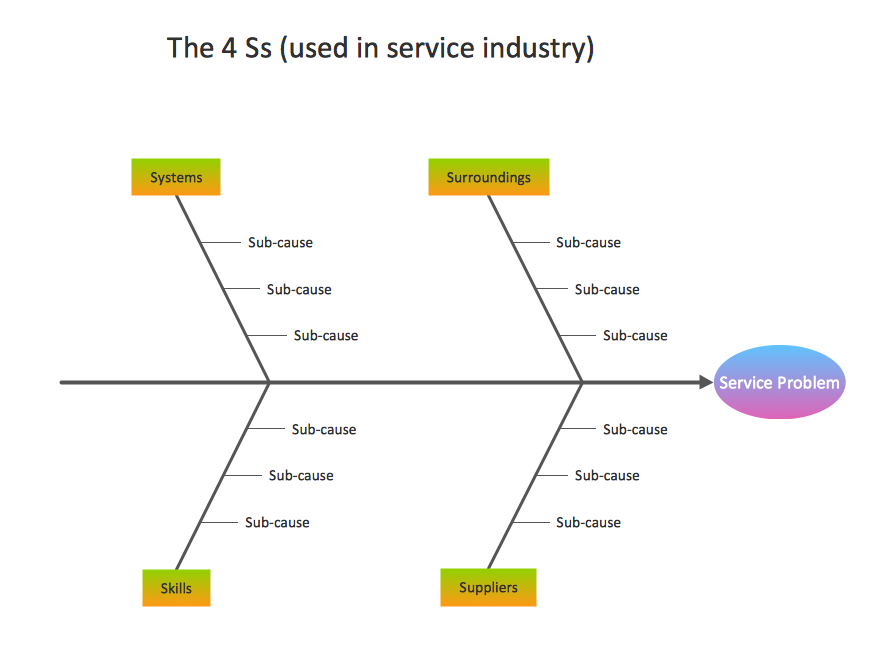
Example 3. Fishbone Diagram Template — Service 4 Ss
To be able to create a Fishbone Diagram, which can be used in so many different spheres of business activity, you can simply create a new document in ConceptDraw DIAGRAM application, then drag the needed objects from the “Fishbone Diagrams library” from the “Fishbone diagrams solution”, which can be found and downloaded from both this site and ConceptDraw STORE, and arrange them the way you want them to look like, typing the text labels, colouring its parts brightly and stylishing your Fishbone Diagram the way to make it simply professionally-looking.
The professional diagramming tool — ConceptDraw DIAGRAM MAC OSX software extended with “Fishbone Diagrams solution” — can help you to make any needed “cause and effect” analysis, identify the possible causes and effects for problem solving in a way of drawing the Fishbone diagrams on your Mac software.