
Example 1. Energy Pyramid Diagram
For easy drawing the Energy Pyramid Diagram, the Pyramid Diagrams Solution offers Pyramid Diagrams library, and large collection of predesigned templates and samples. You can find them all in ConceptDraw STORE and use as is or change for your needs.
The Pyramid Diagrams library contains large quantity of high-resolution vector objects. They are so various that you are able to create on their base the pyramid diagram of any style you want - 2D or 3D, oriented up or down, and with any number of levels.

Example 2. Pyramid Diagrams Library Design Elements
The Energy Pyramid Diagram you see on this page was created in ConceptDraw DIAGRAM software using the Pyramid Diagrams Solution. It is a classical view of Energy Pyramid Diagram. An experienced user spent 5 minutes creating it.
Use the Pyramid Diagrams Solution for ConceptDraw DIAGRAM software to create your own professional looking ecological and energy pyramids quick, easy and effective.
All source documents are vector graphic documents. They are available for reviewing, modifying, or converting to a variety of formats (PDF file, MS PowerPoint, MS Visio, and many other graphic formats) from the ConceptDraw STORE. The Pyramid Diagrams Solution is available for all ConceptDraw DIAGRAM or later users.
TEN RELATED HOW TO's:
The ConceptDraw Flowchart component includes a set of samples and templates. This geathered as flowchart maker toolbox which focused on drawing flowcharts of any industry standards.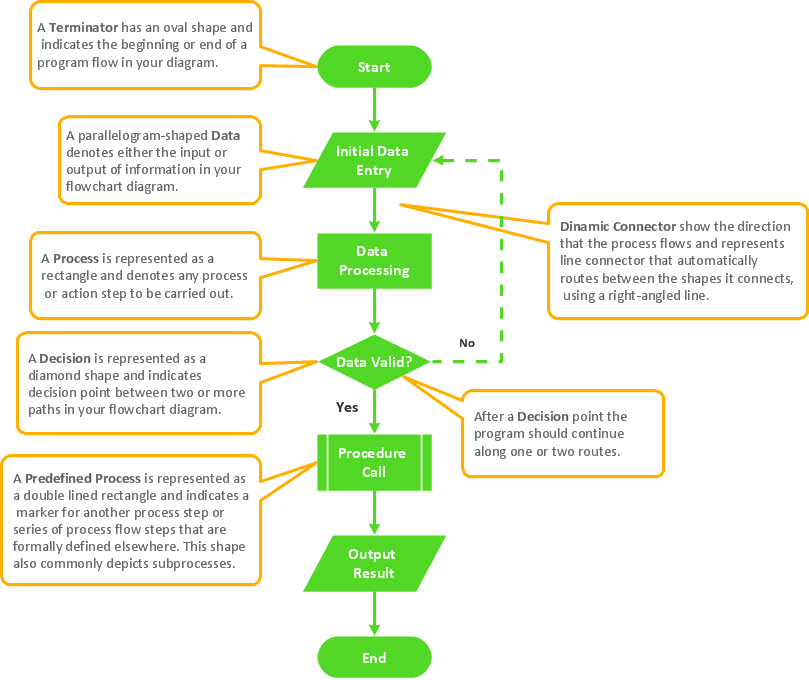
Picture: Flowchart Components
Related Solution:
Electrical rotating machines, such as motors and generators, are vital assets for any power plant or large industrial company.
An electric motor is an electrical machine that converts electrical energy into mechanical energy. The reverse of this would be the conversion of mechanical energy into electrical energy and is done by an electric generator.
In normal motoring mode, most electric motors operate through the interaction between an electric motor's magnetic field and winding currents to generate force within the motor. In certain applications, such as in the transportation industry with traction motors, electric motors can operate in both motoring and generating or braking modes to also produce electrical energy from mechanical energy.
26 libraries of the Electrical Engineering Solution of ConceptDraw DIAGRAM make your electrical diagramming simple, efficient, and effective. You can simply and quickly drop the ready-to-use objects from libraries into your document to create the electrical diagram.
Picture: Electrical Symbols — Rotating Equipment
Related Solution:
A lot of business process techniques are able to be applied in regular life. Although this tool is considered to be used for business purposes, you can make a SWOT template for yourself. In fact, any obstacle might become a subject for SWOT analysis.
ConceptDraw solution for SWOT analysis solution provides a power visual maintenance of a SWOT analysis. It is a procedure of strategic planning made to discover the Strengths, Weaknesses, Opportunities, and Threats business meet. This mind map template for ConceptDraw MINDMAP isually maintains investigation of good and bad factors. For example, factors that provides an advantage over others are strength; factors that brings a disadvantage are factors of weakness. After the analysis is finished, transfer your data to create a SWOT matrix in ConceptDraw DIAGRAM.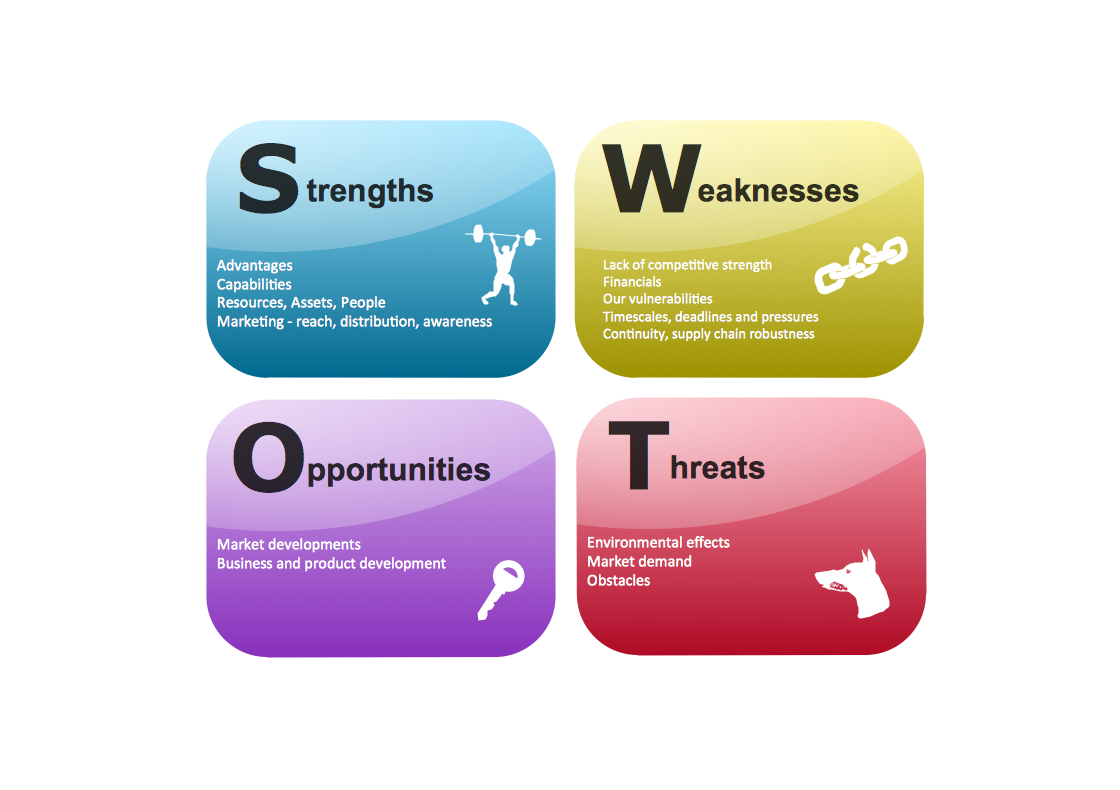
Picture: SWOT Template
ConceptDraw DIAGRAM is a powerful diagramming and vector drawing software which offers the extensive drawing tools for creating various types of diagrams. Extended with Pyramid Diagrams Solution from the Marketing Area, it became the best Pyramid Chart Maker.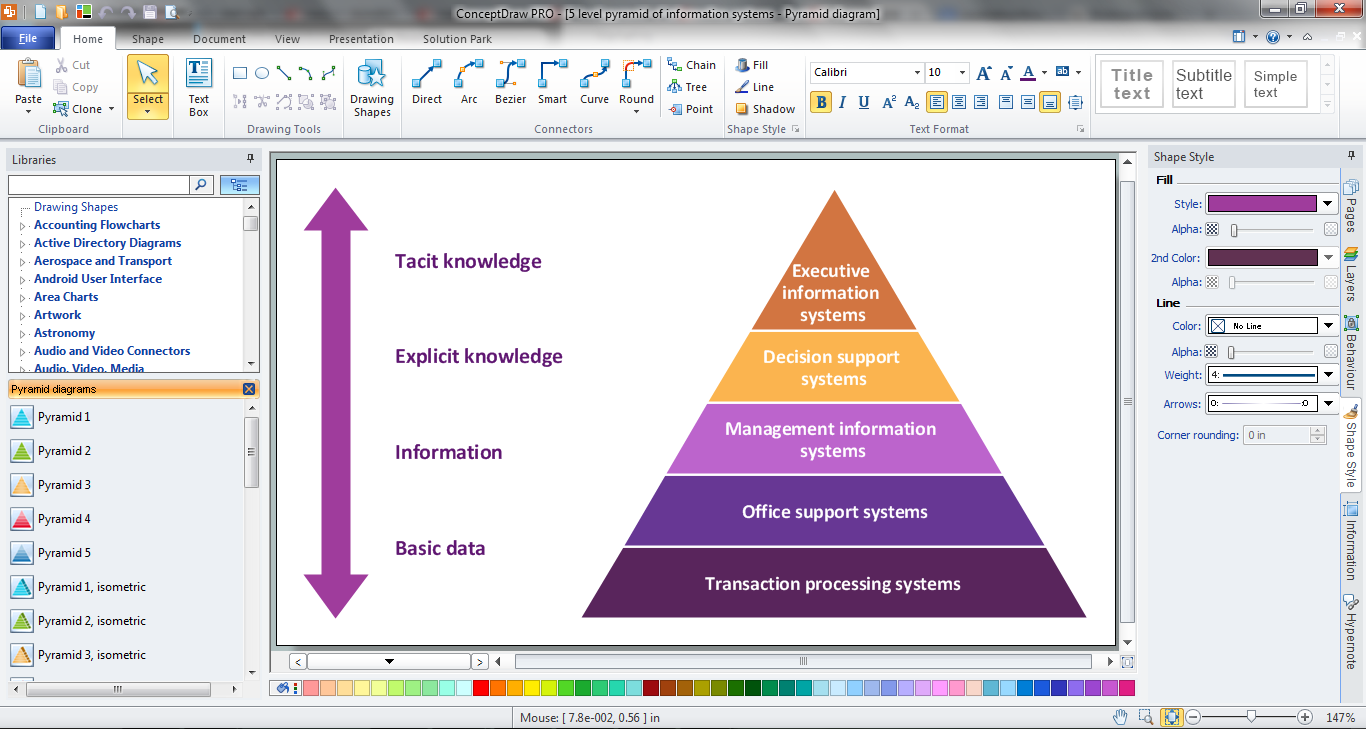
Picture: Pyramid Chart Maker
Related Solution:
Easy charting software comes with beautiful chart templates and examples. This makes it easy to create professional charts without prior experience.
Picture: Chart Templates
A voltage source is a two terminal device which can maintain a fixed voltage. An ideal voltage source can maintain the fixed voltage independent of the load resistance or the output current. However, a real-world voltage source cannot supply unlimited current. A voltage source is the dual of a current source. Real-world sources of electrical energy, such as batteries, generators, and power systems, can be modeled for analysis purposes as a combination of an ideal voltage source and additional combinations of impedance elements.
26 libraries of the Electrical Engineering Solution of ConceptDraw DIAGRAM make your electrical diagramming simple, efficient, and effective. You can simply and quickly drop the ready-to-use objects from libraries into your document to create the electrical diagram.
Picture: Electrical Symbols — Power Sources
Related Solution:
Simple tutorial help you learn how to draw a scatter chart and increase you possibilities of understanding and work more effective with our scatter chart software.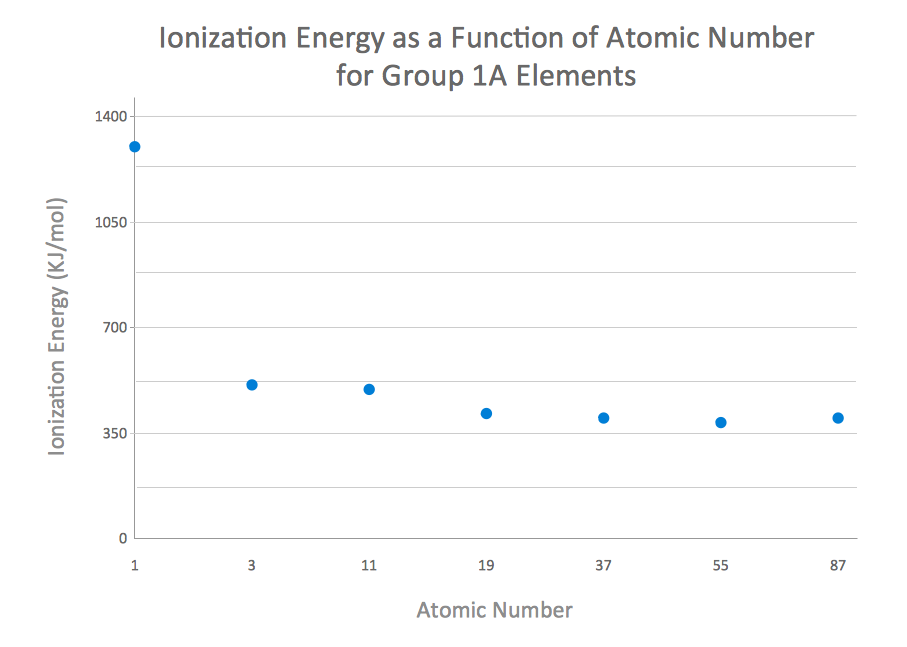
Picture: How to Create a Scatter Chart
Related Solution:
Pyramid chart example is included in the Pyramid Diagrams solution from Marketing area of ConceptDraw Solution Park.
Picture: Pyramid Diagram
Related Solutions:
Learn the most common process flowchart symbols used in business process diagrams and workflow charts. Includes symbol meanings, examples, and a practical reference table.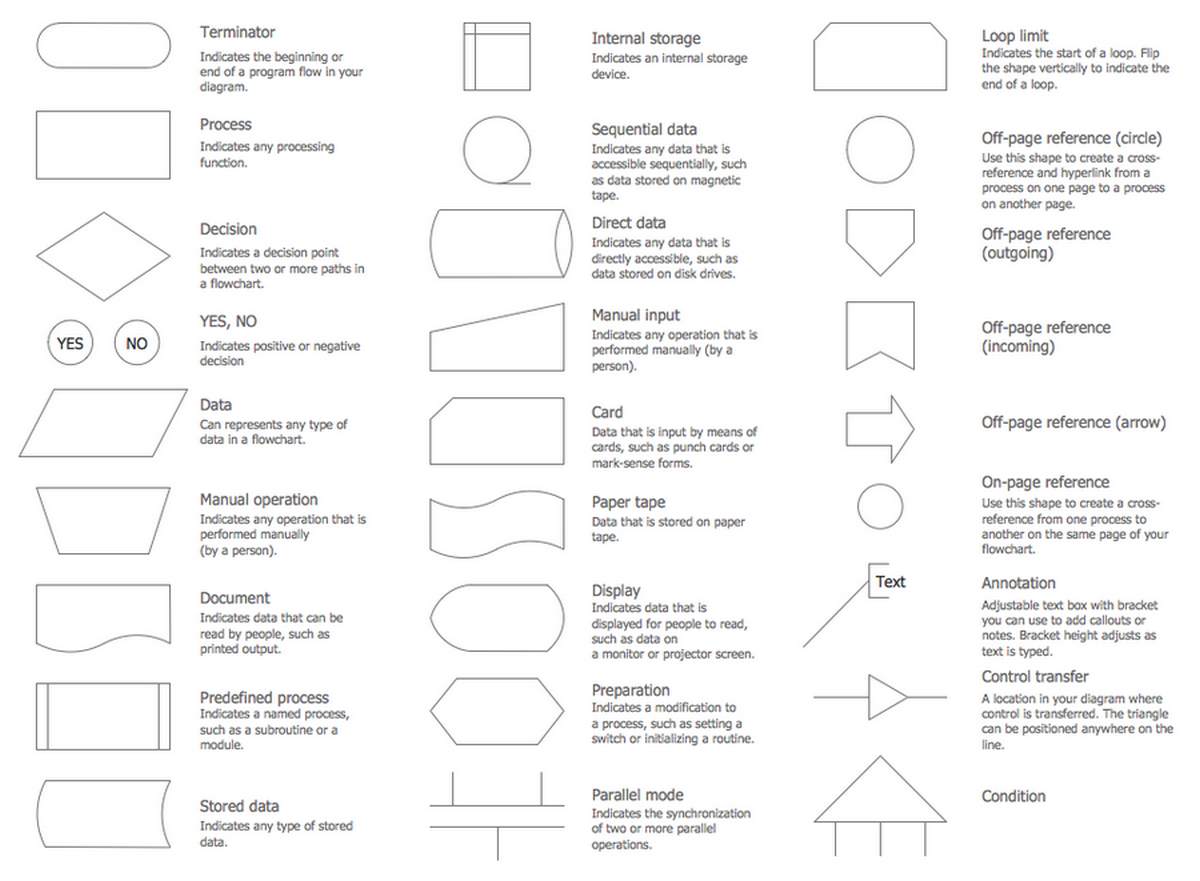
Picture: Process Flowchart Symbols: Meaning, Types and Examples
Related Solution:
ConceptDraw Pyramid Diagram software allows drawing column charts using predesigned objects or drawing tools.
Picture: Pyramid Diagram
Related Solutions:
