EPC Diagram
“An Event-driven Process Chain (EPC) is a type of flowchart used for business process modelling. EPCs can be used for configuring an enterprise resource planning (ERP) implementation, and for business process improvement.”[from Wikipedia]
ConceptDraw DIAGRAM diagramming and vector drawing software offers the Event-driven Process Chain Diagrams EPC Solution from the Business Processes Area of ConceptDraw Solution Park with powerful drawing tools to help you draw the EPC diagram of any complexity quick and easy.
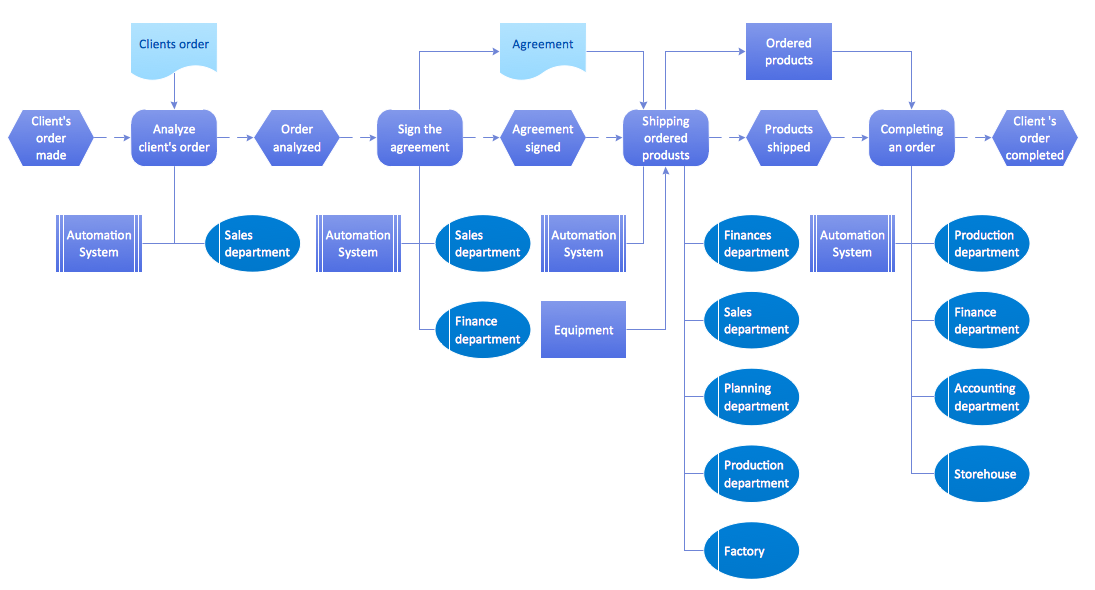
Example 1. EPC Diagram - Order Processing
Event-driven Process Chain Diagrams EPC Solution was specially designed to give you the opportunity to create any EPC diagram in minutes. Simply create new document and drag the needed objects from the EPC Diagrams library to make your own professional looking and successful EPC diagram with any quantity of elements.

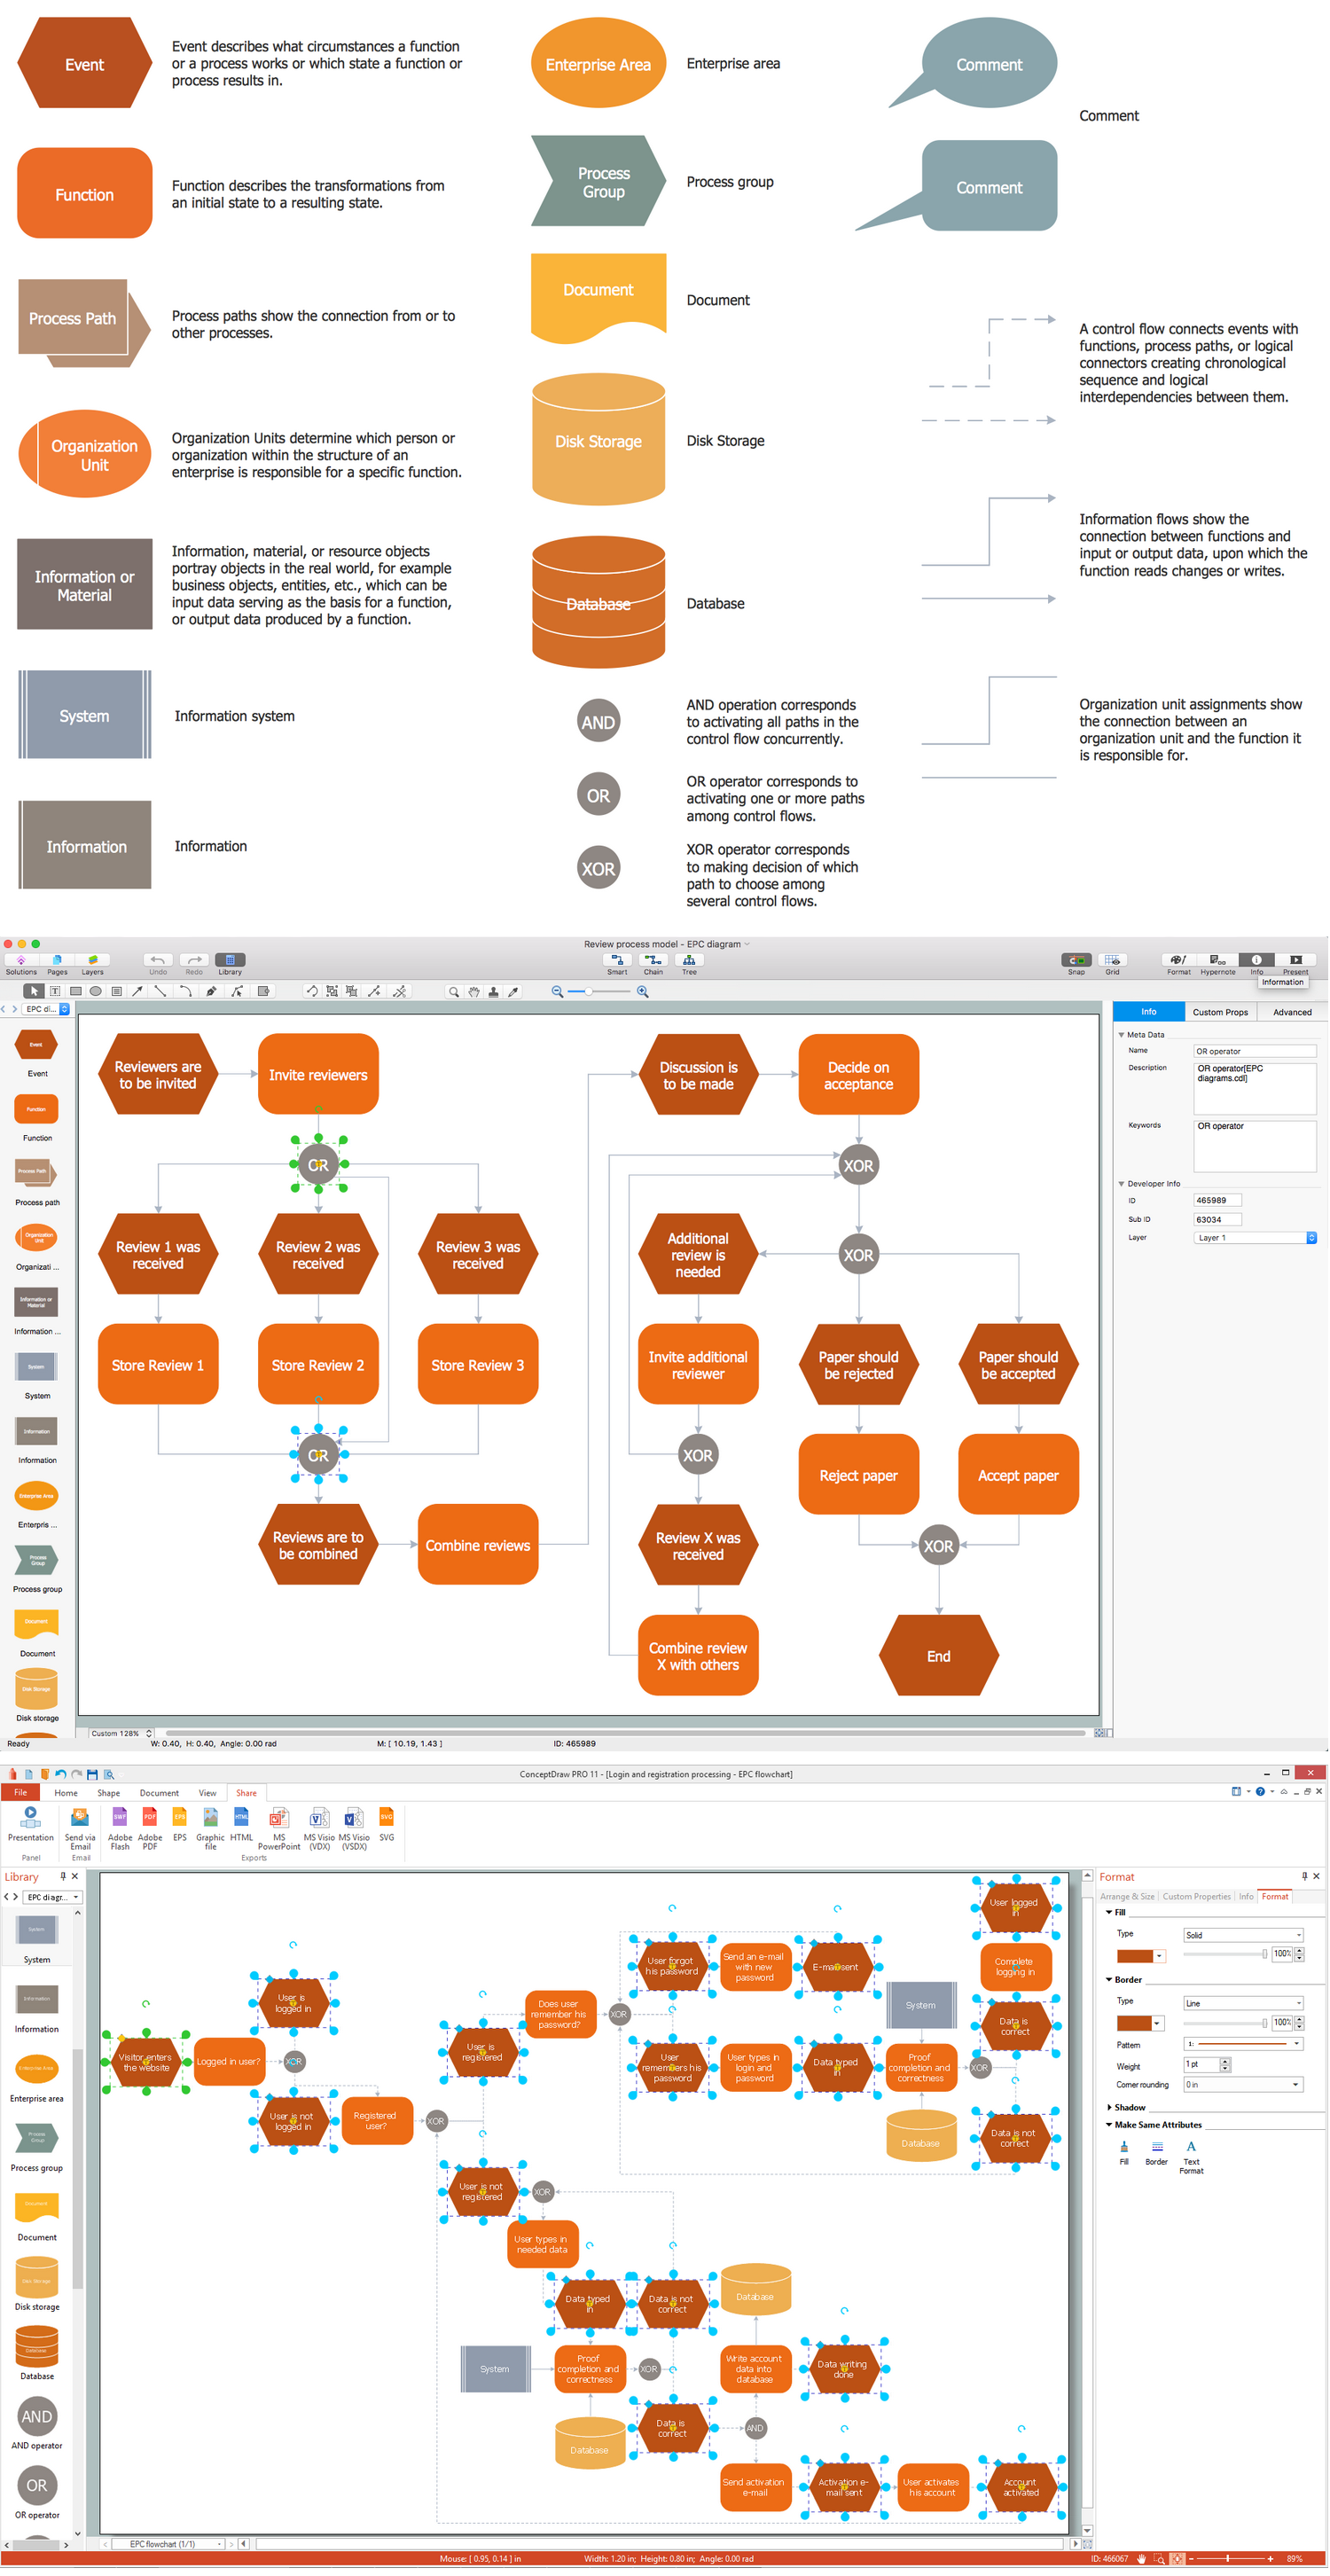
Example 2. EPC Diagrams Library Design Elements
Event-driven Process Chain Diagrams EPC solution contains also a set of different examples and templates. All EPC diagram samples and templates are available from ConceptDraw STORE, you can open them and change something as needed, and thus get already your own new EPC diagram.

Example 3. EPC Diagram
The samples you see on this page were created in ConceptDraw DIAGRAM using the Event-driven Process Chain Diagrams EPC Solution for ConceptDraw DIAGRAM These samples successfully demonstrate solution's capabilities and professional results you can achieve. An experienced user spent 10 minutes creating every of these samples.
Use the Event-driven Process Chain Diagrams EPC Solution for ConceptDraw DIAGRAM software to create your own professional looking EPC diagrams of any complexity quick, easy and effective, and then successfully use them.
Any EPC Diagram designed with ConceptDraw DIAGRAM is vector graphic documents and is available for reviewing, modifying, converting to a variety of formats (image, HTML, PDF file, MS PowerPoint Presentation, Adobe Flash or MS Visio), printing and send via e-mail in one moment.