Made with
ConceptDraw
DIAGRAM 18

ConceptDraw DIAGRAM ER Diagram Tool

The main tool of domain modeling at the stage of conceptual design is the Entity-relationship model, also called ER-model. Modeling domain data structures is based on the usage of graphical tools — ER-diagrams (Entity-Relationship diagrams). Simply put, it is a visual representation of relationships between entities.

The core concepts of ER Diagram are entity, attribute and relationship. An entity is an object of the real world that can exist independently. An entity has instances which differ in attribute values and allow unambiguous identification. An attribute is a property of the essence. For example, the entity named Book is characterized by attributes such as author, title, price, publishing house, edition, number of pages. Specific books are instances of the book entity. These instances vary in the values of these attributes and are uniquely identified by the attribute "name". Attribute that uniquely identifies the instance of the entity is called the primary key. It may also be a composite key, which is a combination of several attributes.

A very important feature of the entity-relationship model is that it can be represented as a graphical diagram. This greatly facilitates the subject area analysis. There are several notations used to represent entity-relationship elements, like Crow’s foot notation, or Chen notation, and each has its pros and cons.
ConceptDraw DIAGRAM ER Diagram Tool *

Example 1. ER Diagram

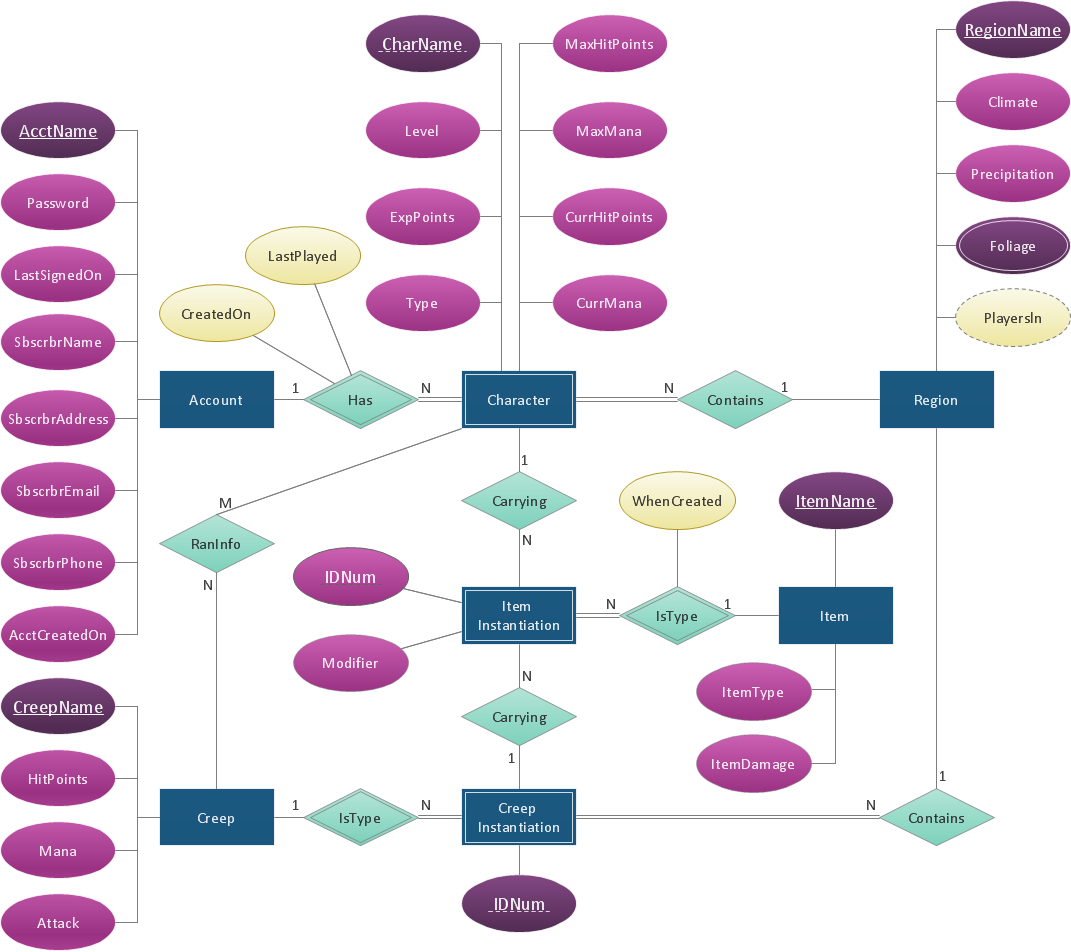
The entity on the ER-diagram is represented in the form of a rectangle, which indicates its name. Relationship is the interaction between entities, which is characterized by degree which counts how many entities are involved in the relation. The relationship between the two entities is called binary, and the relationship between more than two entities is ternary. Attributes, entities and relationships are connected by straight lines. Relation is shown in the form of a diamond. When creating a diagram, you can follow a few obvious steps. First, you need to identify entities and relationships among them. The following step is to identify the semantic information in the sets of relations (for example, whether a certain set of connections is a 1:n relation). Then you should define relationships cardinalities and determine attributes and their values sets. The final step is to organize the data in the form of entity-relationship connections.

As an example, let’s imagine a database designed for storing information about some bank activities. The bank has affiliates, which are controlled by managers. Customers of the bank have different types of accounts — current, term, demand, deposit, card account. Branches handle these accounts. The described domain will be called Bank. Let’s determine four entities: the Affiliate, the Manager, the Account, the Customer and some relations among them: the Manager controls the Affiliate; the Affiliate handles the Account; the Customer has the Account.

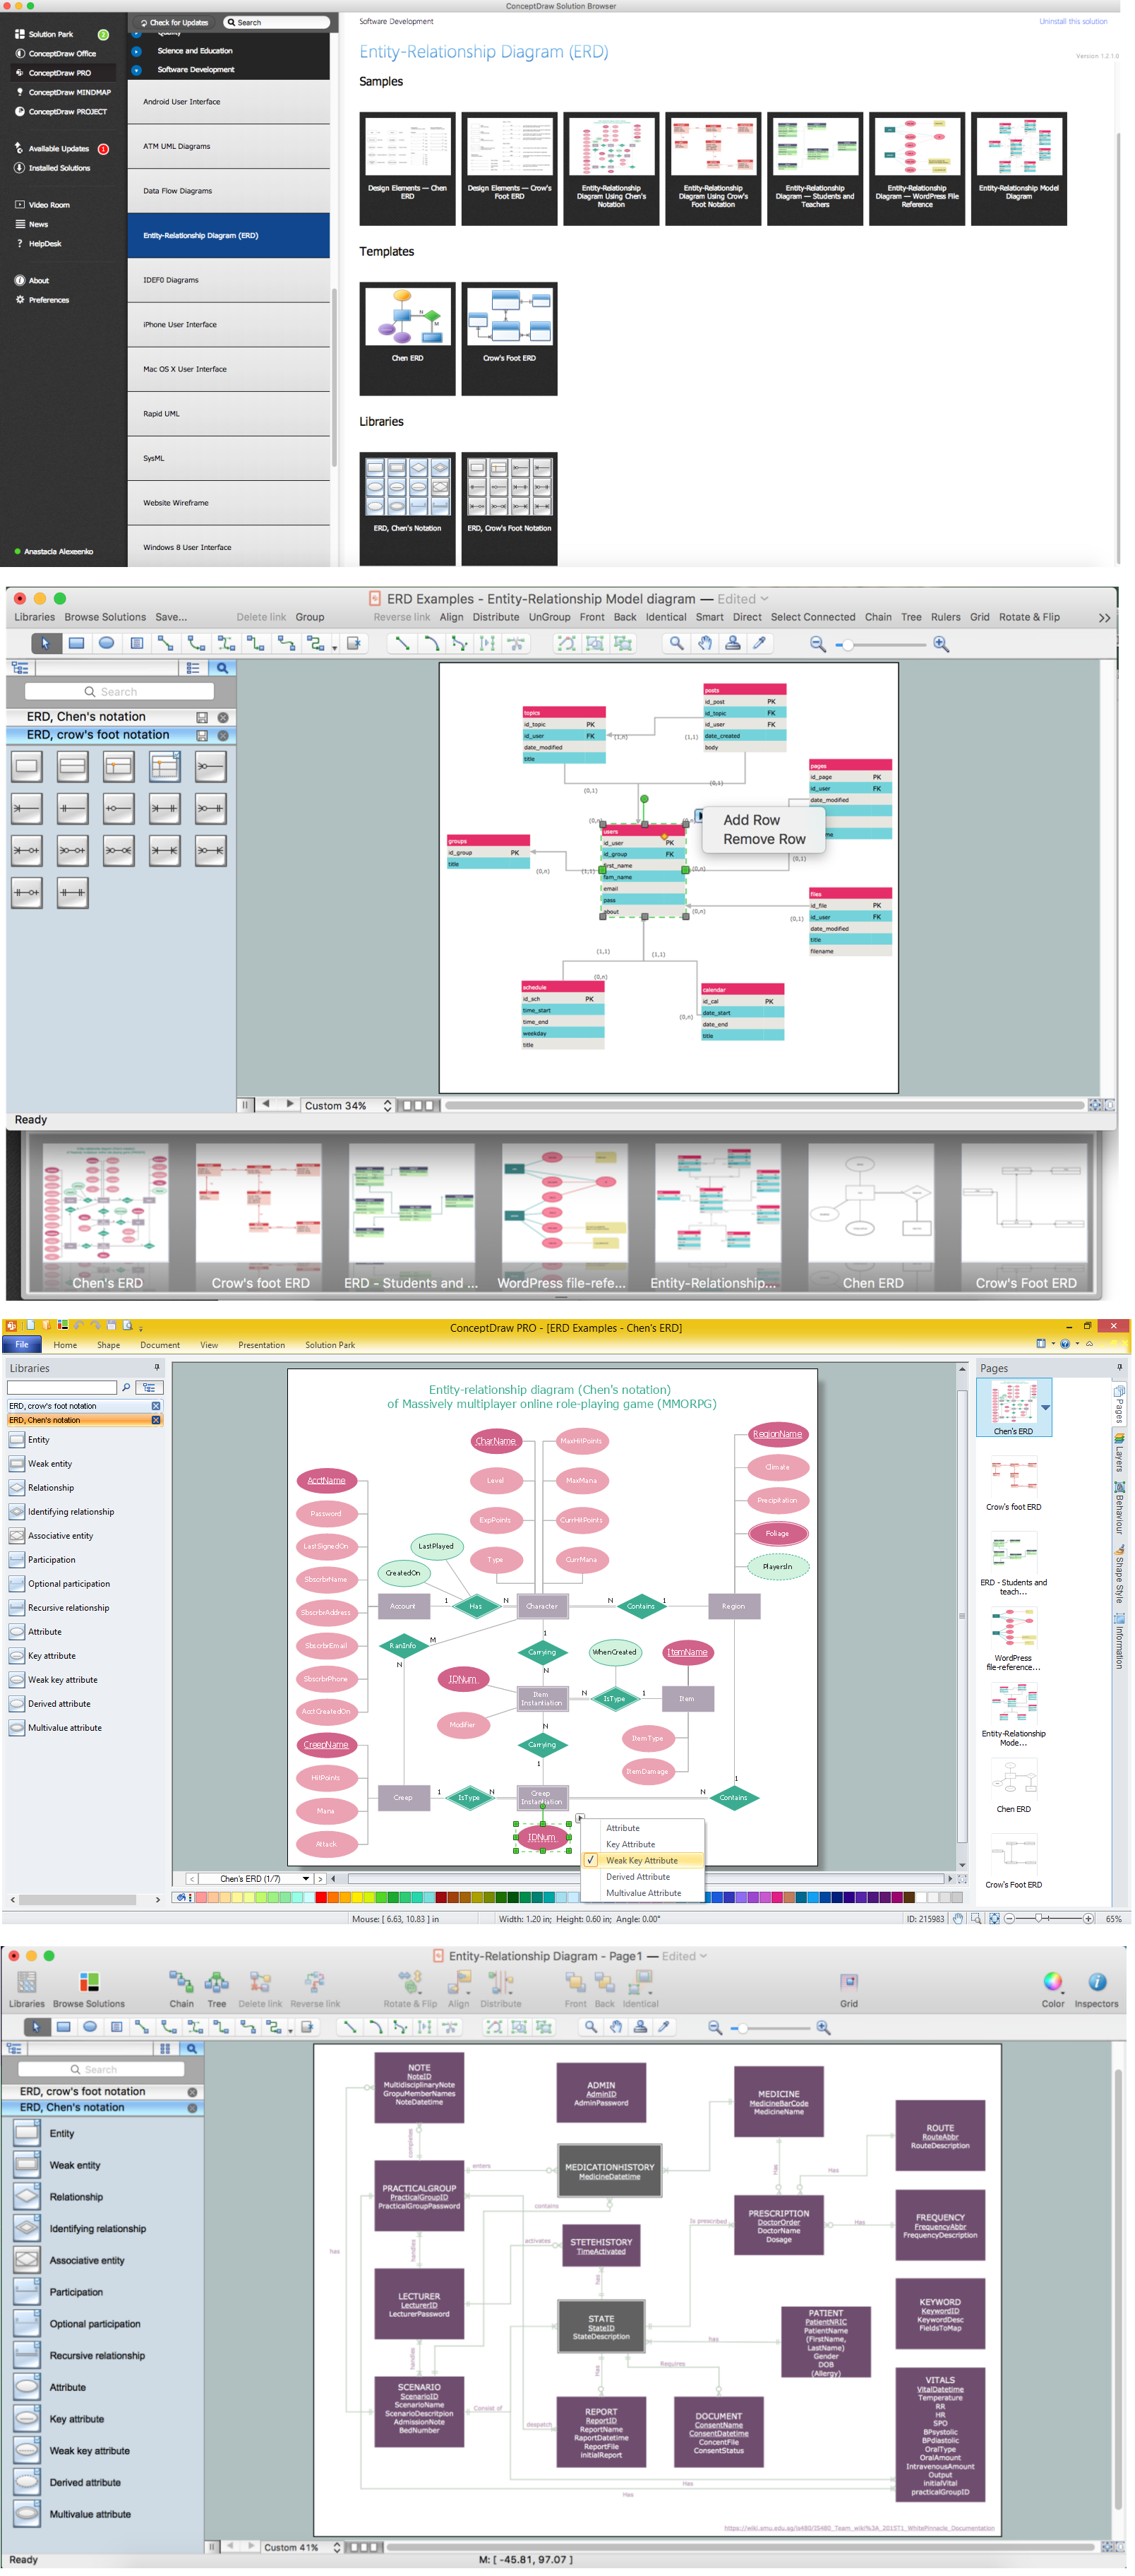
ConceptDraw PRO v5 with Entity-Relationship Diagram (ERD) solution serving as ERD software allows you to visually create Entity Relationship diagrams (ERDs) for various database systems, it supports ODBC-compatible databases (Oracle, MS SQL, InterBase, MySQL, MS Access, Firebird and others). The built-in scripting language allows to connect to ODBC-compatible databases and automatically generate the structure of a database (reverse engineering of the database structure).
ConceptDraw DIAGRAM  ER Diagram Tool

Example 2. ConceptDraw ER Diagram Tool

ConceptDraw ER Diagram Tool works across any platform, meaning you never have to worry about compatibility again. ConceptDraw PRO v5 allows you to make Entity-Relationship Diagram (ERD) on PC or macOS operating systems.

When creating an ERD our ERD software considers individual database options such as referential integrity, constraints, domains, triggers, stored procedures, functions, packages, views, sequences, synonyms etc.

ConceptDraw PRO v5 is a very easy-to-use and intuitive database design tool and ER Diagram tool which can save you hundreds hours of work. Entity-Relationship Diagram (ERD) solution contains 2 libraries with 45 predesigned vector graphic elements, collection of professional ERD samples, examples and templates.

ConceptDraw PRO v5 is excellent choice of database designers for modeling, reverse and forward engineering of relational databases. It is not only an excellent tool for ER Diagram, but also the one that allows you to reverse engineer already existing database structures, create detailed HTML, PDF or PPT reports.
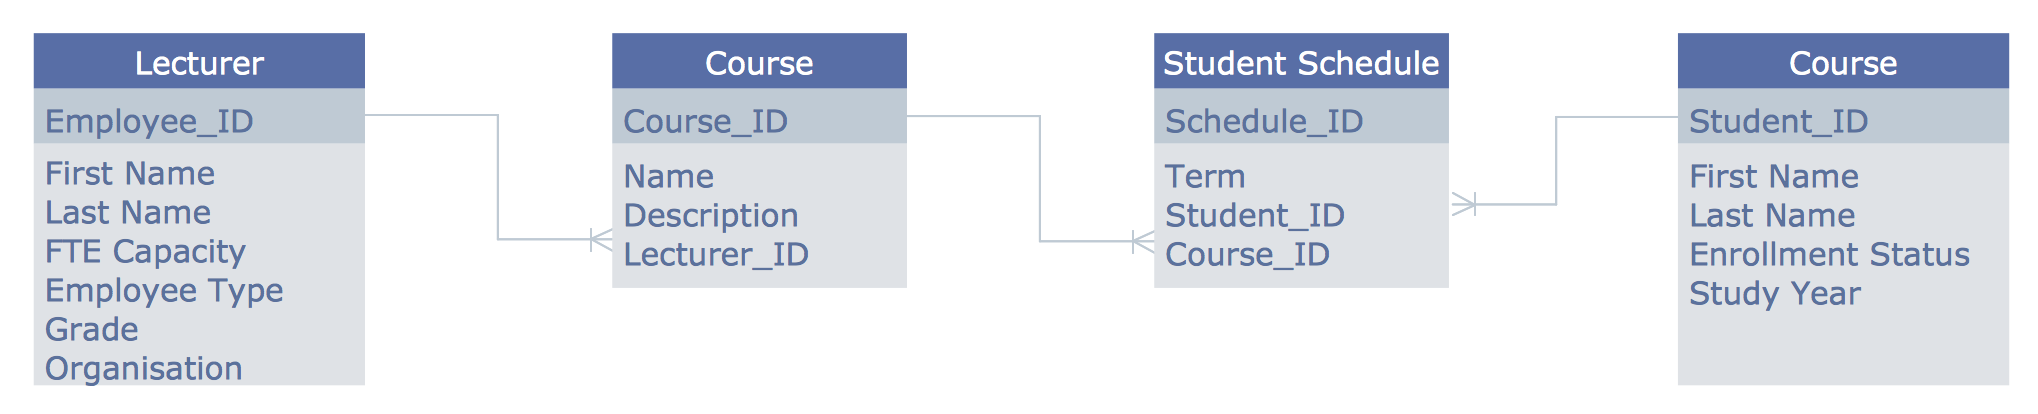
ER Diagram (ERD)

Example 3. ER Diagram (ERD)

The ER Diagram samples you see on this page were created in ConceptDraw PRO v5 using the Entity-Relationship Diagram (ERD) Solution. They successfully demonstrate solution's capabilities and professional results you can achieve. An experienced user spent 10 minutes creating every of these samples.

Use the Entity-Relationship Diagram (ERD) Solution for ConceptDraw PRO v5 software to create your own professional looking ER Diagrams quick, easy and effective, and then successfully use them in your scientific or education activity.

All source documents are vector graphic documents. They are available for reviewing, modifying, or converting to a variety of formats (PDF file, MS PowerPoint, MS Visio, and many other graphic formats).

TEN RELATED HOW TO's:
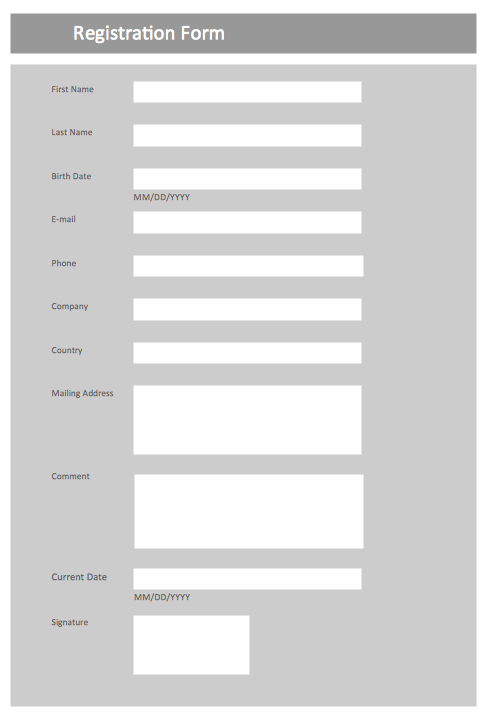
Use the Basic Diagramming Solution from the Universal Diagramming area of ConceptDraw Solution Park to easy create simple forms, questionnaires, survey forms, registration and application forms, etc.Form Maker *
Picture: Form Maker
Related Solution:
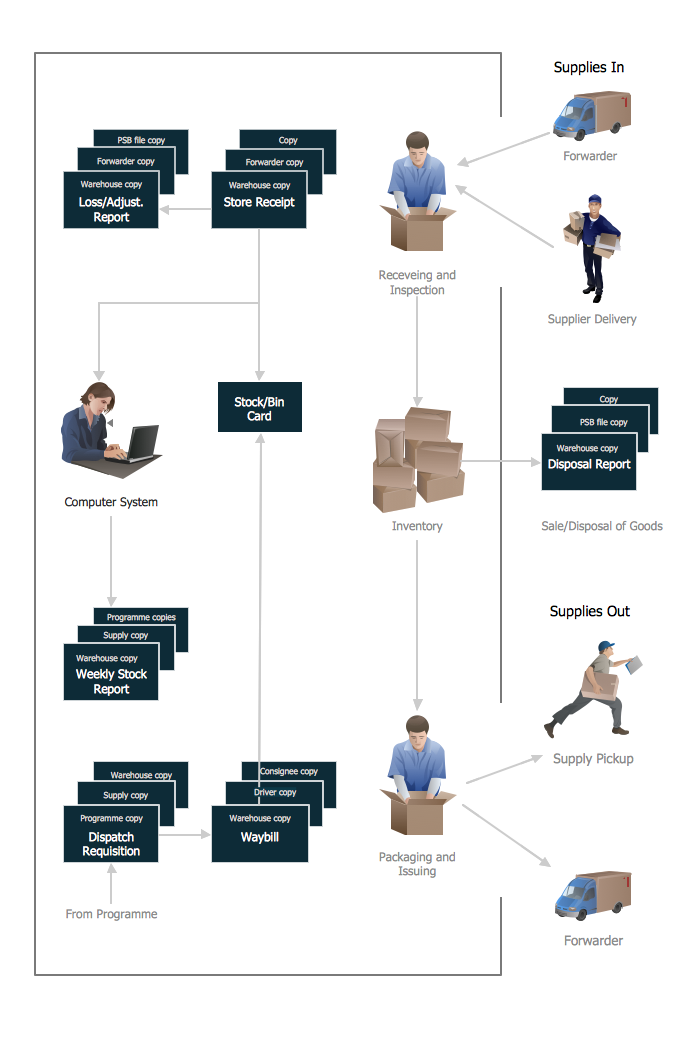
If you want to find a way to understand complex things in minutes, you should try to visualize data. One of the most useful tool for this is creating a flowchart, which is a diagram representing stages of some process in sequential order. There are so many possible uses of flowcharts and you can find tons of flow charts examples and predesigned templates on the Internet. Warehouse flowchart is often used for describing workflow and business process mapping. Using your imagination, you can simplify your job or daily routine with flowcharts. Warehouse flowcharts are used to document product and information flow between sources of supply and consumers. The flowchart provides the staged guidance on how to manage each aspect of warehousing and describes such aspects as receiving of supplies; control of quality; shipment and storage and corresponding document flow. Warehouse flowchart, being actual is a good source of information. It indicates the stepwise way to complete the warehouse and inventory management process flow. Also it can be very useful for an inventory and audit procedures.Warehouse Flowchart
Picture: Flow Chart Example: Warehouse Flowchart
Related Solution:
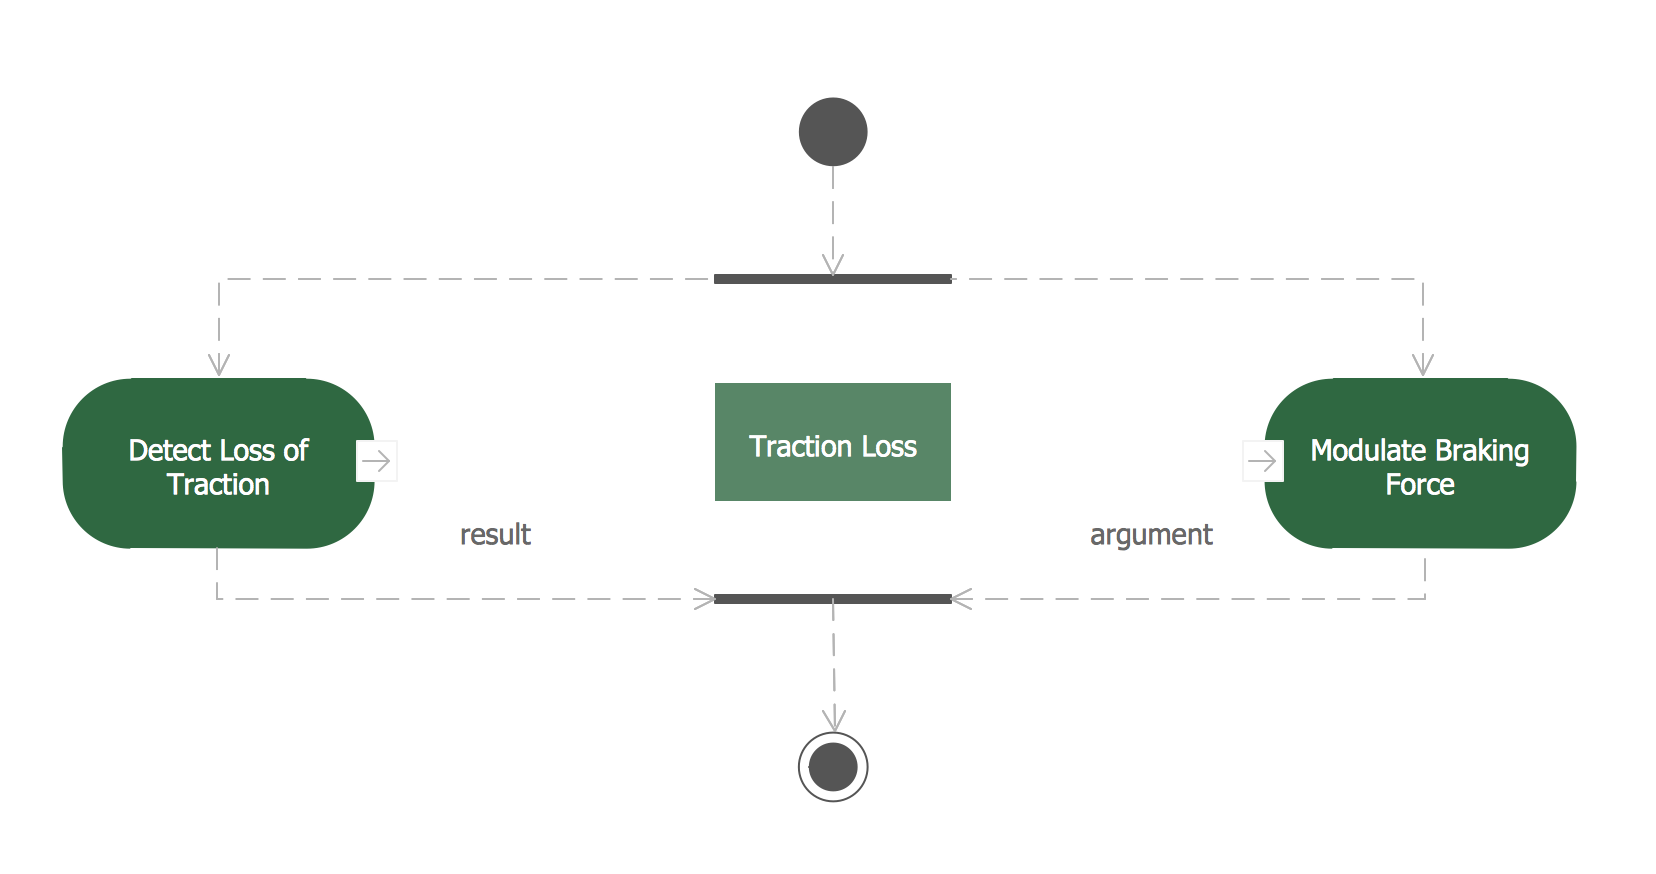
The vector stencils library Activity diagrams from the solution Rapid UML contains specific data modeling symbols for ConceptDraw DIAGRAM software.Data Modeling  Diagram
Picture: Data Modeling Diagram
The vector stencils library Chen ERD from the solution Entity-Relationship Diagrams (ERD) contains specific symbols of the Chen ERD notation including entity symbols and relationship symbols for ConceptDraw DIAGRAM software.Chen ERD Diagram
Picture: Chen ERD Diagram
Related Solution:
ConceptDraw DIAGRAM is a great UML modeling and design tool that enables you to quickly and easily generate all types of UML diagrams. ConceptDraw DIAGRAM offers a large collection of industry-standard UML object libraries for all types of UML diagrams.ConceptDraw DIAGRAM UML Diagrams with ConceptDraw DIAGRAM  *
Picture: ConceptDraw DIAGRAM UML Diagrams with ConceptDraw DIAGRAM
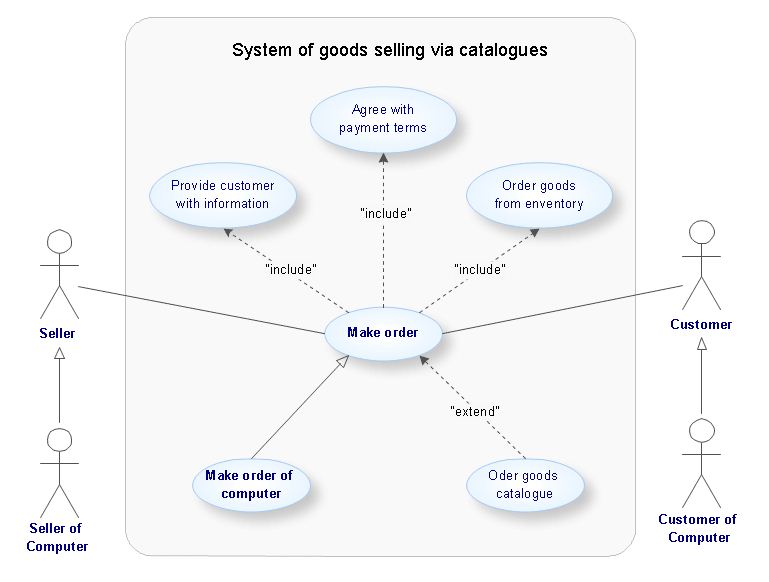
UML Diagram Estate Agency. This sample was created in ConceptDraw DIAGRAM diagramming and vector drawing software using the UML Use Case Diagram library of the Rapid UML Solution from the Software Development area of ConceptDraw Solution Park. This sample shows the work of the estate agency and is used by the estate agencies, building companies, at the trainings of the estate agencies, for understanding the working processes of the estate agencies.UML Use Case Diagram Example - Estate Agency *
Picture: UML Use Case Diagram Example - Estate Agency
Related Solution:
Android is an operating system based on the Linux kernel and developed by Google for smartphones, tablet computers, electronic books, netbooks, smartbooks, digital players, watches, game consoles, TV and other devices. ConceptDraw DIAGRAM extended with Android User Interface Solution from the Software Development Area is a powerful software with extensive drawing tools which can help you to build the intelligible, attractive and easy for perception Android GUI for your application.Android GUI *
Picture: Android GUI
Related Solution:
The Social Media Response solution creates interactive social media flow charts and action mind maps. The solution includes a video tutorial and a number of samples helping social media teams refine and organize their response process.How to Connect Social Media DFD Flowchart with Action Maps *
Picture: How to Connect Social Media DFD Flowchart with Action Maps
Related Solution:
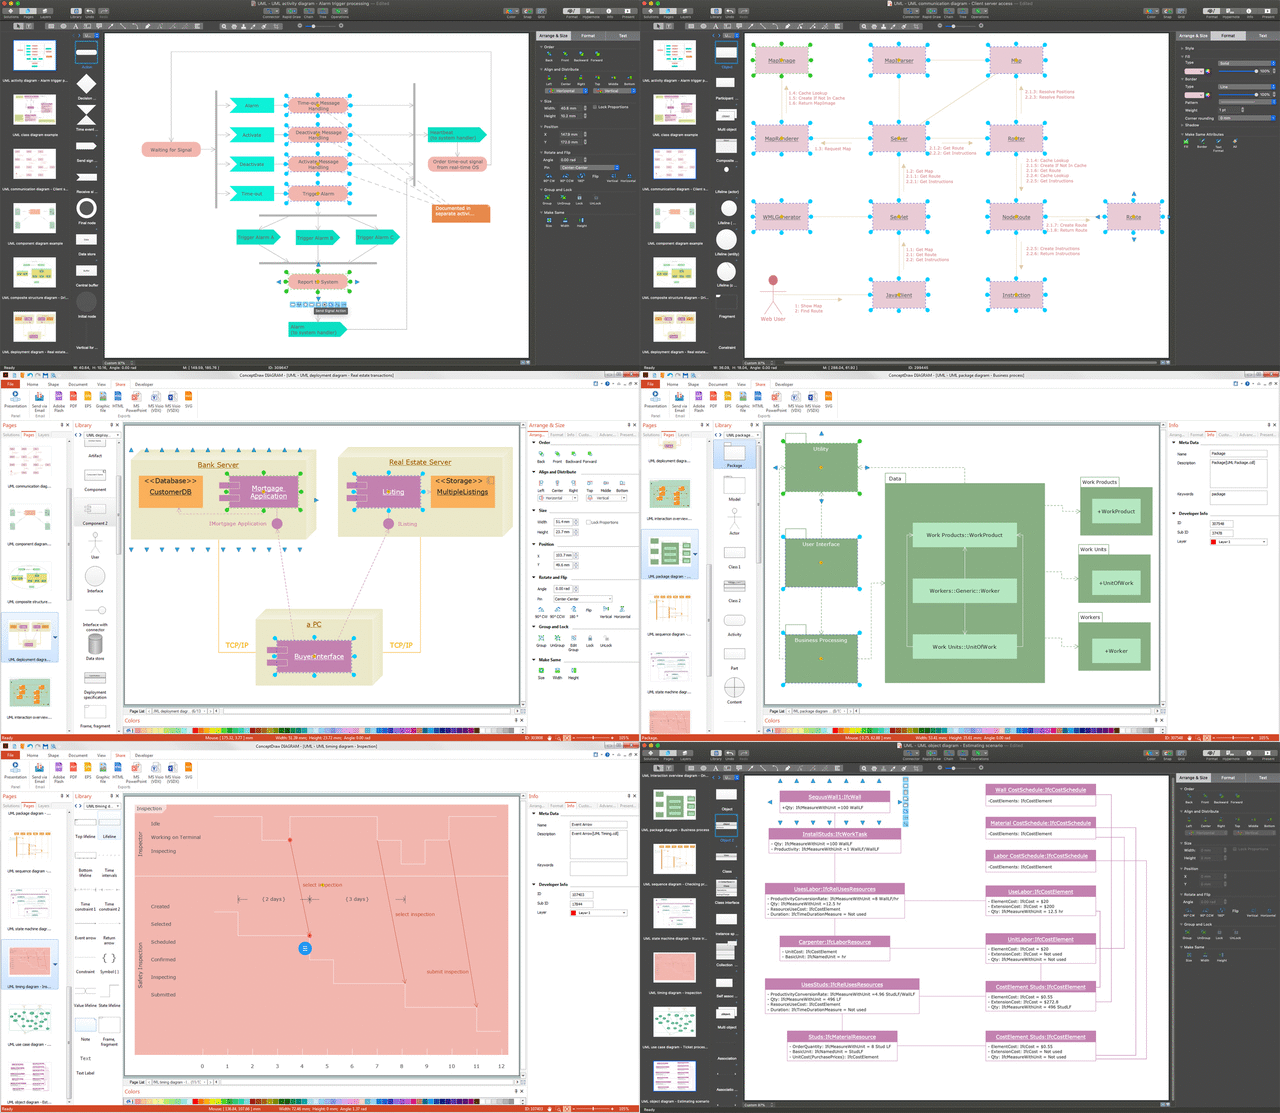
While developing software, it is very important to have a visual model, because it helps to represent the logic and the architecture of an application. Experienced engineers use UML diagrams to denote relationships between classes and their instances. UML is a general language for a set of diagrams like deployment diagrams, object diagrams or use case diagrams. This diagram represents UML class diagram used for a software system development using an object-oriented method. Class diagrams are categorized as static structure diagrams that depict the physical structure of a system. Class diagram divides a software system's structure into "classes". Classes are defined by the methods and variables of objects. UML Class diagram is used to depict relationships and source code dependencies between objects.UML Diagram *
Picture: UML Diagram
Related Solution:
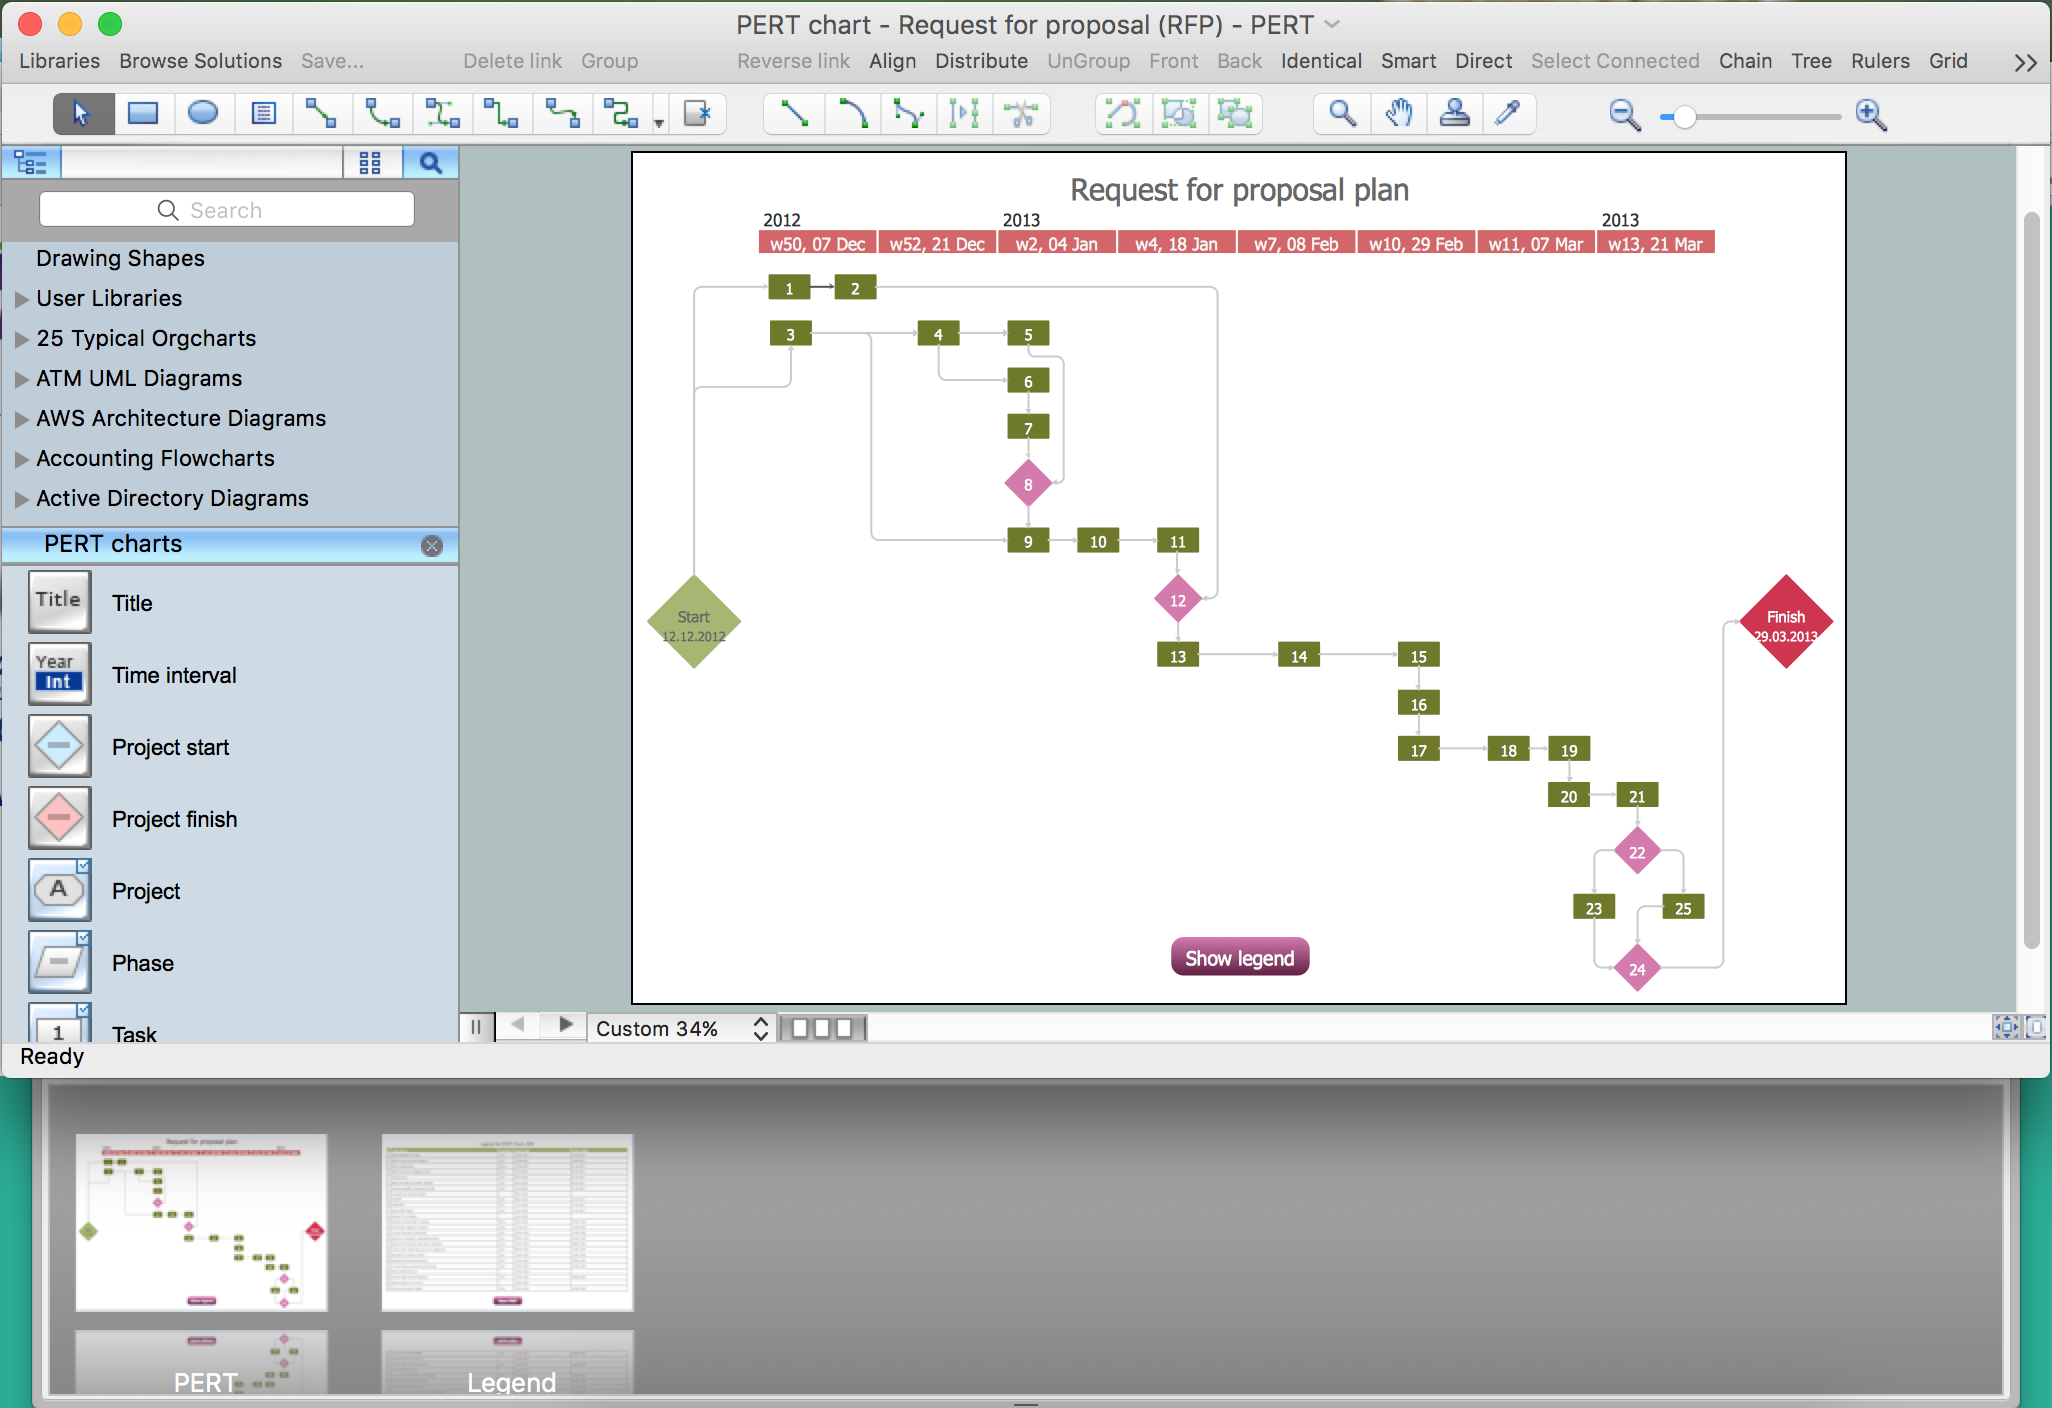
Big and complex projects sometimes need some simplification of plans and schedules. That's why Program Evaluation and Review Technique was invented and first implemented in 1958. You can create PERT diagrams effortlessly with ConceptDraw DIAGRAM and share them with your colleagues. Program Evaluation Review Technique (PERT) is a method that is used to assess and analyze projects. PERT is a valuable tool for the project management practice. PERT gives an assessment and analysis of the time needed to the project completion. A PERT chart is a visual tool that delivers a graphical view of a project timeline. It is used to display the sequences and dependences of project tasks necessary to complete a project. ConceptDraw DIAGRAM delivers the possibility to build a PERT along with other diagrams applied to assist management process by using its Seven Management and Planning Tools solution.Program Evaluation and Review Technique <br>(PERT) with ConceptDraw DIAGRAM  *
Picture: Program Evaluation and Review Technique (PERT) with ConceptDraw DIAGRAM
Related Solution:
ConceptDraw
DIAGRAM 18