Entity-Relationship Diagram (ERD)
with ConceptDraw DIAGRAM
Entity-Relationship Diagram (ERD) serves for detailed description of structures and databases. An ERD represents a diagram made up mainly of rectangular blocks (for entities, or data) linked with relationships. The links between the blocks describe relations between these entities. There are three types of relationships:
- one-to-one,
- one-to-many,
- many-to-many.
For example, "driver drives a car". Here, the entity "driver" relates to the entity "car" by means of a one-to-one relationship "drives". One driver drives one car.

An example of a one-to-many relationship is a sergeant commanding a team of soldiers. Here the entity "sergeant" relates to a number of entities "soldier" by means of a one-to-many relationship.

Since the many-to-many relationship does not adequately represent the nature of interaction between entities, it is rarely used in diagrams, or is used in diagrams with little detail.
Entities and relationships can both have attributes. Example: a car from the first example has number; the "drives" relation may have quality attributes describing the quality of driving, or time attributes, saying when exactly the driver was driving the car.

ERDs are mainly used to describe database structures, though they might be used as diagrams describing a structure of a company, organization, or some business processes.
ConceptDraw DIAGRAM extended with Entity-Relationship Diagram (ERD) solution from the Software Development Area allows you to draw very complex and detailed ERD. It has a number of libraries with objects used in diagrams, which are included in relevant templates and samples available from ConceptDraw STORE.
 Solution in ConceptDraw STORE")
Example 1. Entity-Relationship Diagram (ERD) Solution in ConceptDraw STORE
In actual practice, ERDs employing the method of P.P. Chen are used most. Choose the Chen ERD template in ConceptDraw STORE. A new document will open along with the library with objects necessary to create a diagram. Drag the vector objects representing entities and relationships, and then just connect them between each other in the required order. Use respective library objects to indicate the types of relationships and their attributes.
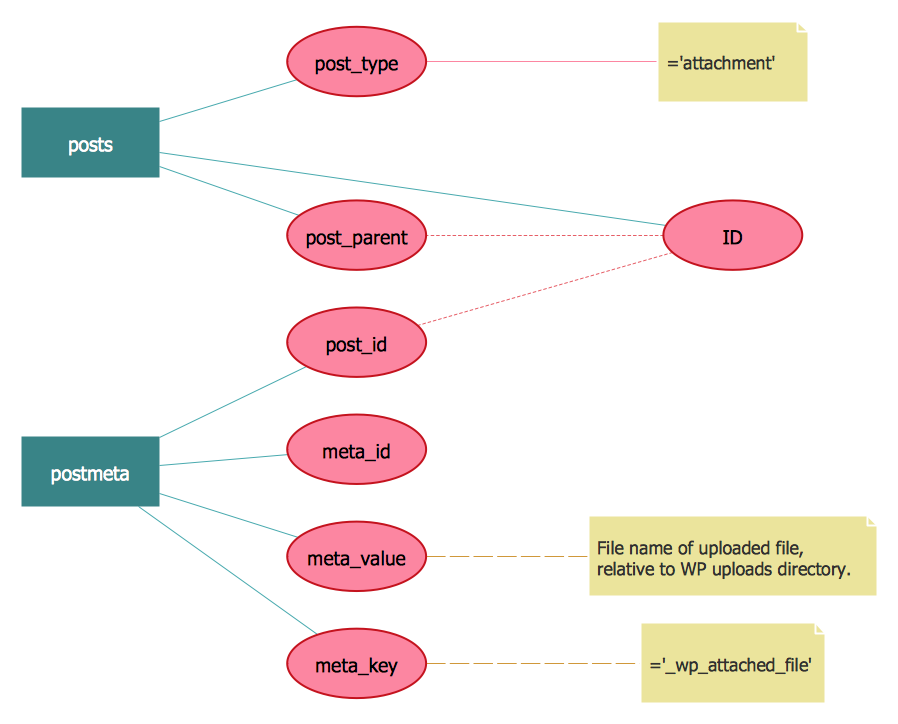
Example 2. ERD WordPressFile Reference. Chen's Notation
One of advantages of ERD diagram drawn in ConceptDraw DIAGRAM is that when you move entities on the diagram, they stay connected and you don't need to move relationships too.
Apart from building a diagram manually, ConceptDraw has a built-in tool for drawing an ERD automatically, from a database.

Example 3. Entity Relationship Model Diagram. Crow's Foot Notation
The samples you see on this page were created in ConceptDraw DIAGRAM using the Entity-Relationship Diagram (ERD) Solution and demonstrate some of solution's capabilities and the results you can achieve.
All source documents are vector graphic documents. They are available for reviewing, modifying, or converting to a variety of formats (PDF file, MS PowerPoint, MS Visio, and many other graphic formats) from the ConceptDraw STORE. The Entity-Relationship Diagram (ERD) Solution is available for all ConceptDraw DIAGRAM or later users.
TEN RELATED HOW TO's:
The Cloud Computing is the use of the software and hardware that includes the great number of computers connected over the communication network such as the Internet. The Cloud name comes from the usage the cloud symbol on the system diagrams as the abstraction for the complex network infrastructure. This term is used as a marketing metaphor for the Internet.
This example was created in ConceptDraw DIAGRAM using the Computer and Networks Area of ConceptDraw Solution Park and shows the Cloud Computing.
Picture: Cloud Computing
Related Solution:
This sample shows the Spider Chart that represents the budget and spending for one organization and allows to compare them. The multivariate data are represented on the Spider Chart as a two-dimensional chart with four or more variables displayed on the axes that start in one point. The Spider Charts are used in the management, business and sport.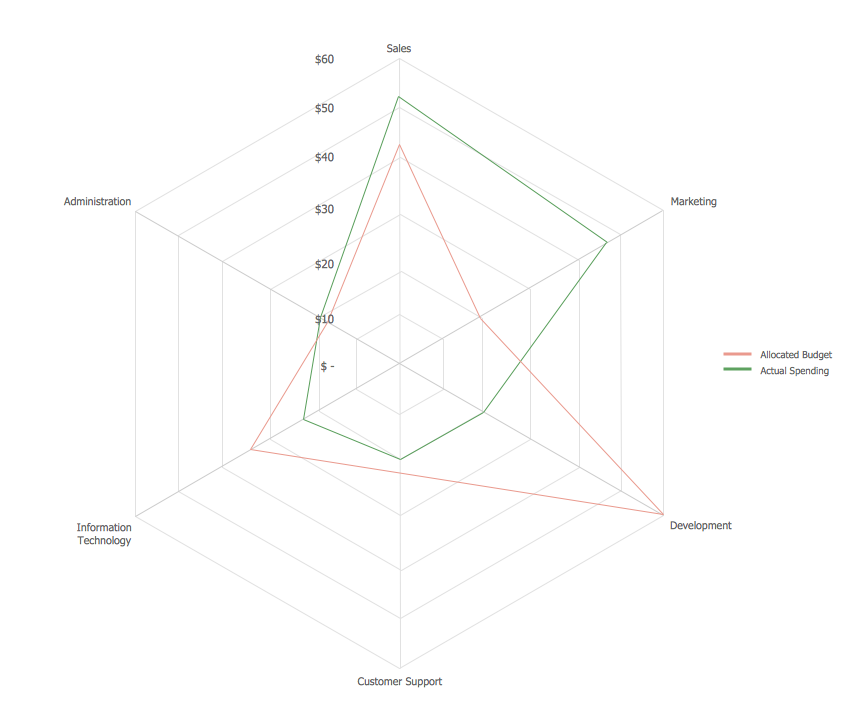
Picture: Spider Chart Template
A flowchart is a powerful tool for examining processes. It helps improving processes a lot, as it becomes much easier to communicate between involved people, to identify potential problems and to optimize workflow. There are flowcharts of different shapes, sizes and types of flowchart vary from quite basic process flowcharts to complex program flowcharts. Nevertheless, all these diagrams use the same set of special symbols like arrows to connect blocks, parallelogram to show data receiving or rectangles for showing process steps.
Basic flowcharts are used to represent a simple process algorithm. A basic flowchart notation consists of rectangles (business processes), arrows (the flow of information, documents, etc.). The same notation is used in items such as the "decision", which allow you to do the branching. To indicate the start of the entire business process and its termination can be used the "Terminator" element. The advantages of Basic Flowchart are simplicity and clarity. With it you can quickly describe the business process steps. Creating of Basic Flowchart does not require any special knowledge, as easily understand by employees with different levels of education and IQ.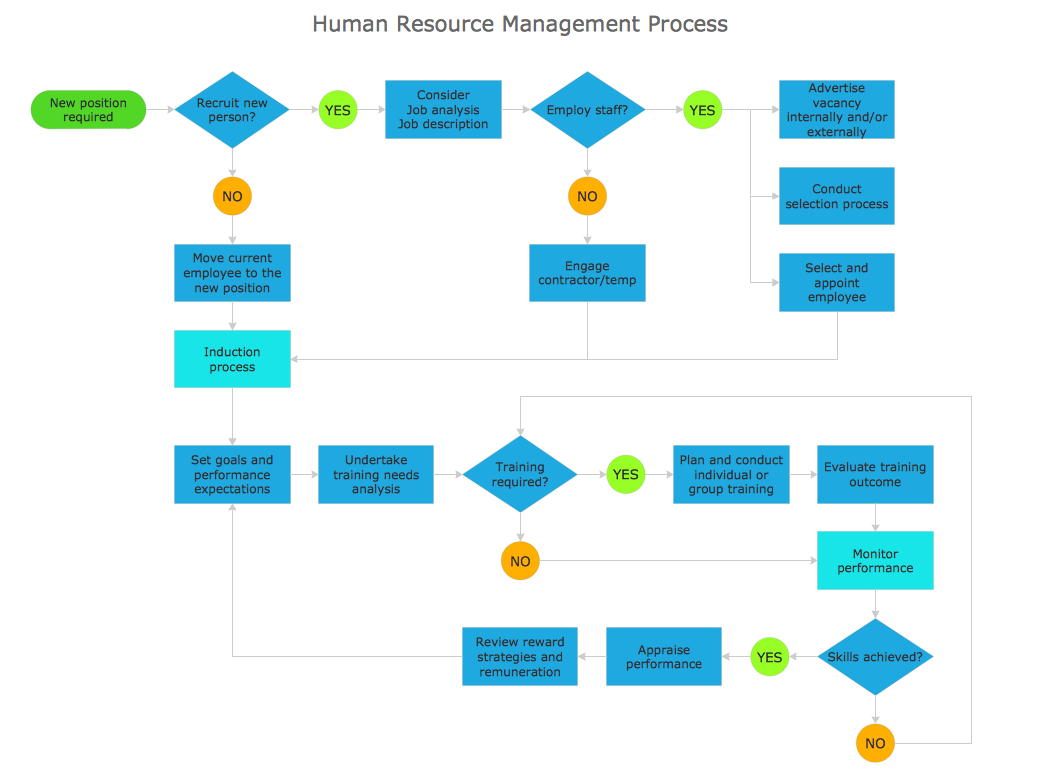
Picture: Types of Flowchart: Comprehensive Overview
Related Solution:
What is a computer network? This is a set of devices and systems that are connected to each other (logically or physically) and communicate with each other. This could include servers, computers, phones, routers, and so on. The size of this network can reach the size of the Internet, and can consist of only two devices connected by a cable.
This sample shows the connection scheme of the home WLAN equipment to the Internet.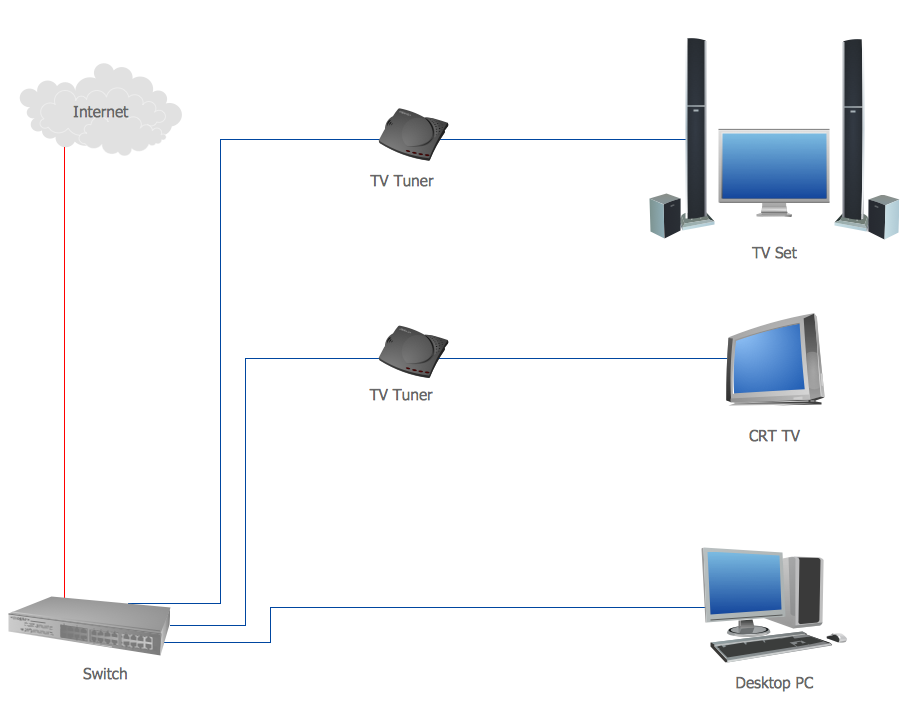
Picture: Diagram of a Basic Computer Network. Computer Network Diagram Example
Related Solution:
Working with information can be quite tedious, furthermore, some data can be quite difficult to perceive without any graphic representation. So, to facilitate your work, you can use business diagrams, such as simple flowcharts or Gantt charts for project management and orgcharts for clarifying your company structure. You can use a proper software, like ConceptDraw Pro, draw them on paper, or use whiteboards, but it is more convenient to use a digital tool.
This diagram shows a cross-functional flowchart that was made fore telecom service provider. A workflow of a common telecommunication service provider has a rather branched structure. Thus, it is useful to have a flow chart to visualize the sequences and interrelations of the work flow steps. Business process flowchart contains 17 processes and 4 decision points,that are distributed through 2 lines depicting the participants involved. Also there are connectors that show the data flow within processes. This flowchart displays a detailed model of the telecom service trading process, as well as all participants in the process and how they interact with each other.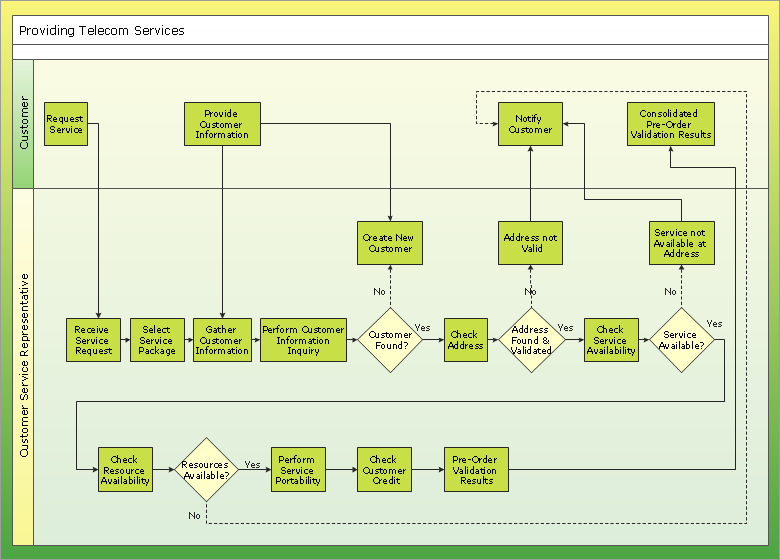
Picture: Business diagrams & Org Charts with ConceptDraw DIAGRAM
Electrical plan is a document that is developed during the first stage of the building design. This scheme is composed of conventional images or symbols of components that operate by means of electric energy. To simplify the creation of these schemes you can use house electrical plan software, which will not require a long additional training to understand how to use it. You only need to install the necessary software ant it’s libraries and you’ll have one less problem during the building projection.
Any building contains a number of electrical systems, including switches, fixtures, outlets and other lightening equipment. All these should be depicted in a building electrical plans and included to general building documentation. This home electrical plan displays electrical and telecommunication devices placed to a home floor plan. On the plan, each electrical device is referenced with the proper symbol. Electrical symbols are used for universal recognition of the building plan by different persons who will be working on the construction. Not all possible electric symbols used on a certain plan, so the symbols used in the current home plan are included to a legend. The electrical home plan may be added as a separate document to a complete set of building plans.
Picture: How To use House Electrical Plan Software
Related Solution:
Create your own Linux audit flowcharts using the ConceptDraw DIAGRAM diagramming and vector drawing software extended with the Audit Flowcharts solution from the Finance and Accounting area of ConceptDraw Solution Park.
This flowchart example describing auditd, the linux audit tool.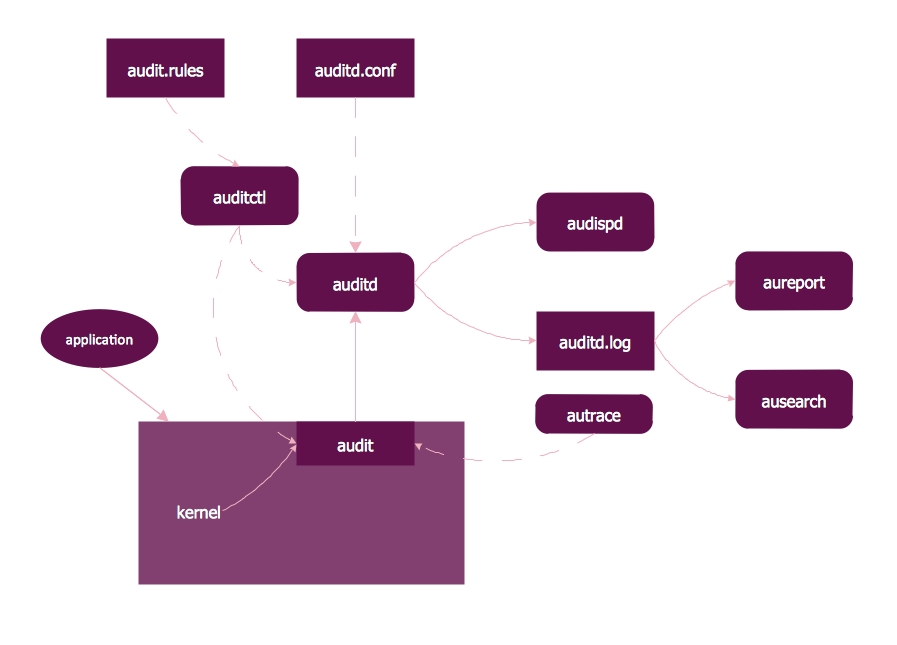
Picture: Linux Audit Flowchart Example. Flowchart Examples
Related Solution:
Entity Relationship Diagram (aka ERD, ER Diagram, E-R Diagram) is a well-tried software engineering tool for illustrating the logical structure of databases. Professional ERD drawing is an essential software engineering method for database modeling. Use powerful tools of ConceptDraw DIAGRAM Entity Relationship Diagram Software extended with Entity-Relationship Diagram (ERD) Solution.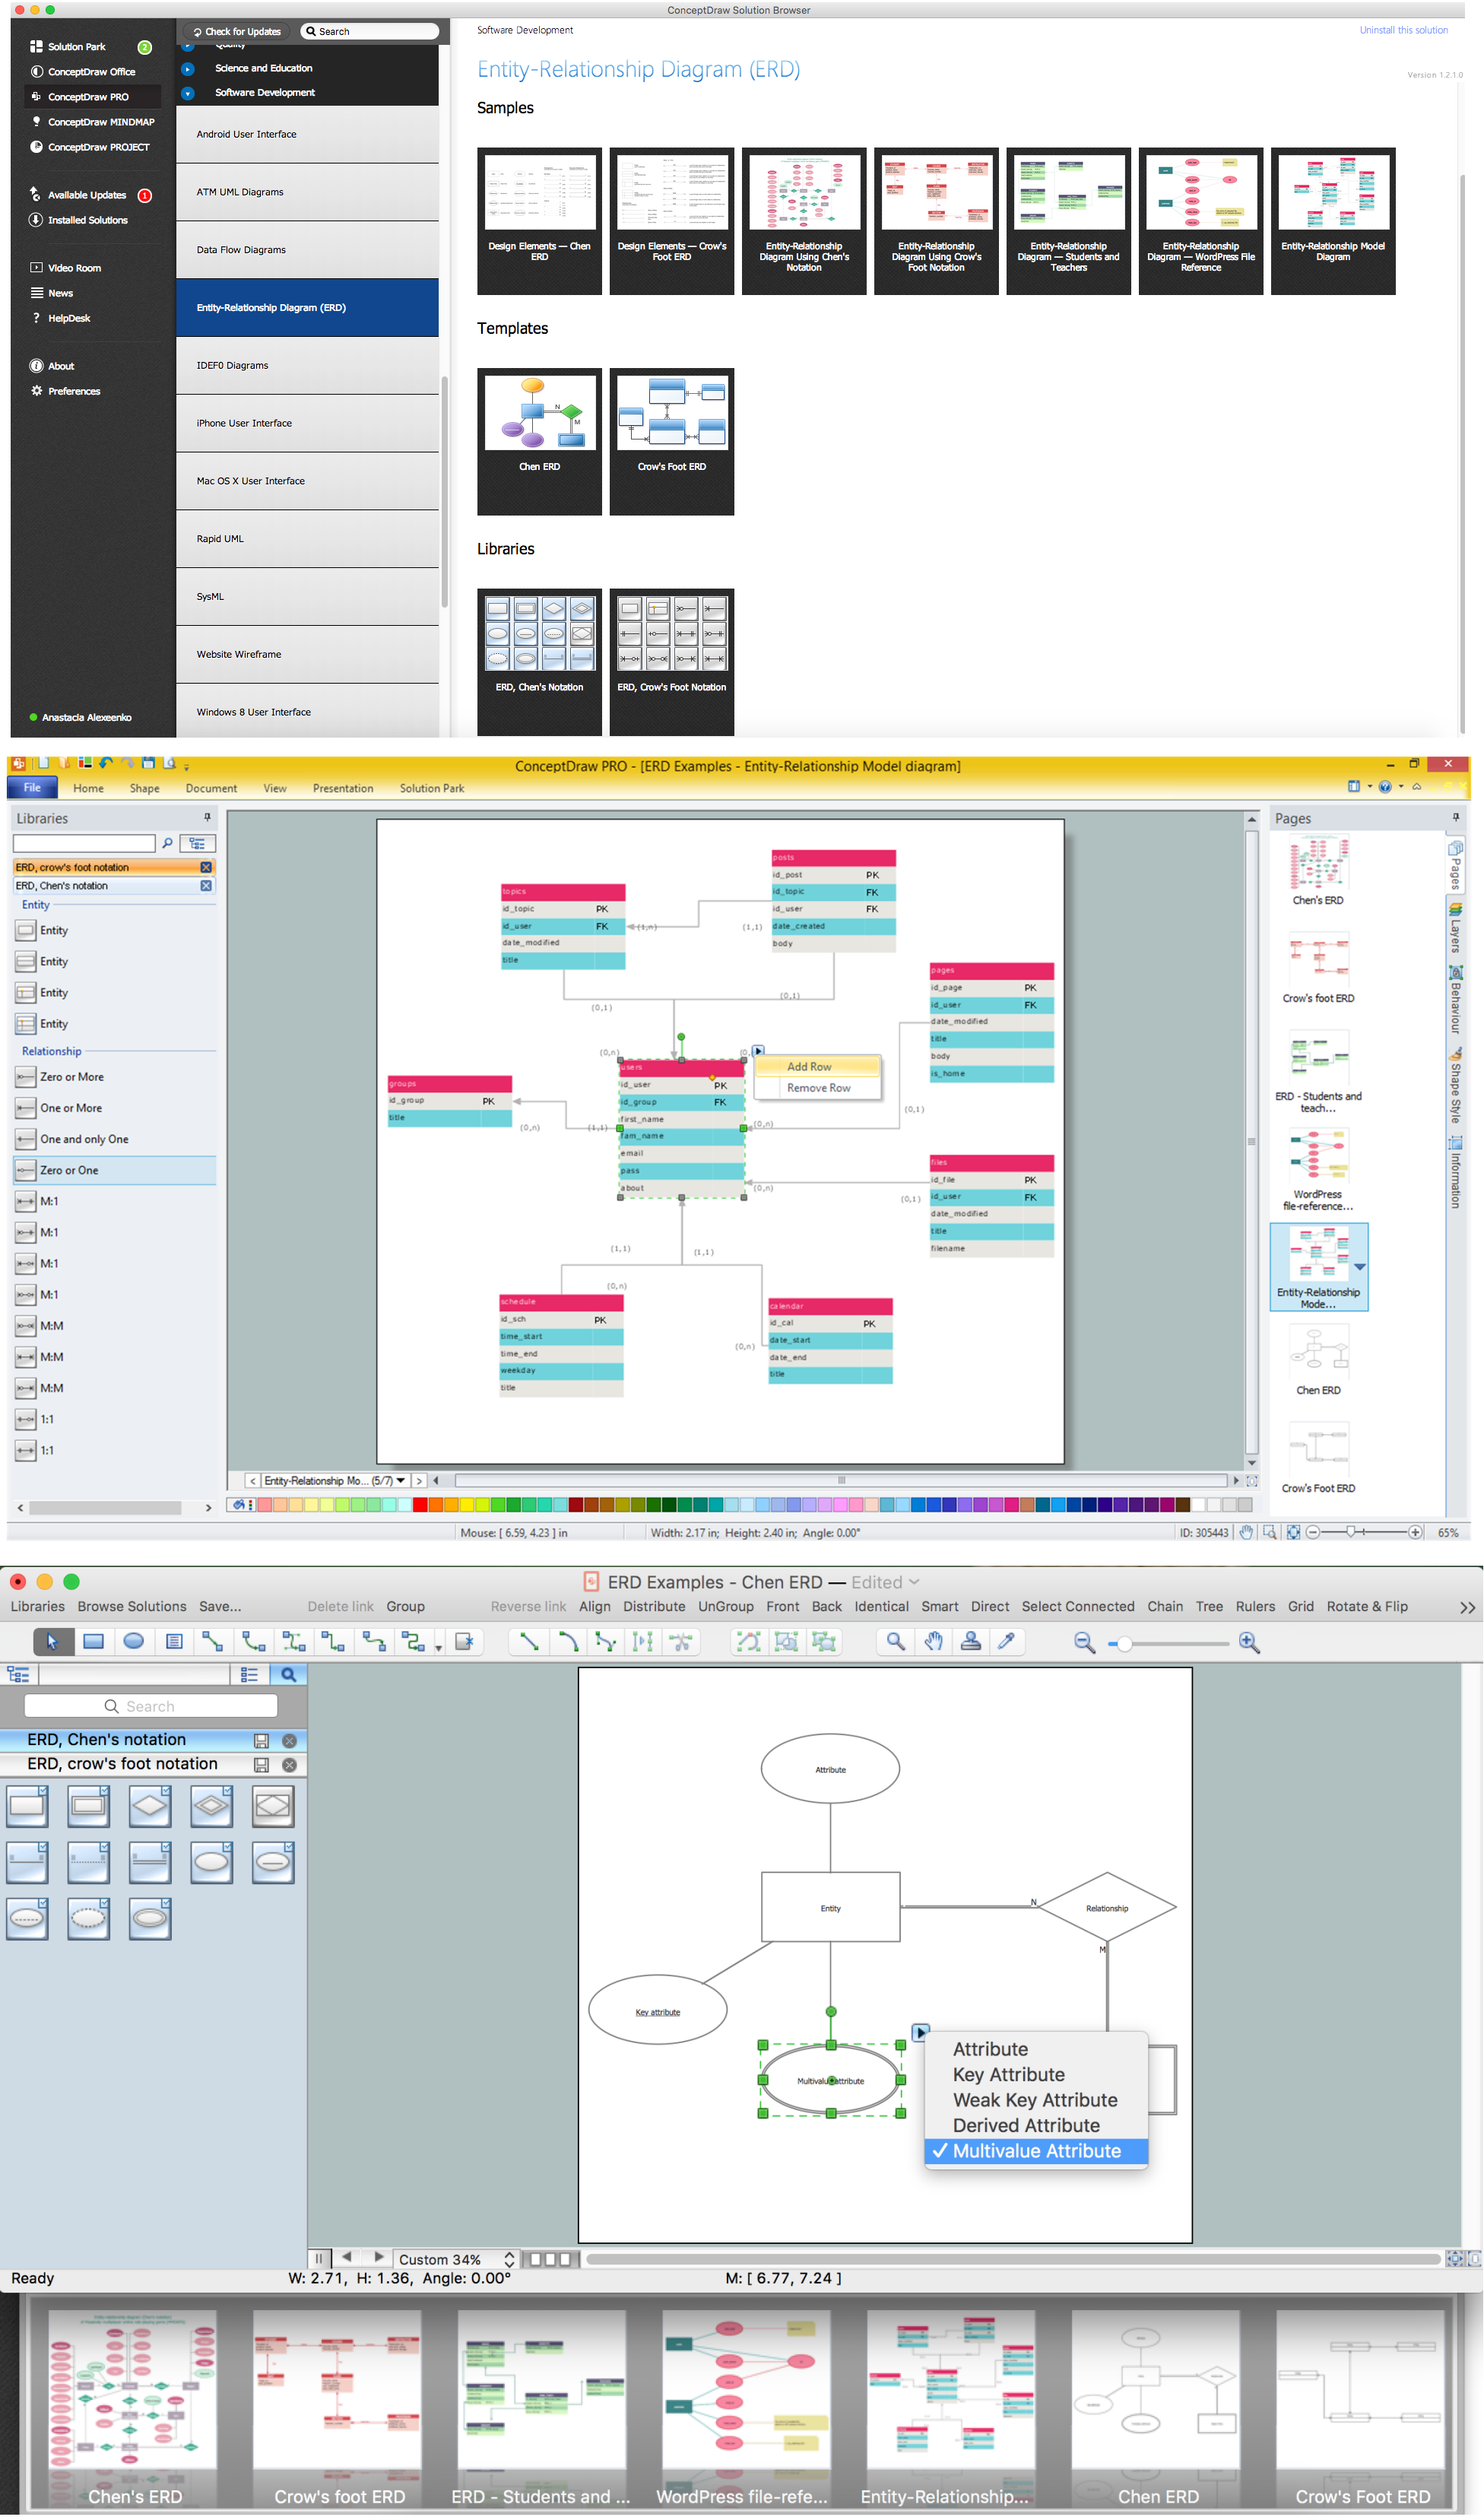
Picture: Entity Relationship Diagram Software
Related Solution:
Both Crow’s Foot and Chen’s notations are used to build database models. Each of them has its’ own features, and if you use a proper entity relationship diagram software, you’ll be able to create diagrams of any notation. Database model with clearly defined entities and relationships between them facilitates further work greatly.
This ERD represents the model of Employee Certification Entity. The entity-relationship diagram is a visual instrument of database software development. It is used to structure data and to define the relationships between structured data groups. This ERD was designed with a help of ConceptDraw Entity-Relationship Diagram (ERD) solution. The solution supports the both basic ERD notations used to describe the structure of database: Chen's and Crow’s Foot notations.
Picture: Entity Relationship Software
Related Solution:
The ER diagram is constructed from the specific ERD graphic elements. There are used 2 types of ERD notations: Chen and Crow's Foot.
A complete set of work flow shapes, notation & symbols for ERD, entity relationship stencils, included in Entity-Relationship Diagram (ERD) solution for ConceptDraw DIAGRAM software, makes drawing diagrams based on ERD notation as smooth as possible.
Picture: Notation & Symbols for ERD
Related Solution:
 Solution in ConceptDraw STORE")
