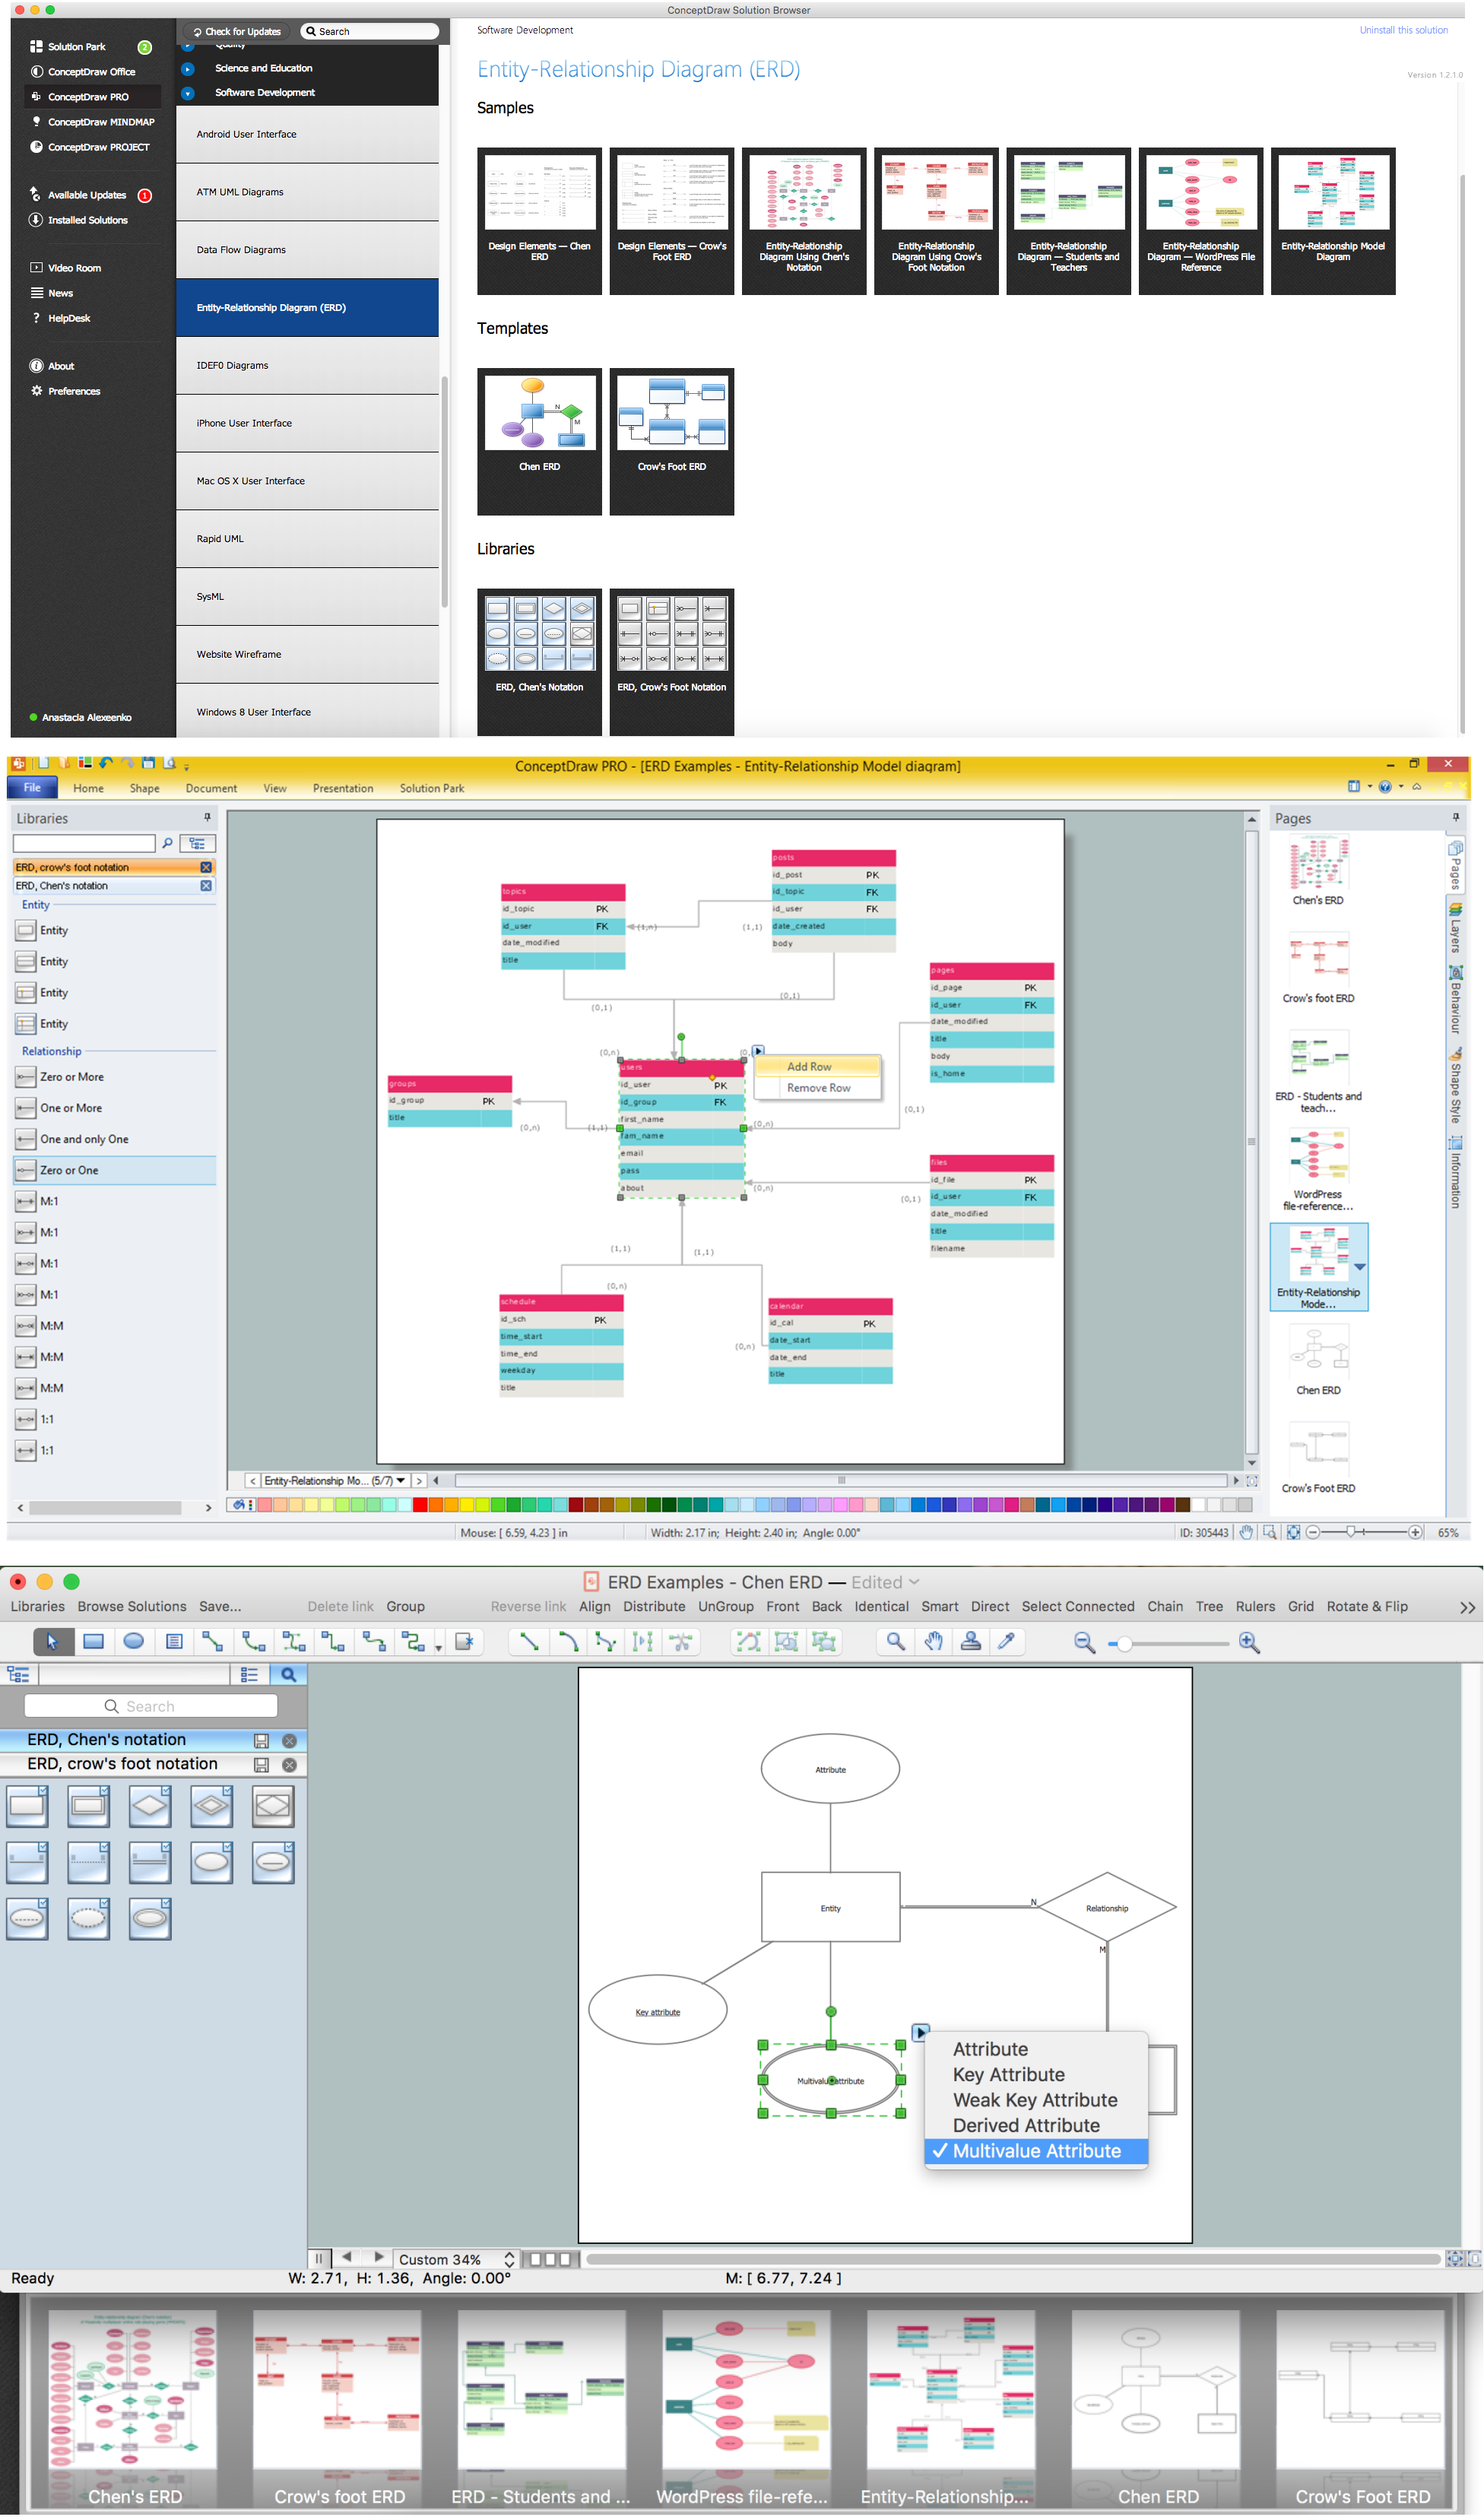
Example 1. Entity Relationship Diagram Software
What are Entity Relationship Diagrams?
Entity relationship diagram (ERD) is a graphical representation the logical structure of the relational databases, the entities and their relationships in a database. The ERDs are created in the process of the Entity-relationship modeling. It is the most important software engineering method for database modeling.
ERD contains three types of the elements: entities that represent the items on which people look for the information, attributes that represent the data related to the entities and relationships that assure a structure for the information.
There are several notations for drawing ERDs of any complexity, the most often are used the Chen's and Crow’s Foot notations.
Chen's notation represents entities as rectangles, and relationships appropriate for first-class objects as diamonds. If an entity set participates in a relationship set, they are connected with a line. Attributes are drawn as ovals and are connected with a line to exactly one entity or relationship set.

Example 2. Entity relationship diagram (ERD), Chen's notation
Crow's Foot notation uses boxes to represent entities, and lines between the boxes to represent relationships. Different shapes at the ends of these lines represent the cardinality of the relationship. Attributes of entity are drawn in the box that represents the entity.

Example 3. Entity relationship diagram (ERD), Crow's Foot notation
The following features make ConceptDraw DIAGRAM extended with Entity-Relationship Diagram (ERD) solution the best Entity Relationship Diagram Software:
- You don't need to be an artist to draw professional looking diagrams in a few minutes.
- Large quantity of ready-to-use vector objects makes your drawing diagrams quick and easy.
- Great number of predesigned templates and samples give you the good start for your own diagrams.
- ConceptDraw DIAGRAM provides you the possibility to use the grid, rules and guides. You can easily rotate, group, align, arrange the objects, use different fonts and colors to make your diagram exceptionally looking.
- All ConceptDraw DIAGRAM documents are vector graphic files and are available for reviewing, modifying, and converting to a variety of formats: image, HTML, PDF file, MS PowerPoint Presentation, Adobe Flash, MS Visio.
- Using ConceptDraw STORE you can navigate through ConceptDraw Solution Park, managing downloads and updates. You can access libraries, templates and samples directly from the ConceptDraw STORE.
- If you have any questions, our free of charge support is always ready to come to your aid.
SEVEN RELATED HOW TO's:
It is very difficult to get into database model idea without any examples. To create one, you can use Chen’s notation for Entity Relationship Diagrams (ERD) and try to see all the peculiarities yourself. This notation describes entities and relations as basic geometric shapes like rectangles and diamonds.
Chen notation for Entity-relationship diagrams is used for designing relational databases. It depicts the database entities as a set of subjects. For example events, people, ideas, etc. All entities has common characteristics (attributes). Any object of the system is identified as the sole and unique. The name of entity should indicate the class or type of the the whole object, not a given example. The connection commonly represents a relationship between entities. Conceptdraw Entity-Relationship Diagrams (ERD) solution provides the libraries with ready-to-use ERD element fitting Chen's notation objects and relationships.
Picture: Design Element: Chen for Entity Relationship Diagram - ERD
Related Solution:
When we start to speak about databases, we must always mention database structure visualization. One of the most common ways to do it is to create an entity relationship diagram, and to put appropriate symbols on it. It is important either for database projecting and for its' future maintenance.
Entity Relationship Diagram describes data elements and their relationships within a database. There are a set of special symbols that depict each element of an entity relationship diagram. Entities - represents some stable components such as supplier, employee, invoice, client, etc. Relation symbols show how the entities interact. Attributes define characteristics of the relationships. Attributes can be one-to-one or many-to-many. Physical symbols is used in the physical models. They represent items such as fields, tables, types and keys. ERD physical symbols are the building material for the database. Notation lines are used to illustrate the relationships. The most common method is Crow’s Feet notation. You can use ConceptDraw Entity-Relationship Diagram (ERD) solution to represent a database using the Entity-Relationship model.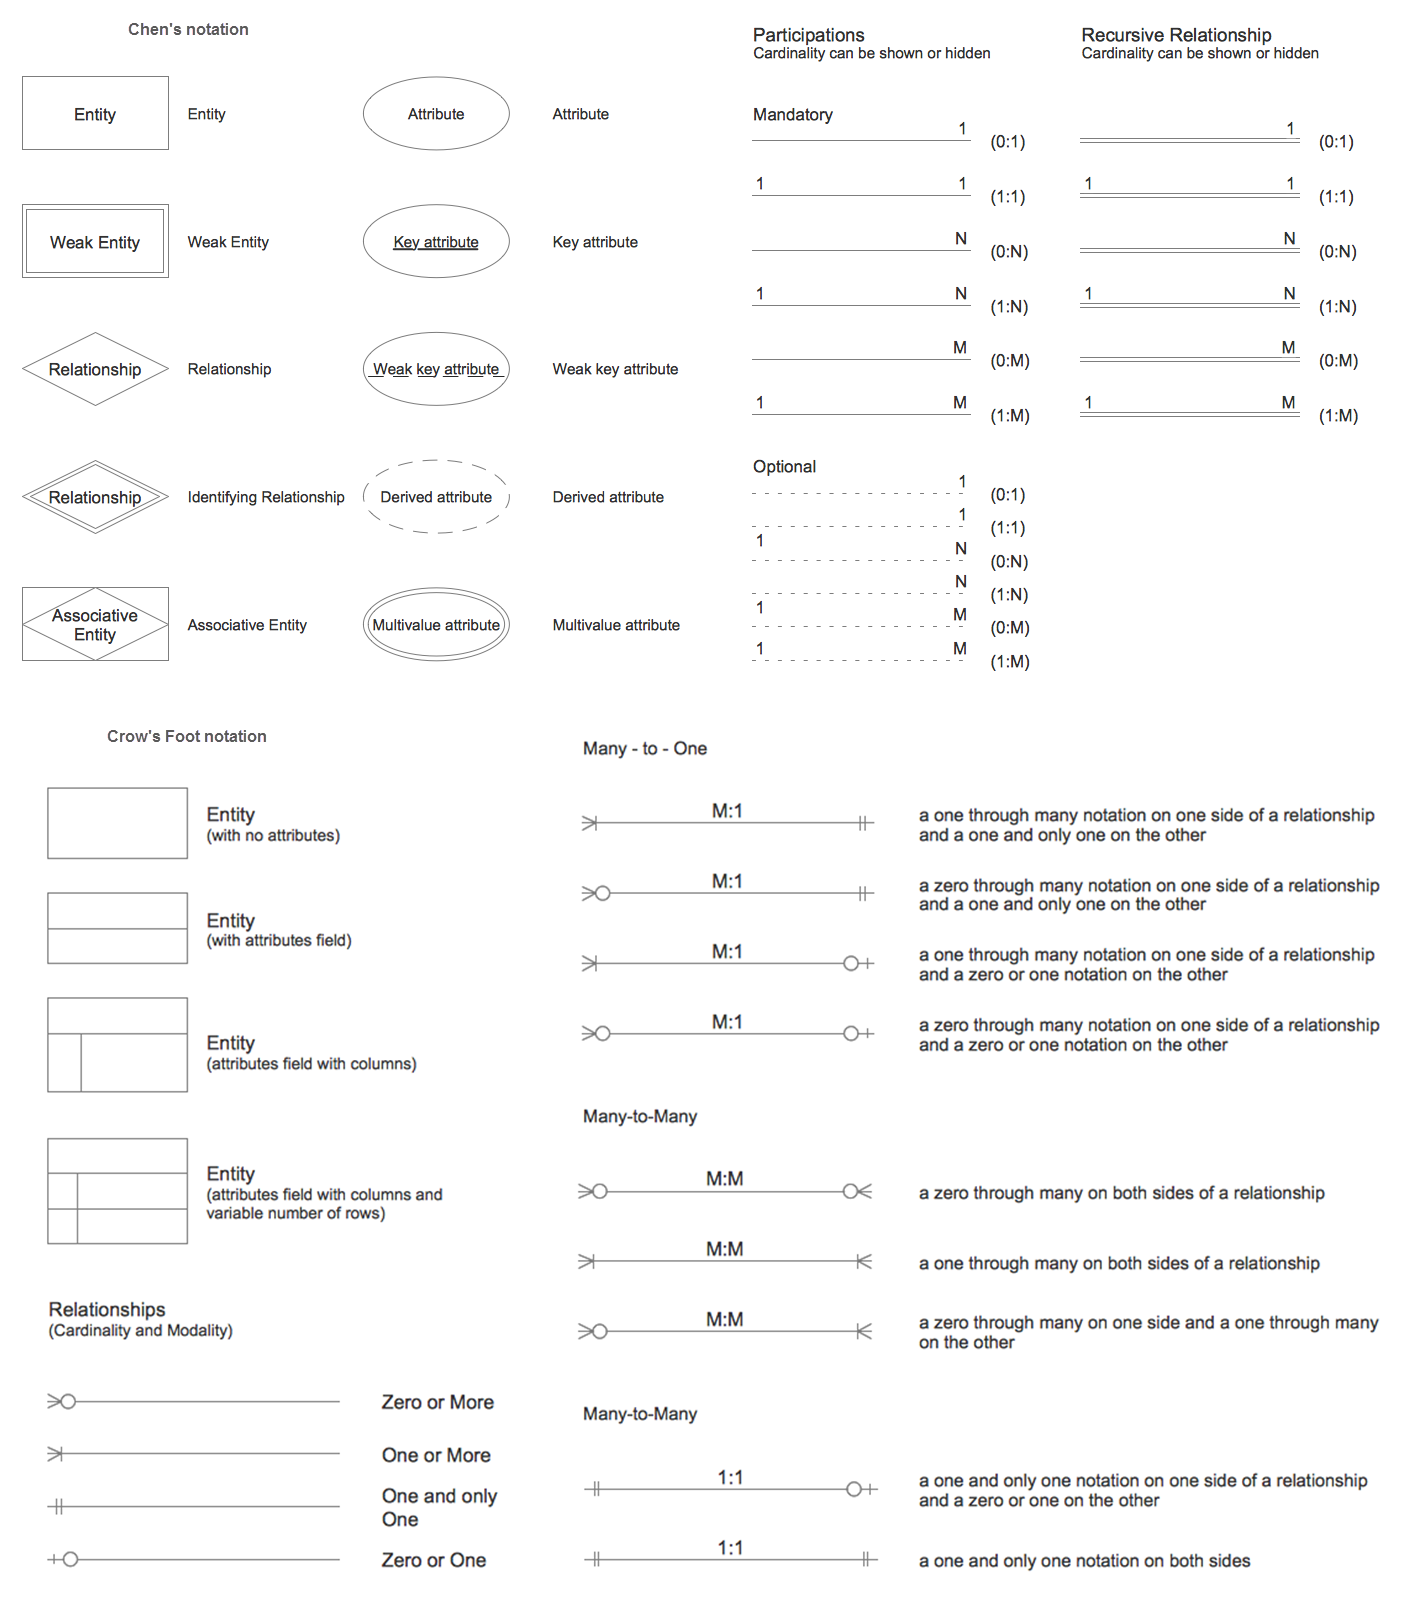
Picture: Entity Relationship Diagram Symbols
Related Solution:
Complexity of databases increases day by day, due to this the Entity relationship models and E-R diagrams become more and more popular, and now are an important part of database design. E-R diagrams created at ConceptDraw DIAGRAM allow visually and graphically represent structure and design of databases.
Picture: E-R Diagrams
Related Solution:
An abstract representation is usually the first thing you will need while developing a database. To understand the ways that databases are structured, you should look through entity-relationship diagram examples and see the notations features and attributes. With an entity-relationship model you can describe a database of any complexity.
This Entity-relationship diagram is a tool for software developers. It enables every element of database to be managed, communicated and tested before release. This ERD was created using symbols advocated by Chen's notation. Because of a linguistic origin of the Chen’s notation, the boxes representing entities could be interpreted as nouns, and the relationships between them are in verb form, shown on a diagram as a diamond.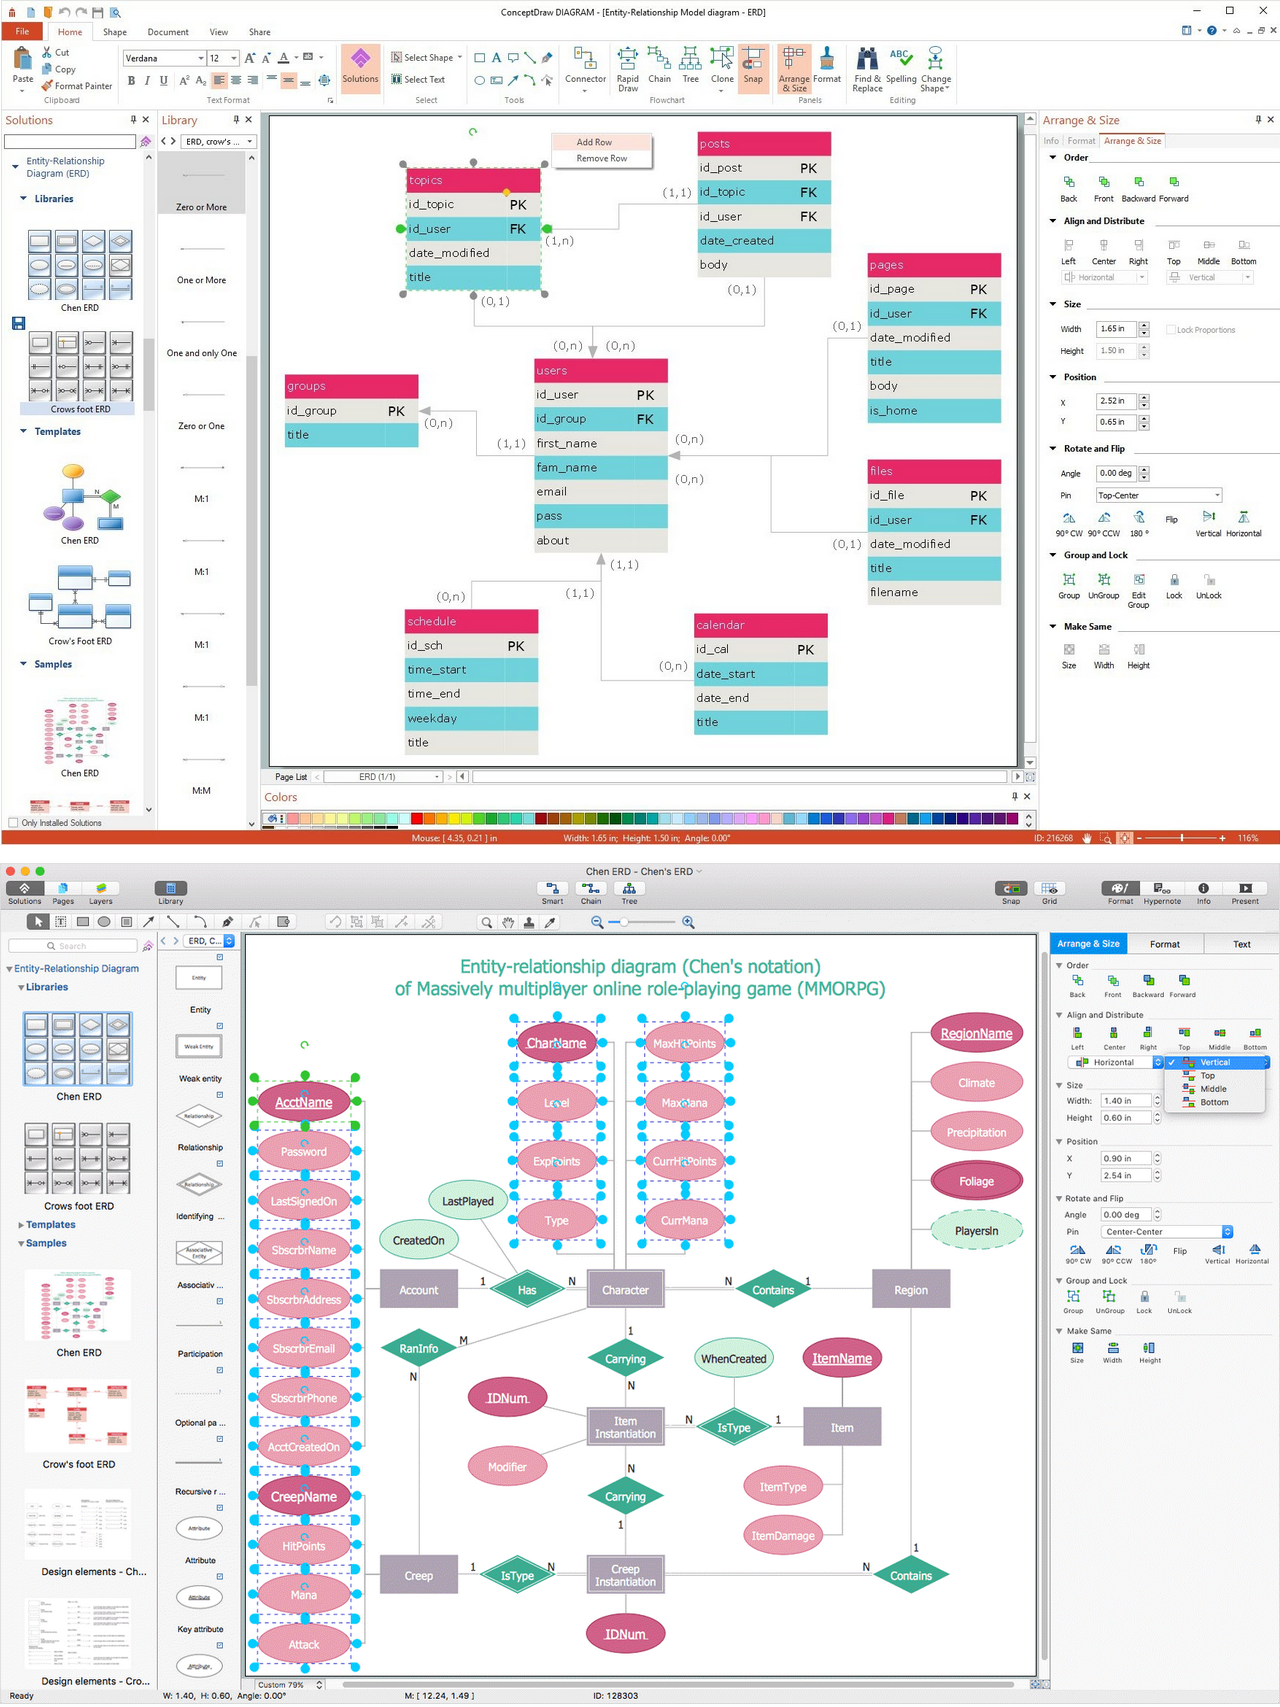
Picture: Entity Relationship Diagram Examples
Related Solution:
There are a lot of structured analysis and design technique methodologies used to describe systems and data sources. To visualize data structures, data flow diagrams can be used for various purposes in the area of software engineering. Nowadays these diagrams are also used in the area of business analysis and information system analysis.
This data flow diagram depicts an account processing system of a typical account department of a small manufacturing enterprise. It shows the data transmission through the order processing to shipping verification. This data flow diagram was created according to standard of Yourdon and Coad notation. The vector graphic objects of Yourdon/Coad notation symbols was delivered by ConceptDraw Data Flow Diagrams solution. The current DFD can be employed as an example of a business process model, representing the set of business events and interactions commonly engaged in a accounts receivable process.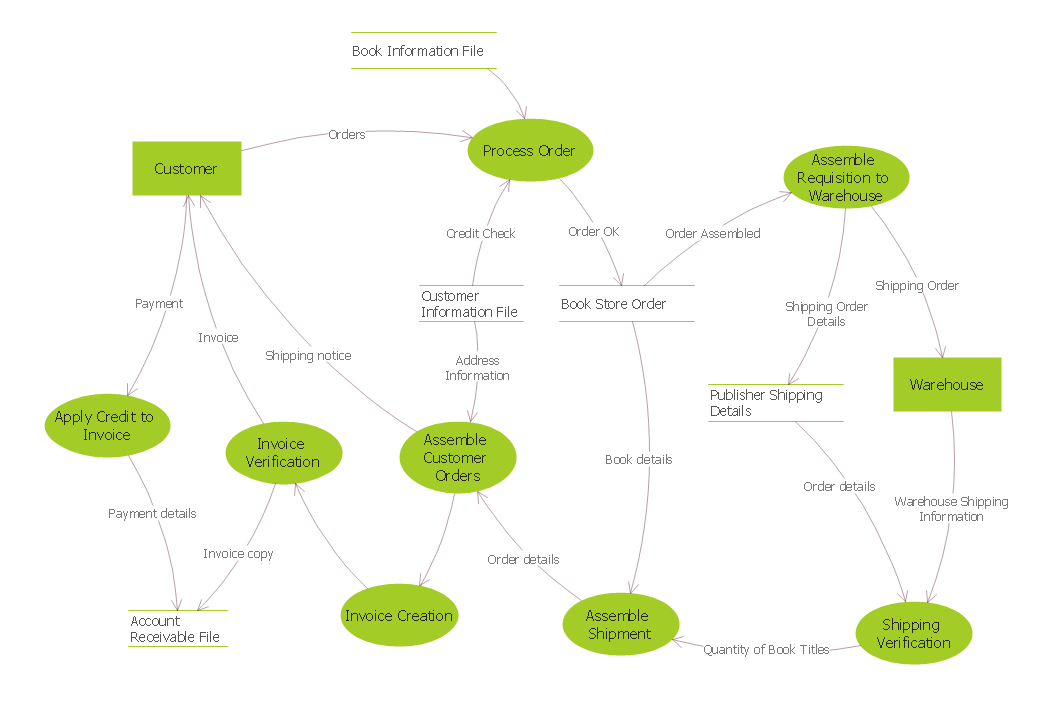
Picture: Data Flow Diagrams
Related Solution:
There are many ways to describe a database structure. One of the most usual is to draw an entity relationship diagram (ERD) using a Crow’s Foot notation to represent database elements. If you don’t want to draw it on paper, you should use an appropriate software.
An entity-relationship (ER) diagram is used to show the structure of a business database. ERD represents data as objects (entities) that are connected with standard relationships symbols which Illustrate an association between entities. ERD, there is a wide range of ERD notations used by data bases architects for reflecting the relationships between the data entities. According to the crow’s foot notation relationships are drawn as single labeled lines designating a certain kinds of relationship. Crow foot notation is a most frequently used ERD standard, because of improved readability of diagrams, with a more accurate use of space on the page._Win_Mac.png)
Picture: Entity Relationship Diagram - ERD - Software for Design Crows Foot ER Diagrams
Related Solution:
ConceptDraw DIAGRAM is a world-class diagramming platform that lets you display, communicate, and present dynamically. It′s powerful enough to draw everything from basic flowcharts to complex engineering schematics.
Video tutorials on ConceptDraw products. Try it today!
Picture: Business Process Mapping — How to Map a Work Process
Related Solutions:

