What is Entity-Relationship Diagram
A database is a data collection, structured into some conceptual model. Two most common approaches of developing data models are:
- UML diagrams
- ER-model diagrams.
What is Entity-Relationship Diagram? Entity relationship diagrams look very similar to flowcharts, the main difference is the symbols provided by specific ERD notations. There are several models applied in entity-relationship diagrams: conceptual, logical and physical.

Example 1. What is Entity-Relationship Diagram, Crow's foot notation
Creating an entity relationship diagram requires using a specific notation. There are several notations of entity-relationship diagram symbols and their meaning is slightly different. Five main components of common ERD notations are Entities, Actions, Attributes, Cardinality and Connections.

Example 2. What is Entity-Relationship Diagram, Chen's notation
ERD notations
The two of notations most widely used for creating Entity-Relationship Diagrams are:
- Chen's notation
- Crow's foot notation.
Crow’s Foot notation is quite descriptive and easy to understand, meanwhile, the Chen notation is great for conceptual modeling. By the way, the Crow's foot notation originates from the Chen's notation - it is an adapted version of the Chen's notation.
Professional ERD drawing implies knowing of ERD symbols and meanings. Entity-Relationship Diagram (ERD) solution from Software Development area of ConceptDraw Solution Park includes icons advocated by Chen's and Crow’s Foot notation that can be used when describing a database.

Example 3. ERD Libraries
In Entity-Relationship Diagram (ERD) solution for ConceptDraw DIAGRAM all entity relationship diagram symbols and meaning, work flow shapes, and entity relationship stencils have easy to understand labels helps you while building Entity Relationship Diagram.

Example 4. Entity-Relationship Diagram Symbols
The Entity-Relationship Diagram (ERD) solution from ConceptDraw Solution Park extends ConceptDraw DIAGRAM ector graphics and diagramming software with the ability to describe a database using the Entity-Relationship model. Use it to draw with pleasure your own professional-looking Entity-Relationship Diagrams using Chen's or Crow's foot notations.
All source documents are vector graphic documents. They are available for reviewing, modifying, or converting to a variety of formats (PDF file, MS PowerPoint, MS Visio, and many other graphic formats) from the ConceptDraw STORE. The Entity-Relationship Diagram (ERD) Solution is available for all ConceptDraw DIAGRAM or later users.
TEN RELATED HOW TO's:
A database is a data collection, structured into some conceptual model. Two most common approaches of developing data models are UML diagrams and ER-model diagrams. There are several notations of entity-relationship diagram symbols and their meaning is slightly different. Crow’s Foot notation is quite descriptive and easy to understand, meanwhile, the Chen notation is great for conceptual modeling.
An entity relationship diagrams look very simple to a flowcharts. The main difference is the symbols provided by specific ERD notations. There are several models applied in entity-relationship diagrams: conceptual, logical and physical. Creating an entity relationship diagram requires using a specific notation. There are five main components of common ERD notations: Entities, Actions, Attributes, Cardinality and Connections. The two of notations most widely used for creating ERD are Chen notation and Crow foot notation. By the way, the Crow foot notation originates from the Chen notation - it is an adapted version of the Chen notation.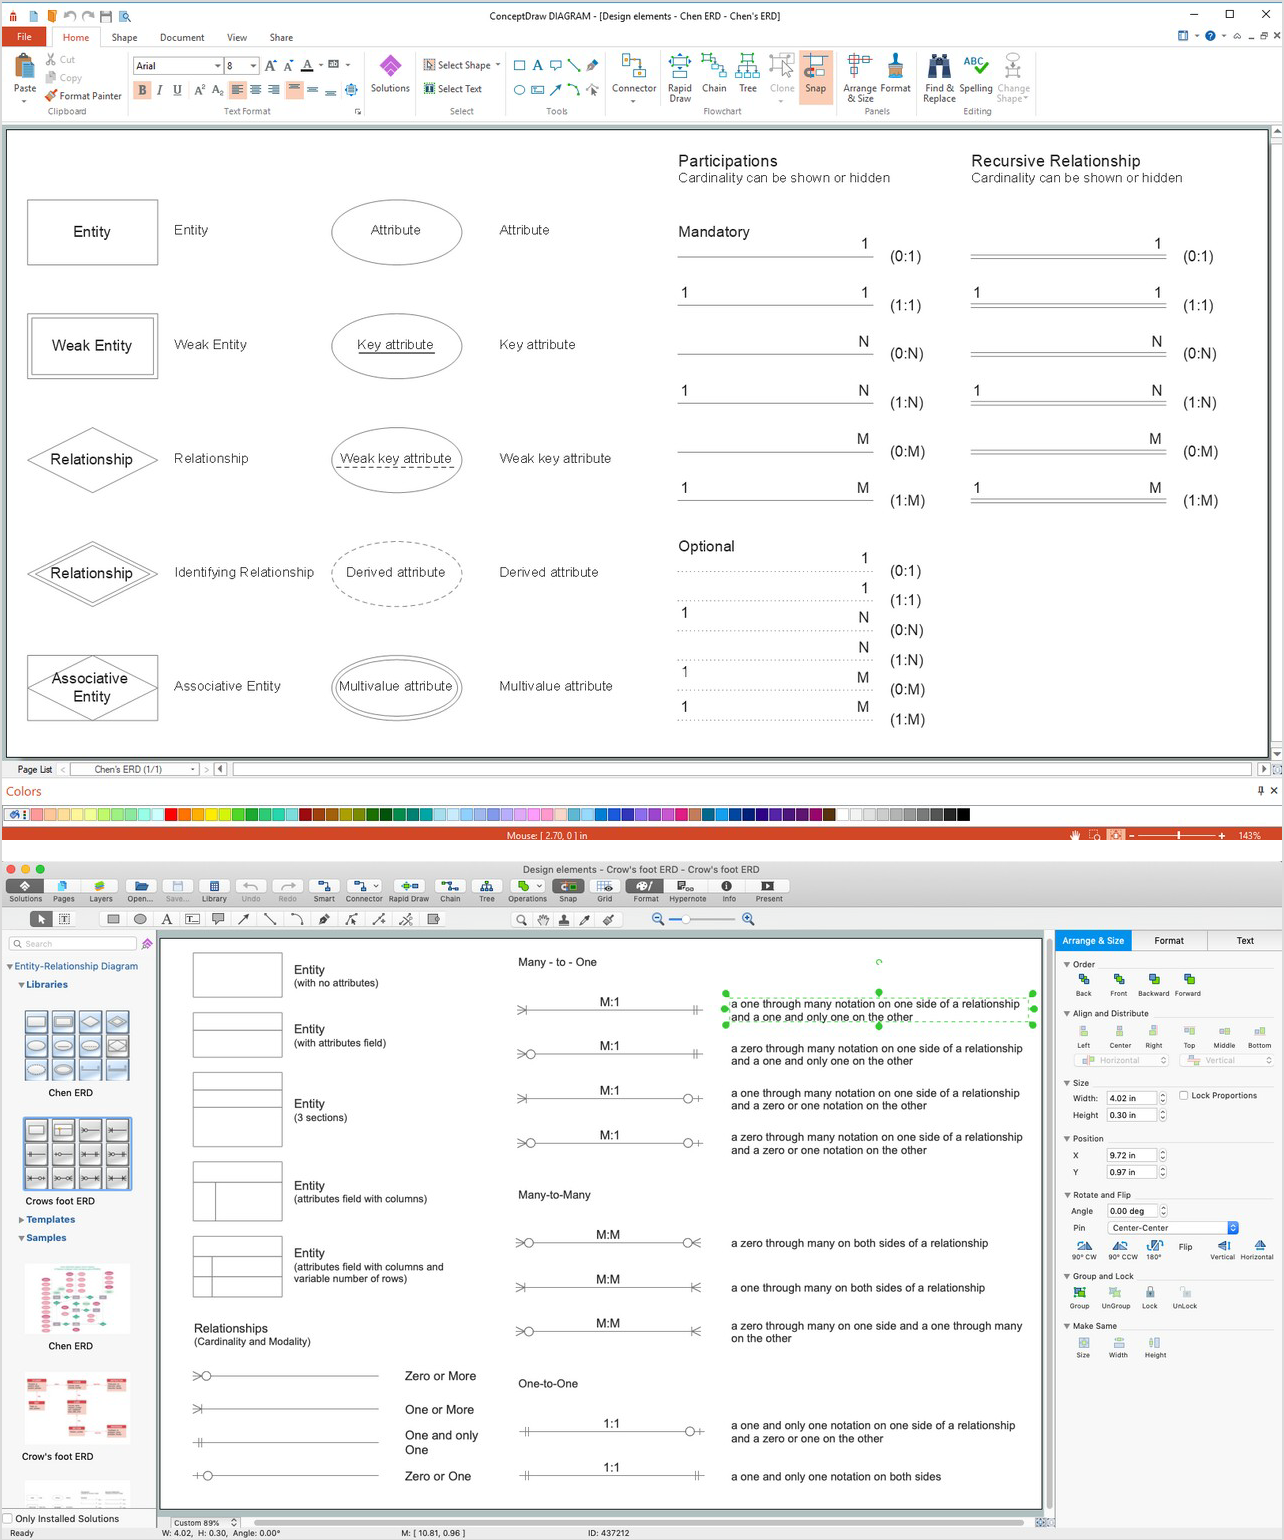
Picture: ERD Symbols and Meanings
Related Solution:
Creating of Entity-Relationship Diagrams (ERDs) is a complex process that requires convenient, automated tools. ConceptDraw DIAGRAM diagramming and vector drawing software offers a powerful ER Diagram Tool - the Entity-Relationship Diagram (ERD) Solution from the Software Development Area.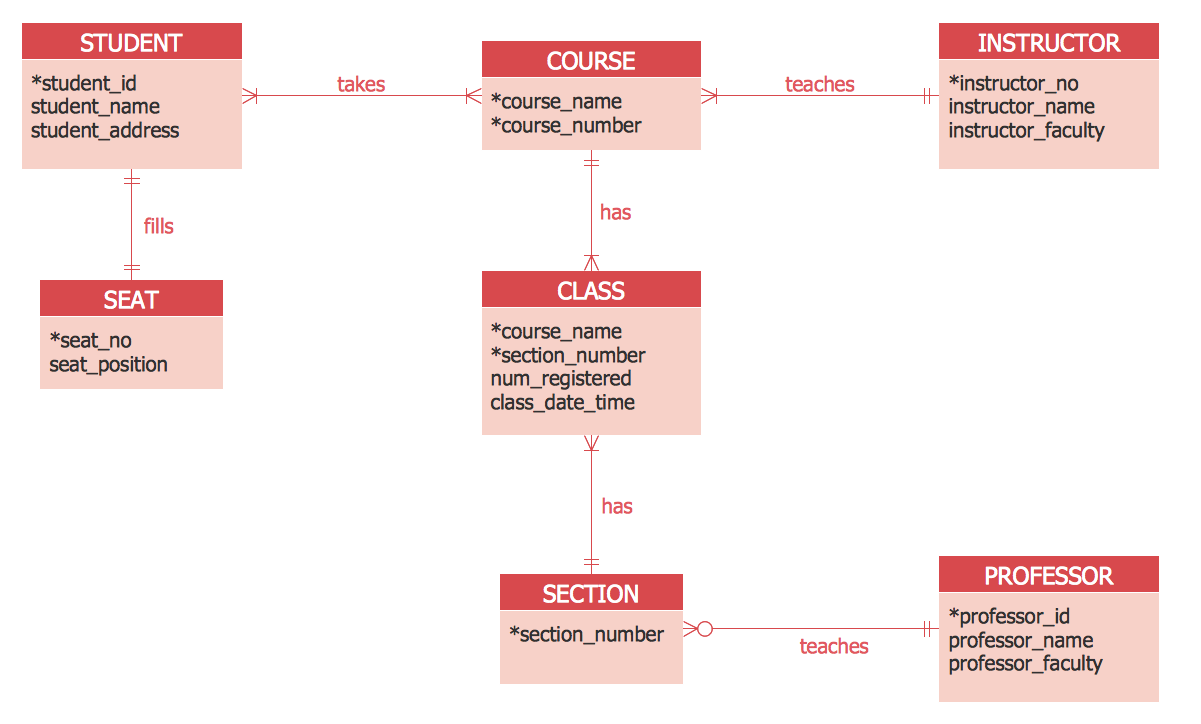
Picture: ER Diagram Tool
Related Solution:
The first thing that usually comes to mind when talking about database models is ER-diagrams, and the ways to create them. The second most recognizable notation is the Crow’s Foot, which visually differs from Chen’s notation. Actually, it doesn’t matter which notation you’ll use for your entity relationship diagram (ERD), but the content is what matters.
When designing an Entity-Relationship Diagram one need to use a certain notated symbols that were developed and standardized especially for databases description. First of them - the Chen’s notation had a linguistic origin. It includes rectangle boxes to show entities that may be described as nouns, and the relationships between them described as verbs depicted in a form of diamond. Finally the Chen’s notation was simplified up to the Crow’s Foot notation. It represents a relationship as labeled line. It is precisely this notation is shown in the given figure. ConceptDraw DIAGRAM together with its Entity-Relationship Diagram (ERD) solution is designed to support professionals who deals with creating ER diagrams using the element of both - Chen’s and Crow's Foot notations.
Picture: Design Element: Crows Foot for Entity Relationship Diagram - ERD
Related Solution:
ConceptDraw DIAGRAM - business process modeling software for mac offers the Business Process Diagram Solution with powerful tools to help you easy represent the business processes and create the business process diagrams based on BPMN 1.2 and BPMN 2.0 standards that allows to create of both simple and complex (nested) models of processes.
There are 16 BPMN 1.2 and BPMN 2.0 stencil libraries containing 230 vector objects: Rapid Draw library, Connections library, Gateways and Artifacts libraries, Data library, Gateways library, Choreographies library, Conversations library, Activities libraries, Events libraries, Expanded Objects libraries, Swim lanes libraries.
Picture: Business Process Modeling Software for Mac
Related Solution:
Create business process diagrams (BPMN 2.0.) with ConceptDraw using professional looking templates. ConceptDraw is business process improvement tools.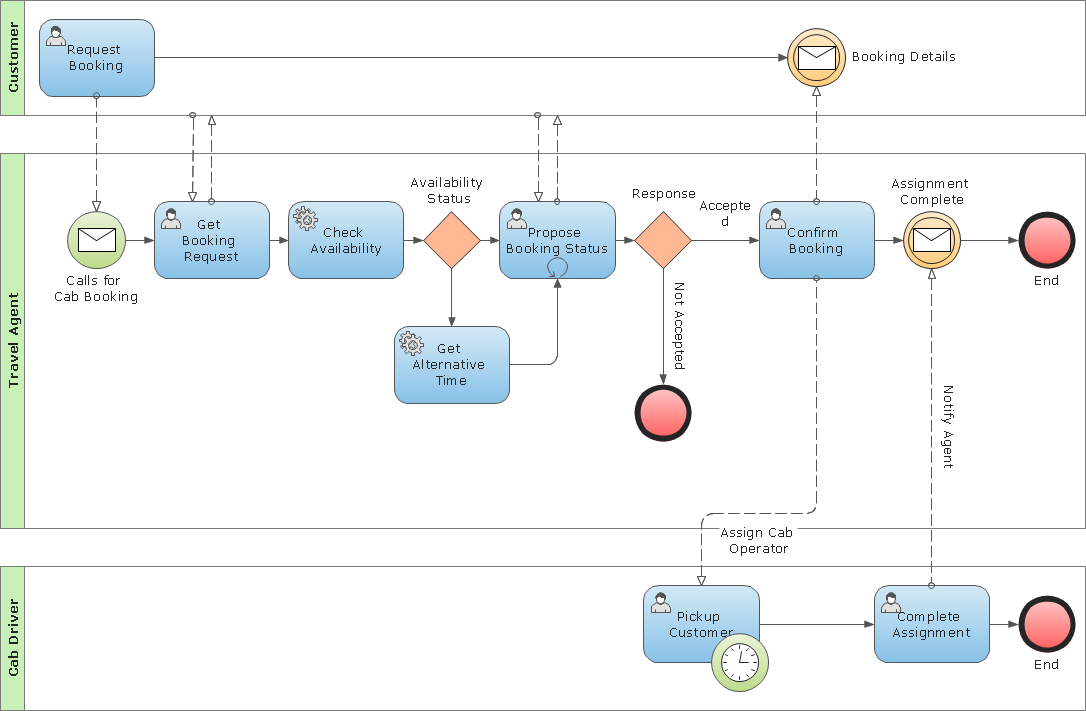
Picture: Business Process Modeling Notation Template
When creating ER diagrams, you can apply different color ER diagram styles and also notation styles. ConceptDraw DIAGRAM enhanced with Entity-Relationship Diagram (ERD) Solution gives the ability to draw visual and attractive ER Diagrams using the style icons from Crow’s Foot notation and Chen's notation professionally designed and offered by ERD Chen's Notation and ERD Crow’s Foot Notation libraries.
Picture: ER Diagram Styles
Related Solution:
It is easy to recreate any informational system structure using diagrams. There are three main components of any ER diagram: entity, attribute and relationship. Basing on these three components, one can define other, less used elements, such as weak entity or relationship, derived attribute, recursive relationship etc.
This is the set of graphic elements of ERD Chen's notation. This ERD notation is used to represent an entity–relationship models. It involves the set of geometric forms: rectangles - depicting entities, ovals - representing attributes and diamonds depicting relationships assigned for first-class objects, that can have relationships and attributes of their own. Connections are displayed with arrowed lines. It is known that the Chen's ERD notation is used to show a detailed view of entities and relationships. ConceptDraw Entity-Relationship Diagram solution from the Software Development section of Solution Park provides the ability to create ERD of database structure for software development purposes using the Chen’s notation elements.
Picture: Components of ER Diagram
Related Solution:
Entity Relationship Diagram (ERD) is the world-known way to show the logical structure of databases in visual manner. The best software tool for drawing Entity-Relationship Diagram is ConceptDraw DIAGRAM vector graphics software with Entity-Relationship Diagram (ERD) solution from Software Development area which gives the ability to describe a database using the Entity-Relationship model. The vector graphic diagrams produced using this solution can be successfully used in whitepapers, presentations, datasheets, posters, or any technical materials.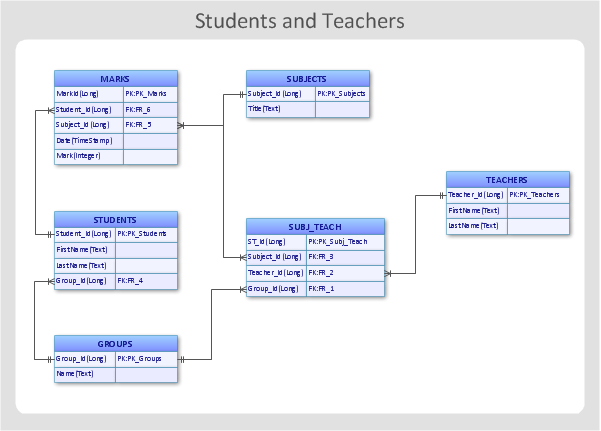
Picture: Entity-Relationship Diagram
Related Solution:
Interior design is an art of planning and coordinating the space in a building or on a floor to produce a charming and convenient environment for the client. You can ask professionals for help, or you can create floor plans easily with ConceptDraw DIAGRAM , using diverse libraries or altering numerous templates. You don’t need no formal training anymore to be a designer, isn’t it great?
Using a ConceptDraw DIAGRAM floor plan software makes depicting of home or office layout ideas a simple task. It does not require special skills to make detailed and scaled floor plans. Adding furniture to design interior is also a breeze. You can draw and furnish your floor plans with a floor plan software. Moreover, using software for floor planning you gain an opportunity to share your plans and high-resolution images of your designs with clients or stakeholders.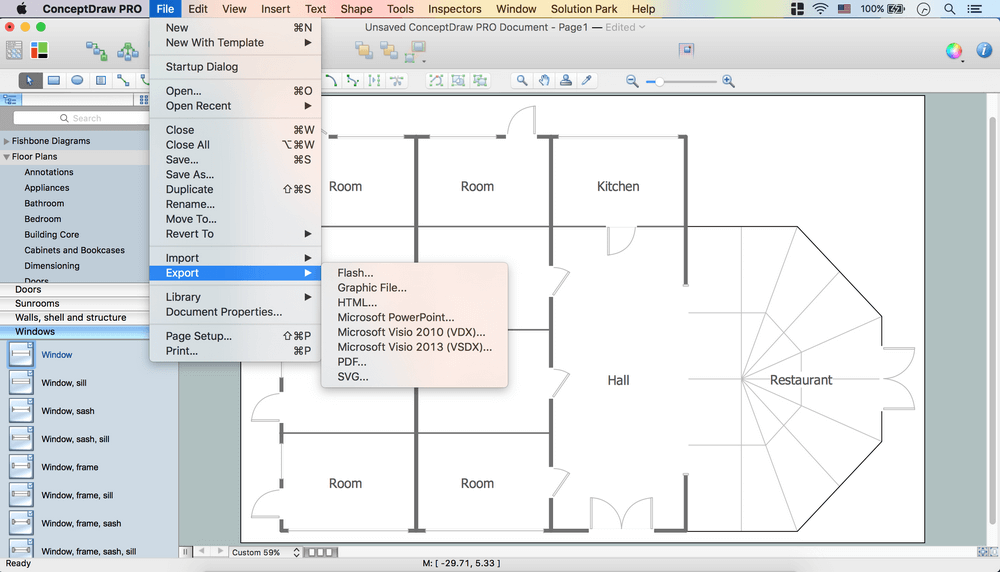
Picture:
Create Floor Plans Easily
with ConceptDraw DIAGRAM Floor Design Software
Related Solution:
ConceptDraw offers you a number of ready-made organizational chart templates which you can use in your drawing. They are grouped in topical sets as organizational chart template files.
Use the Organizational Charts Solution for ConceptDraw DIAGRAM to create your own Organizational Charts of any complexity quick, easy and effective.
The Organizational Charts designed with ConceptDraw DIAGRAM are vector graphic documents and are available for reviewing, modifying, converting to a variety of formats (image, HTML, PDF file, MS PowerPoint Presentation, Adobe Flash or MS Visio XML), printing and send via e-mail in one moment.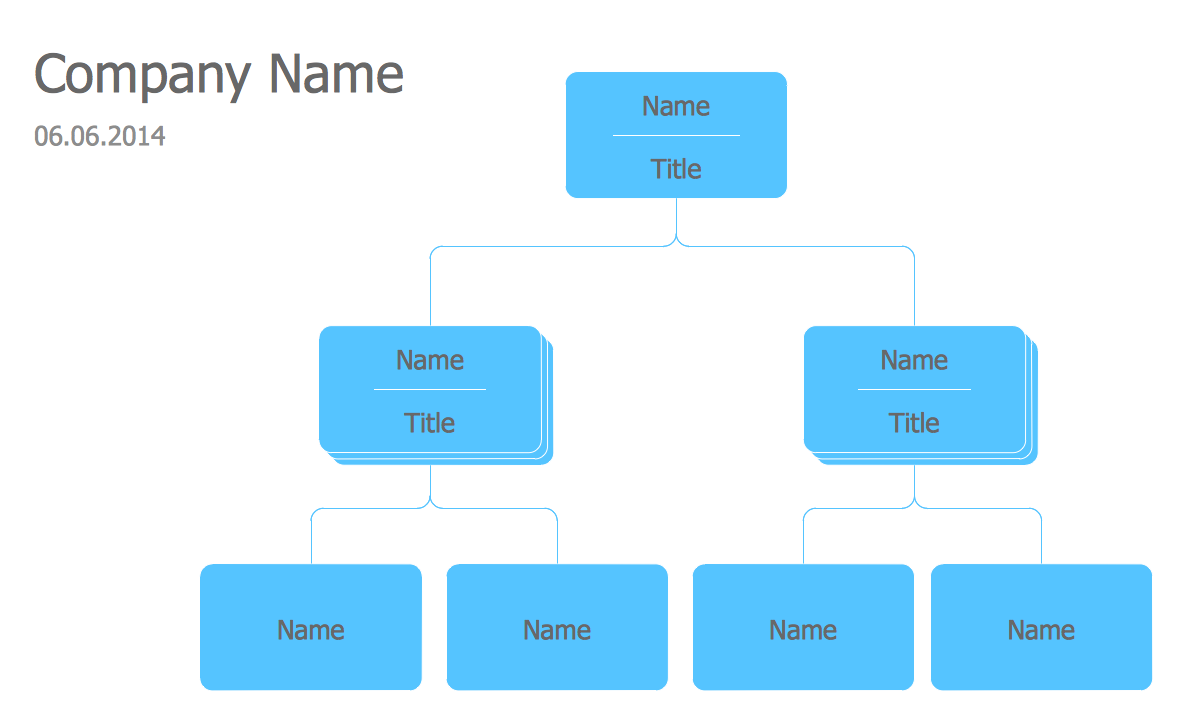
Picture: Organizational Chart Templates
Related Solution:


