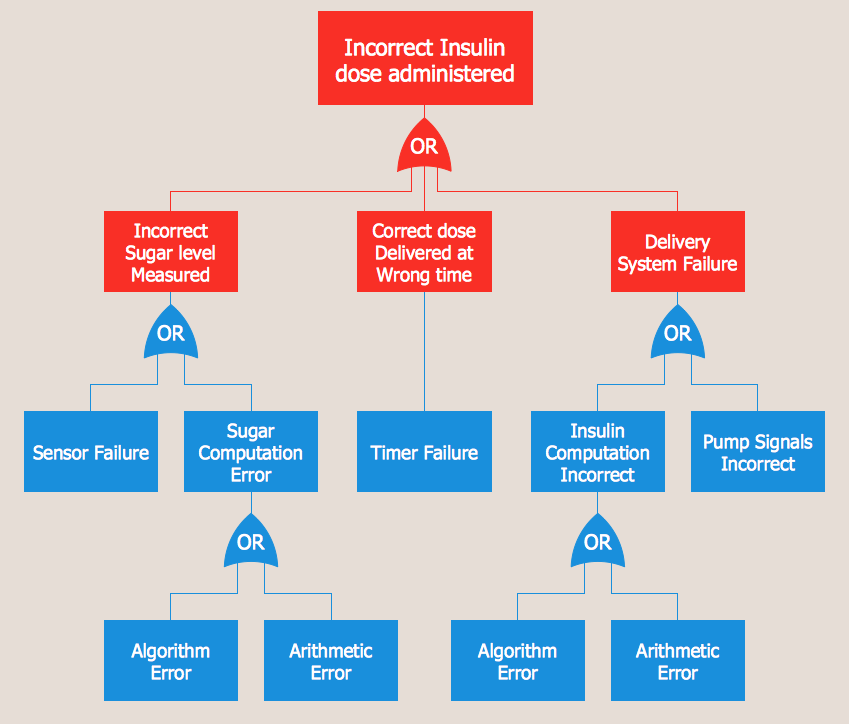
Example 1. Fault Tree Analysis Example
Fault Tree Analysis Diagrams Solution is rich for predesigned samples, templates, and ready-to-use vector elements developed and grouped in Fault Tree Analysis Diagram library.

Example 2. Fault Tree Analysis Diagram Library Design Elements
Variety of samples is available from ConceptDraw STORE. Any Fault Tree Analysis example or template included in Fault Tree Analysis Diagrams Solution can be used as the base for quickly design your own FTA Diagram.

Example 3. Fault Tree Analysis Diagram Template
The Fault Tree Analysis example and template you see on this page were created in ConceptDraw DIAGRAM using the Fault Tree Analysis Diagrams Solution. You can find them in Fault Tree Analysis Diagrams section of ConceptDraw STORE.
Use the Fault Tree Analysis Diagrams Solution for ConceptDraw DIAGRAM software to create your own professional looking Fault Tree Analysis Diagrams quick, easy and effective.
All source documents are vector graphic documents. They are available for reviewing, modifying, or converting to a variety of formats (PDF file, MS PowerPoint, MS Visio, and many other graphic formats) from the ConceptDraw STORE. The Fault Tree Analysis Diagrams Solution is available for all ConceptDraw DIAGRAM or later users.
FIVE RELATED HOW TO's:
Learn about Systems Engineering, its process and discover practical examples illustrated through diagrams. ✔️ How to draw Systems Engineering diagrams using the ConceptDraw DIAGRAM software?
Picture:
What is a Systems Engineering?
Examples of Systems Engineering Diagrams
Related Solution:
The 7 Management and Planning Tools solution implements well-known methodologies for problem analysis and solving. Different products from the ConceptDraw Office suite can be used as a complete solution for any of the methodologies in this solution. ConceptDraw Office provides visual communication during every stage of work.
Picture: 7 Management & Planning Tools
Related Solution:
Looking for a professional flow chart creator? Learn what a flowchart creator is, see real examples, explore symbol libraries and templates, and follow a step-by-step guide to create flowcharts in ConceptDraw DIAGRAM with the Flowcharts Solution.
Picture: Flow Chart Creator
Related Solution:
Data structure diagram (DSD) is intended for description of conceptual models of data (concepts and connections between them) in the graphic format for more obviousness. Data structure diagram includes entities description, connections between them and obligatory conditions and requirements which connect them. Create Data structure diagram with ConceptDraw DIAGRAM.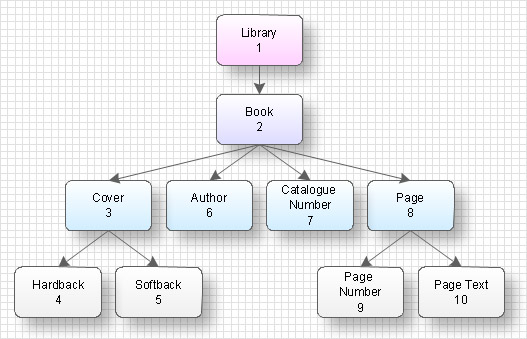
Picture: Data structure diagram with ConceptDraw DIAGRAM
It's no secret that there is a list of skills that every average system administrator should have. And it's important to be able to manage domains via active directory technologies. The best way to keep all the details in mind is to draw a diagram representing users, groups and domains.
This diagram represents an Active Directory Services (Active Directory Domain Services). It can be helpful for system and network administrators to organize a network physical and logical elements (domains, data bases, servers, network equipment, end-user computers etc.) into a secure and logical structure. The logical structure of Active Directory is a hierarchical organization of all network components. The data that is stored in Active Directory comes from some diverse sources. The Active Directory diagram created using ConceptDraw Active Directory Diagram solution. It shows allocating group policies and functions assigned to end users. It helps to plan, manage and maintain the certain user access scenario.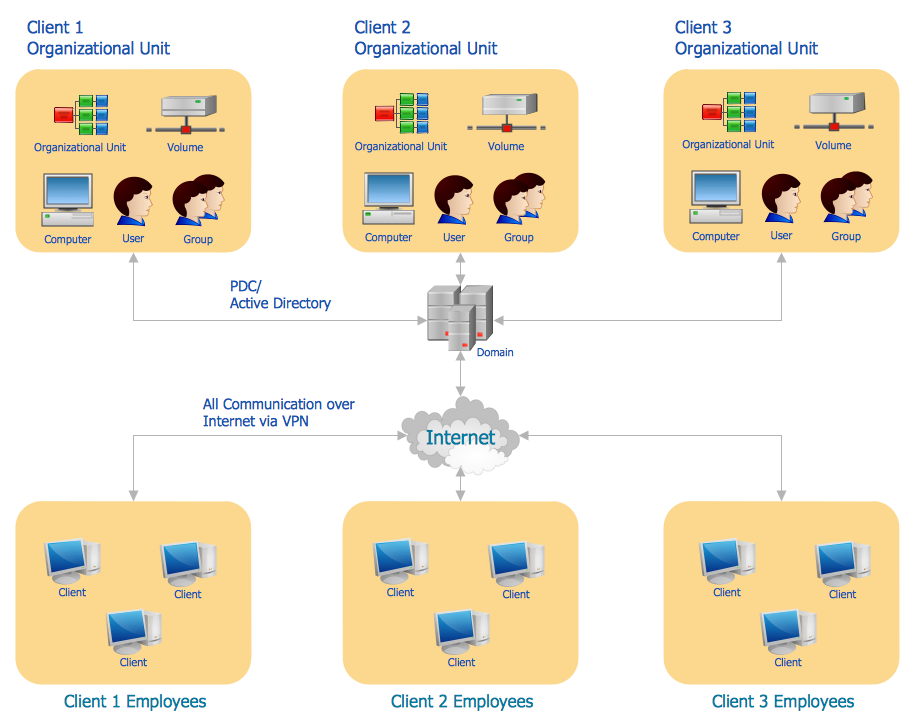
Picture: Active Directory Diagram
Related Solution:

