Growth-Share Matrix Software
The growth–share matrix can be always created in ConceptDraw DIAGRAM within only a few minutes in case you have the Matrices Solution downloaded from ConceptDraw STORE to use its examples as the drafts for your own matrices.
The mentioned matrix can be also called as the “product portfolio” one. The other names for it can be the following: BCG-matrix, Boston matrix, Boston Consulting Group analysis, Boston Box or even a “portfolio diagram”. The growth-share matrix is simply a chart created for the first time in 1970 by Bruce D. Henderson. It was made for the Boston Consulting Group in order to help the corporations to analyze their product lines to allocate their resources.
Being involved in the activities of the brand marketing, strategic management, portfolio analysis and product management, such analytical tool may be very useful for you to succeed in what you do. To be able to make such matrix quickly with an easiness, you can simply use ConceptDraw DIAGRAM diagramming and drawing software to help you. As in order to analysis the market performance by using such matrix’s principles you definitely need such a professional drawing application.
To make such matrix, you need to mention all four different types of the existing organizations, such as Dogs, Cash cows, Stars and Question marks. Dogs can be sometimes called as “pets”. They are the units known to be having the low market share in a slow-growing, but mature industry. Such units are usually known to be generating just enough cash for maintaining the business's market share, which can provide the social benefit of providing the jobs. The mentioned section of the growth-share matrix is the one depressing a profitable company's return on assets ratio. It is used by very many different investors so they can judge how well some company is managed. Such Dogs are always expected to be sold off.
Another section which should be mentioned within the growth-share matrix is called the “Cash cows” describing the company engaged in a slow-growing industry having a high market share. Such units are known for generating cash in excess of the amount of cash needed for maintaining the business. They are usually regarded as boring and staid, being involved in the business activity in a mature market, being expected to be "milked" on a constant basis. Usually such units get some investments, but the less of it the better as it can be simply wasted in an industry with a low growth.
The next unit, which has to be described in the growth-share matrix, is the “Stars” one. Such units are known to be having a high market share being involved in a fast-growing industry. They are also known to be the so called graduated “Question marks”, which is the next unit of the growth-share matrix. There’s always a hope each of the stars can become a cash cow one day, but the Stars themselves require lots of funding for fighting the competitors as well as maintaining their growth rate. In case the industry grows too slow, in case they are still the niche leader or those amongst the market leaders, such “Stars” can become the “Cash cows”. Otherwise, the “Stars” become “Dogs” for a reason of the low relative market share.
In case the industry matures and so its growth slows, all of the business units tend to become either “Dogs” or “Cash cows”. Most of the business units are known to be starting as “Question marks”, turned later into “Stars”. When the market stops growing, the business units become the “Cash cows”. At the very end of such cycle, the Cash cow tend to be turned into the “Dogs”.
“Question marks” can also be known as “problem children”. They are the businesses which are known to be operating with a quite low market share working in a high-growth market, being basically the starting points for most of the businesses. Having a potential to gain the market share and so to become the “Stars”, Question marks get the chance to become the “Cash cows” in this way in case the market growth slows. In case these “Question marks” do not succeed meaning they do not become the market leaders, then later they may be degenerated into “Dogs” in case the market growth declines. It is always very important to analyse Question marks very carefully for being able to determine if they are worth the investment which is required for growing market share or not.
Being theoretically useful, the growth-share matrix is the one known to be widely used among the specialists involved in many different spheres of business activity as it was already mentioned before. A few academic studies were carried out to find out if using the growth–share matrix helps a business to succeed or not. There were a few criticisms to the B.C.G Matrix, but in general it is still widely used and treated as if it was one of the best tools for making it possible to evaluate the situation the company is in to know what further steps have to be taken.

Sample 1. ConceptDraw DIAGRAM — Growth-Share Matrix Software
Using the predesigned vector objects from the Matrices library of the Matrices Solution for ConceptDraw DIAGRAM you can draw your own Matrices and also Growth–Share Matrices in minutes.
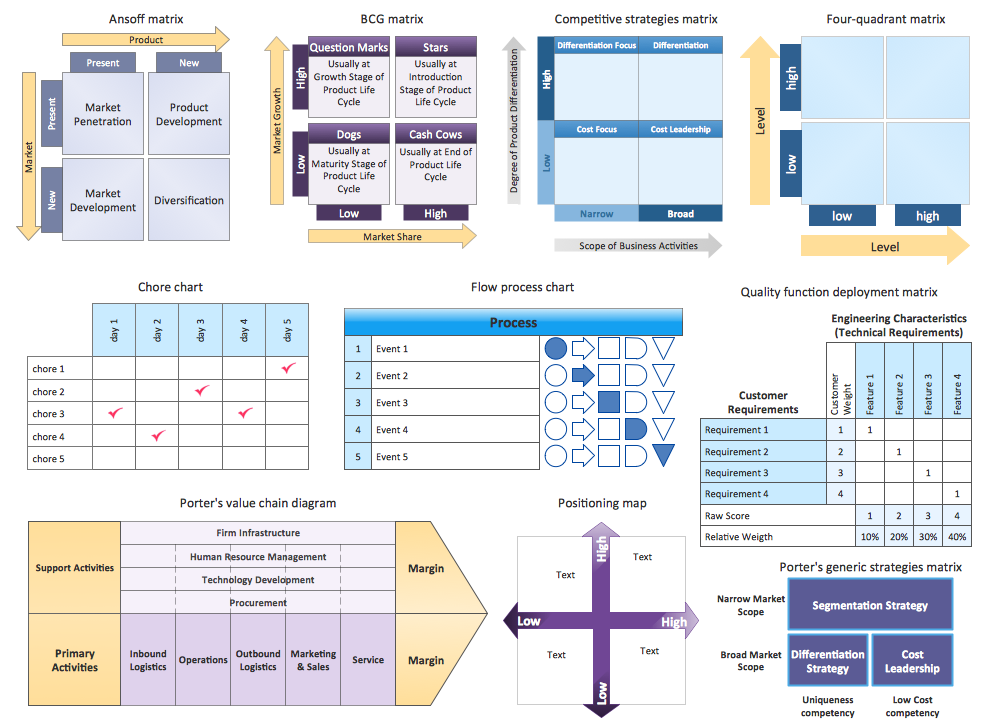
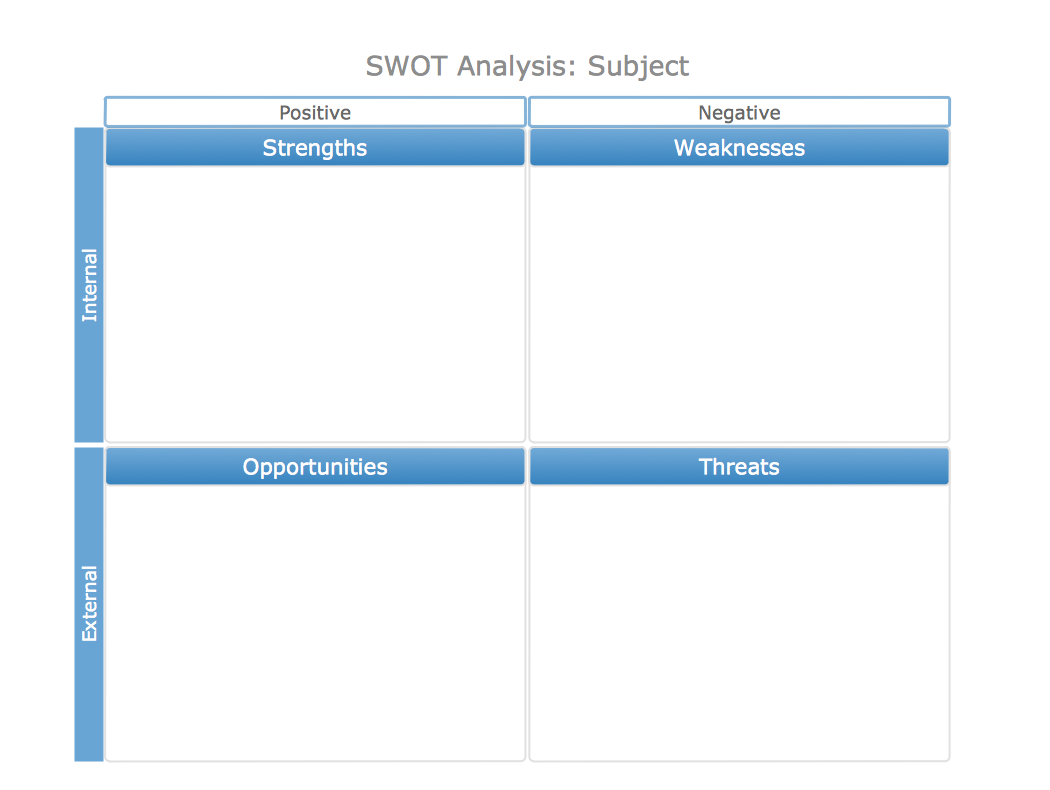
Sample 2. Matrices Library — Design Elements
In order to evaluate the situation taking into consideration the market share of the company or its products it produces, it is very convenient to use ConceptDraw DIAGRAM for making the mentioned growth-share matrix. Having this unique drawing tool means having an opportunity to create some helpful drawing and so to become more successful in what you do by helping your company to achieve the main goals, which are usually known to be those related to it becoming one of the “Cash cows” companies.
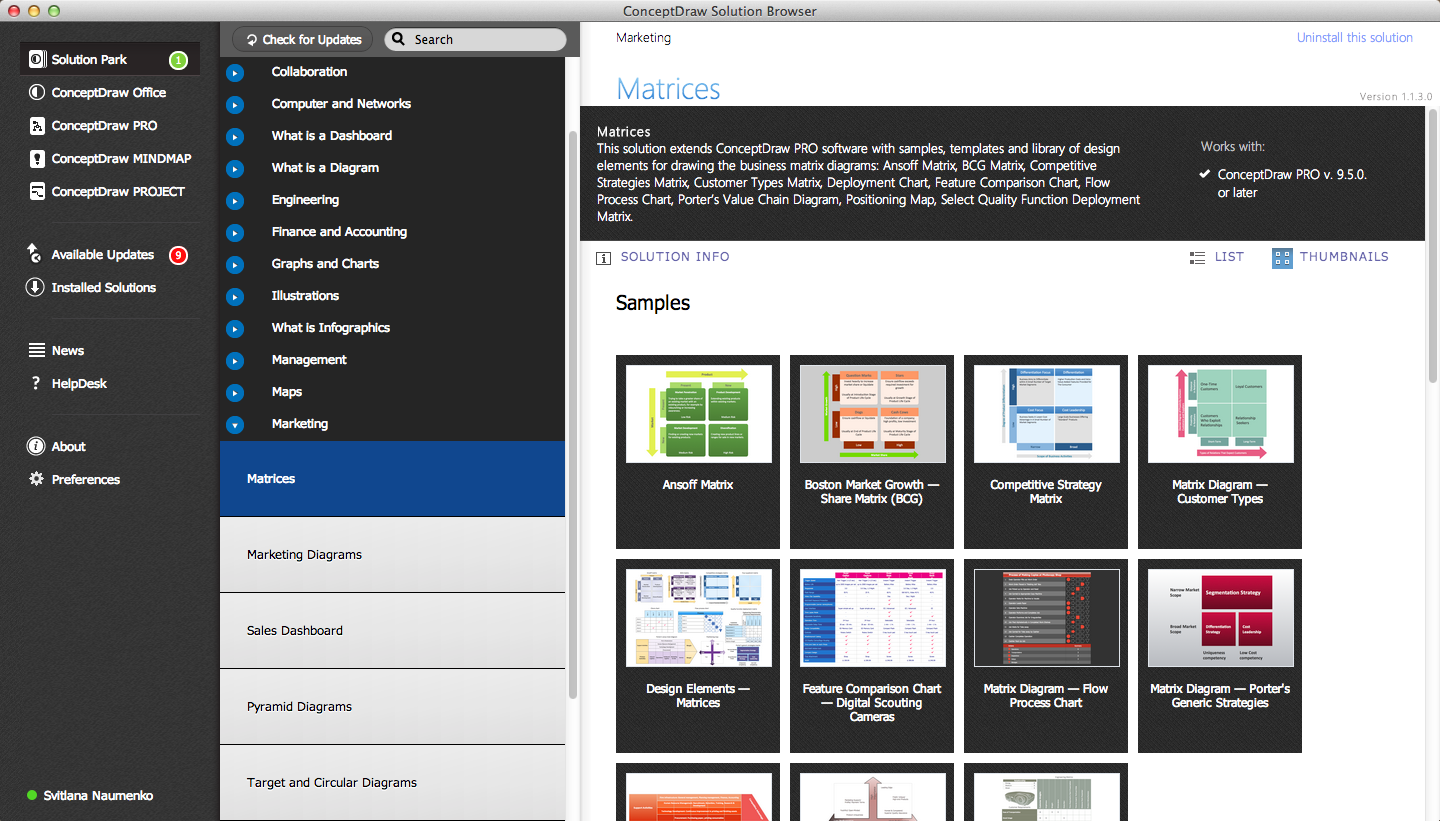
Sample 3. Matrices — ConceptDraw STORE
Having ConceptDraw DIAGRAM software can be enough for making the needed drawings as there are basic tools you can always use for free within the application. But if you want the process of creating such matrices to be more mature, then you can always get the so called ConceptDraw STORE application, available to be downloaded from this site. Having both products of CS Odessa can improve your drawing by providing all the needed drawings tools as well as pre-made examples of the matrices which are all available in the Matrices Solution. Download the mentioned Matrices Solution from ConceptDraw STORE today to simplify your drawing of growth-share matrices you need.

Sample 4. Boston Growth-Share (BCG) Matrix
This sample was created in ConceptDraw DIAGRAM using the Matrices Solution from the Marketing Area of ConceptDraw Solution Park and shows the Boston growth-share (BCG) matrix. It is a popular matrix type in the field of product management and brand marketing that helps to allocate resources.
Use the Matrices Solution for ConceptDraw DIAGRAM to create your own Growth–Share Matrices of any complexity quick, easy and effective.
The Growth–Share Matrices designed with ConceptDraw DIAGRAM are vector graphic documents and are available for reviewing, modifying, converting to a variety of formats (image, HTML, PDF file, MS PowerPoint Presentation, Adobe Flash or MS Visio), printing and send via e-mail in one moment.