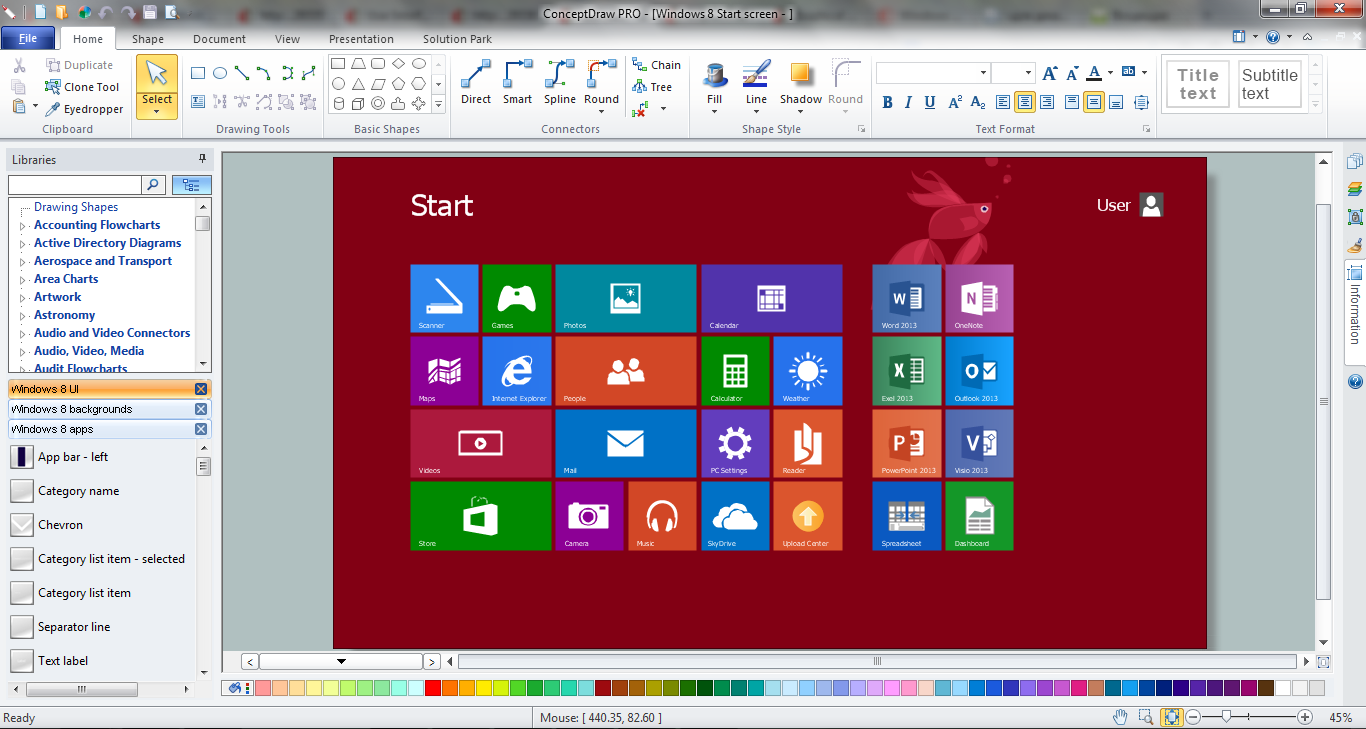
Example 1. ConceptDraw DIAGRAM GUI Software
ConceptDraw DIAGRAM as GUI software proposes you a few variants of quick and easy designing graphical user interfaces for Windows 8. First of them is to use the vector objects from the numerous libraries of Windows 8 User Interface Solution. These 14 libraries contain an incredibly large number of objects for any possible GUI interface. Let's verify this!
The easiest way of Windows 8 GUI interfaces designing is to use the predesigned graphical user interface examples, templates and samples that you can open from ConceptDraw STORE.

Example 2. Windows 8 User Interface Solution in ConceptDraw STORE
All examples offered in ConceptDraw STORE are available for change according to your needs.

Example 3. Windows 8 User Interface Solution - PC Settings
The following features make ConceptDraw DIAGRAM the best GUI software:
- You don't need to be an artist to draw professional looking GUI interfaces in a few minutes.
- Large quantity of ready-to-use vector objects makes your drawing GUI interfaces quick and easy.
- Great number of predesigned templates and samples give you the good start for your own GUI interfaces.
- ConceptDraw DIAGRAM provides you the possibility to use the grid, rules and guides. You can easily rotate, group, align, arrange the objects, use different fonts and colors to make your GUI interface exceptionally looking.
- All ConceptDraw DIAGRAM documents are vector graphic files and are available for reviewing, modifying, and converting to a variety of formats: image, HTML, PDF file, MS PowerPoint Presentation, Adobe Flash, MS Visio.
- Using ConceptDraw STORE you can navigate through ConceptDraw Solution Park, managing downloads and updates. You can access libraries, templates and samples directly from the ConceptDraw STORE.
- If you have any questions, our free of charge support is always ready to come to your aid.
TEN RELATED HOW TO's:
ConceptDraw DIAGRAM diagramming and vector drawing software extended with Mac OS User Interface Solution from the Software Development area is a powerful Mac OS GUI Software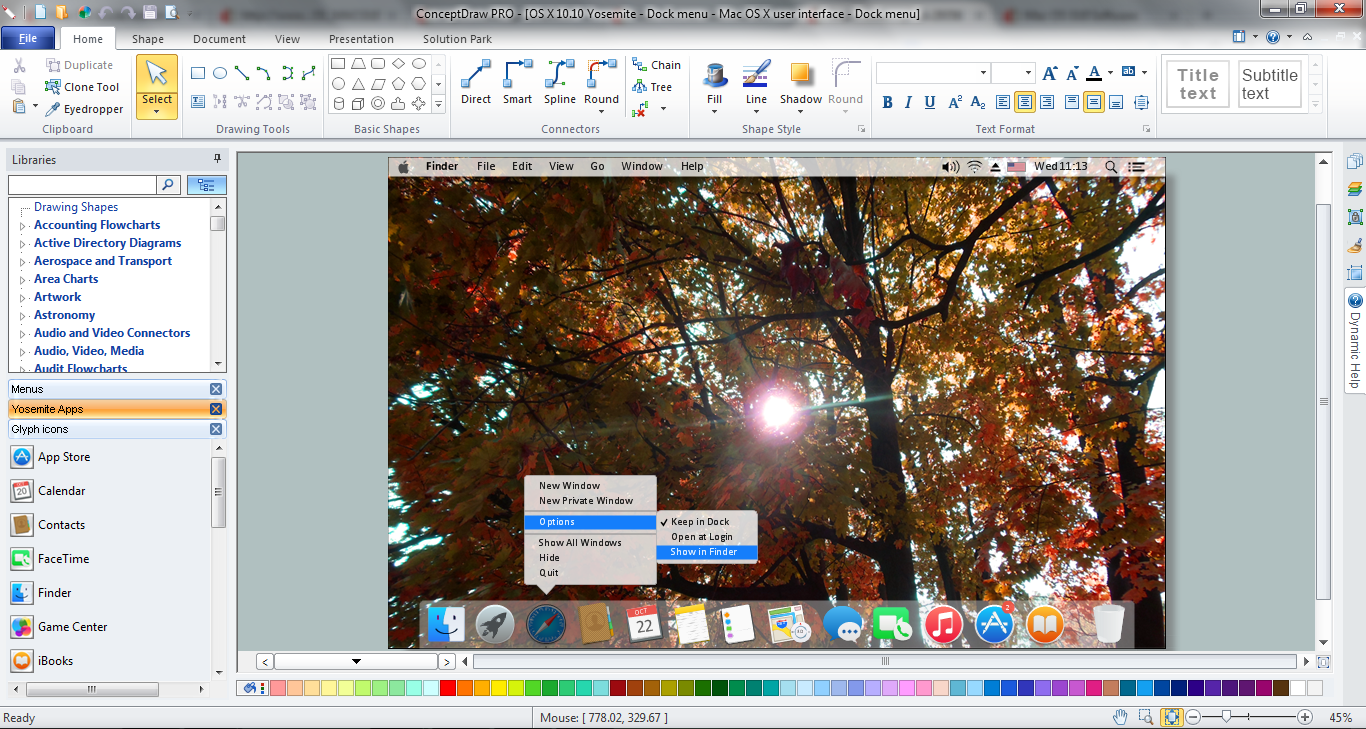
Picture: Mac OS GUI Software
Related Solution:
ConceptDraw DIAGRAM diagramming and vector drawing software extended with Windows 8 User Interface Solution is a powerful GUI Software. Designing of professional looking Windows 8 and Windows 8.1 user interfaces, and Windows 8 UI design patterns never been easier than now with convenient and useful tools of Windows 8 User Interface Solution from the Software Development area.Picture: GUI Software
Related Solution:
ConceptDraw DIAGRAM is a powerful diagramming and vector drawing software. Extended with Windows 8 User Interface solution from the Software Development area, ConceptDraw DIAGRAM became the ideal software for prototype and design professional looking user interfaces for Windows 8 and Windows 8.1. Windows 8 User Interface solution offers you wide variety of user interface design examples, templates and samples.
Picture: User Interface Design Examples
Related Solution:
ConceptDraw DIAGRAM extended with Windows 8 User Interface solution from the Software Development area is the best gui software. Using the drawing tools, libraries of vector objects, graphical user interface examples that offers Windows 8 User Interface solution, you will easily design the Windows 8 user interfaces and Windows 8 UI design patterns of any complexity.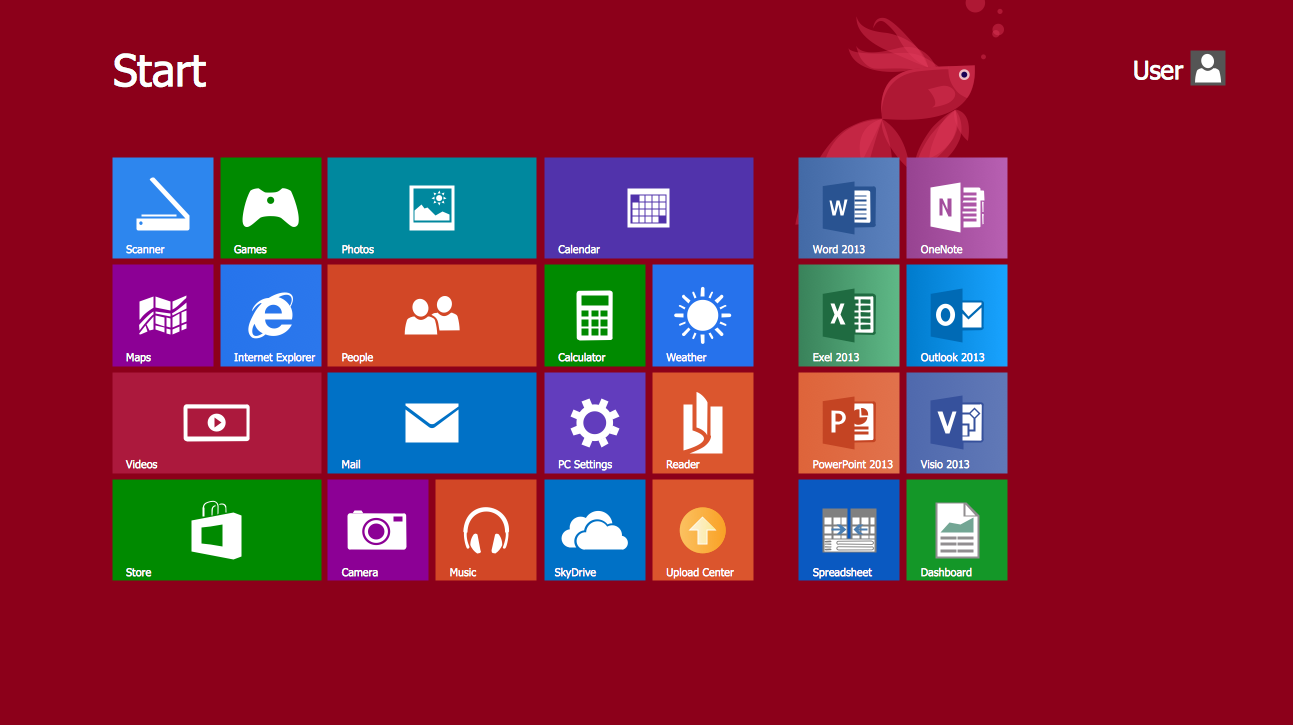
Picture: Graphical User Interface Examples
Related Solution:
ConceptDraw DIAGRAM is a powerful diagramming and vector drawing GUI software. Extended with Mac OS User Interface solution from the Software Development area, ConceptDraw DIAGRAM is the best software for designing professional looking user interfaces for new OS X 10.10 Yosemite operating system developed for Macintosh computers. Mac OS User Interface solution offers you large quantity of Mac OS templates, samples and user interface design examples.
Picture: Mac OS User Interface Design Examples
Related Solution:
If you are an advanced diagramming software user, you might use it daily. Traversing the Internet in searching of alternative to MS Visio for MAC and PC, you can fulfill all your requirements with ConceptDraw DIAGRAM. Don’t hesitate to transfer your documents to another operating system.
When looking for a smart and simple tool for business diagrams as alternative to MS Visio for Apple OS X platform, ConceptDraw DIAGRAM certainly is the best choice. Making many kinds of business charts, numerous technical drawings is what ConcepDraw DIAGRAM is the best. One can easy create any diagram and complete it perfectly and quickly. The big collection of vector object libraries, templates and samples, make it the best Microsoft Visio alternative: ConceptDraw DIAGRAM is simpler to use, less expensive, and supports project management and mind mapping methods.
Picture:
In Searching of Alternative to MS Visio for Mac and PC
with ConceptDraw DIAGRAM
The Gantt Chart is the main interface in ConceptDraw PROJECT. It summarizes the tasks in your project and presents them graphically so you can easily view your progress.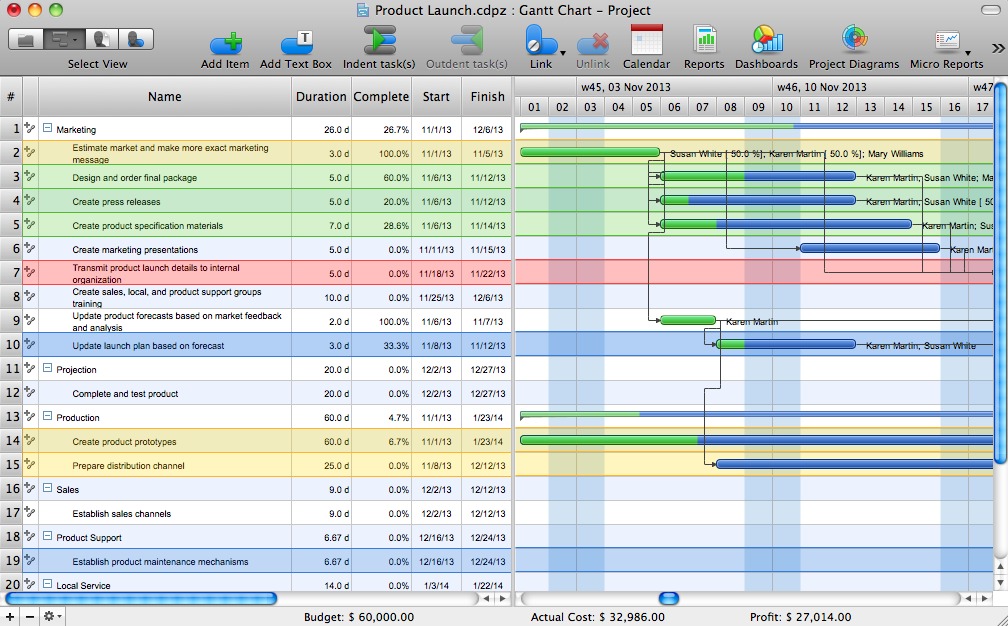
Picture: Gantt Chart Software
Using diagrams, you can visualize the flow of the information or build a detailed data structure. There's no need to have a degree in software and database design with ConceptDraw DIAGRAM , because this software has all the tools needed in developing models and diagrams. Project planning, designing and prototyping was never so easy.
This UML diagrams can be used to visualize a model of the data base development process. A UML diagram shows a graphical view of a structure of software system: components and relationships.
Using Unified Modeling Language helps to depict logical and physical elements of a data base, visually represent requirements and sub-systems. UML diagrams allows developers to organize and predict critical issues, as well as collaborate data base information.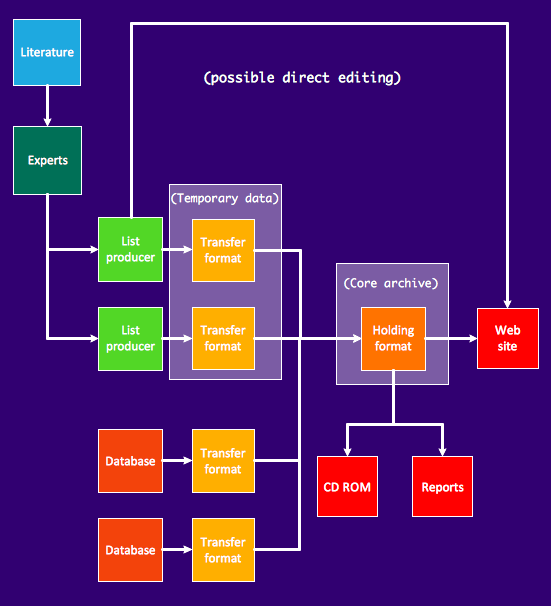
Picture: Software and Database Design with ConceptDraw DIAGRAM
Related Solution:
ConceptDraw DIAGRAM provides iPhone User Interface Solution from the Software Development Area of ConceptDraw Solution Park for quick and easy drawing professional looking graphical user interfaces. Even if you are not an artist, you will be able easily draw any iPhone graphical user interface using the ready-to-use predesigned vector objects from the offered libraries of iPhone User Interface Solution for ConceptDraw Solution Park.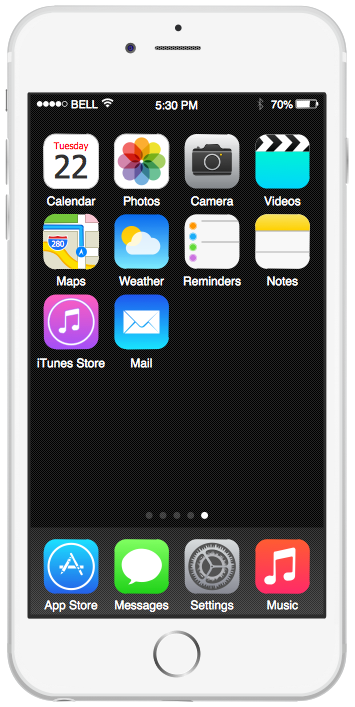
Picture: Graphical User Interface
Related Solution:
What is the ideal GUI interface? The interface of mobile device it's all that users see on it and can interact - screen, bars, icons of applications. So the interface is the first that draws the user's attention. The main goal of software engineers, GUI interface designers, and GUI developers is to make the interface first of all easy for perception and understanding, convenient and attractive for the users. The iPhone's GUI interface meets all these requirements.
Picture: GUI Interface
Related Solution:


