
Example 1. How Do Fishbone Diagrams Solve Manufacturing Problems
6 Ms and 8 Ms are globally recognized standards for manufacturing. First you need to define an effect of the analysis and add it as a head of your diagram, all causes listed above on this page are added as the bones (without particular order). If necessary, you can also use on the diagram another terms that better suit for your company.
It is convenient to develop a Fishbone diagram representing 8 Ms or 6 Ms on the base of specialized templates, samples of Fishbone Diagrams Solution or using the predesigned objects from the Fishbone Diagrams library.

Example 2. Design Fishbone Diagrams for Manufacturing in ConceptDraw DIAGRAM
The template you see on this page was created in ConceptDraw DIAGRAM using the tools of the Fishbone Diagrams Solution. It shows the Fishbone Manufacturing 8 Ms diagram and is available from ConceptDraw STORE.
Use the Fishbone Diagrams Solution for ConceptDraw DIAGRAM Solution Park to demonstrate how do Fishbone Diagrams solve manufacturing problems.
All source documents are vector graphic documents. They are available for reviewing, modifying, or converting to a variety of formats (PDF file, MS PowerPoint, MS Visio, and many other graphic formats) from the ConceptDraw STORE. The Fishbone Diagrams Solution is available for all ConceptDraw DIAGRAM or later users.
TEN RELATED HOW TO's:
Database design is an important part of any project, as databases become more and more complex nowadays. To make the model more representative, entity relationship diagrams are widely used in software engineering area. These diagrams show sets of entities as rectangles connected via lines labeled with their cardinalities.
This an example of the ER-diagram developed to store information regarding some online role-playing game. It includes three main elements of ER diagram: entities, relationships and attributes. The entities, attributes and relationships on this ER-diagram is depicted according to the Chen's notation. Chen's notation for Entity Relationship diagrams admits using of rectangles to depict entities, ovals for attributes and ,at least, diamonds to show relationships. ConceptDraw Entity-Relationship Diagrams solution was applied as ERD software to create this diagram.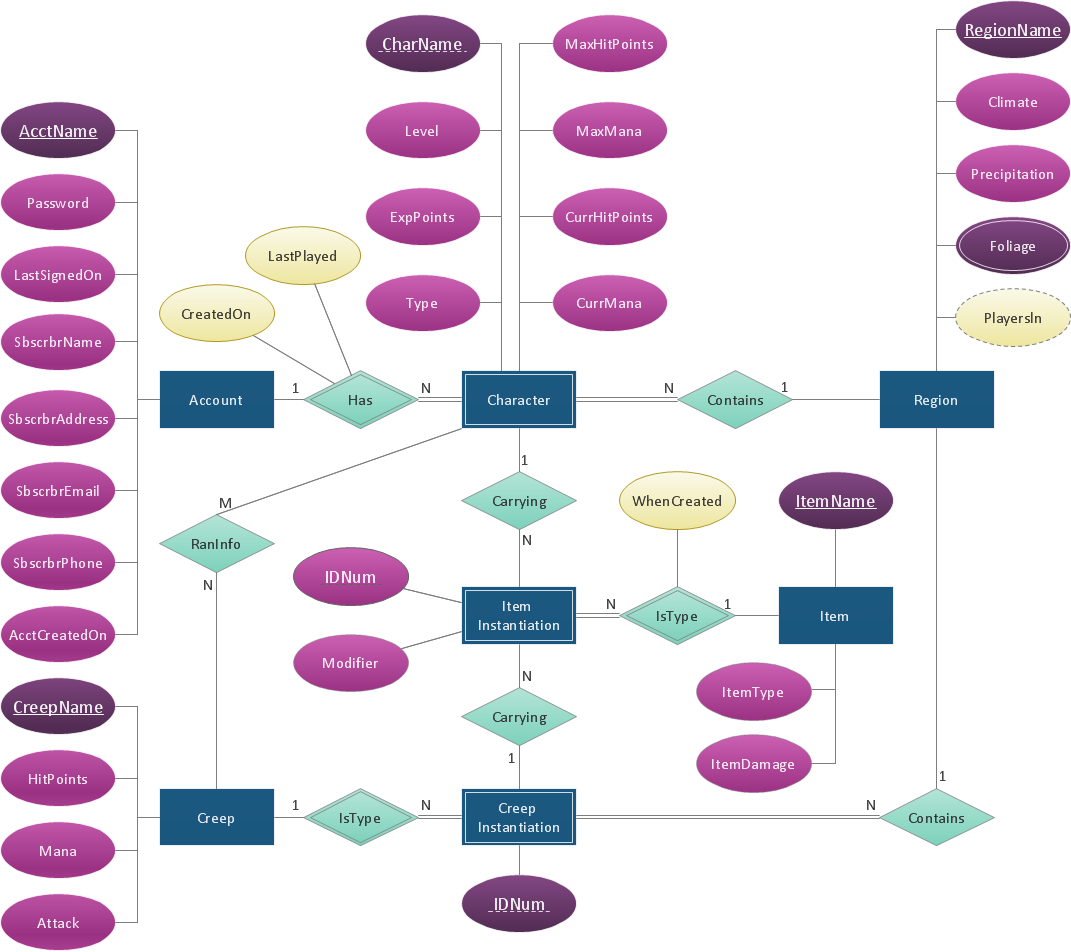
Picture: ConceptDraw DIAGRAM ER Diagram Tool
Related Solution:
One of the stages of the problem's solving process scenario is Corrective Action Planning.
Corrective action planning define people and groups involvement in corrective actions by roles, identify logical sequences of scheduled actions and critical path of problem solving, identify possible risks of action plan and propose preventive actions.
Picture: Corrective Action Planning
Event-Driven Process chain Diagrams for improvement throughout an organisation. Best software for Process Flow Diagram. The Event-driven Process Chain (EPC) Diagrams allows managers to plan processes and resources.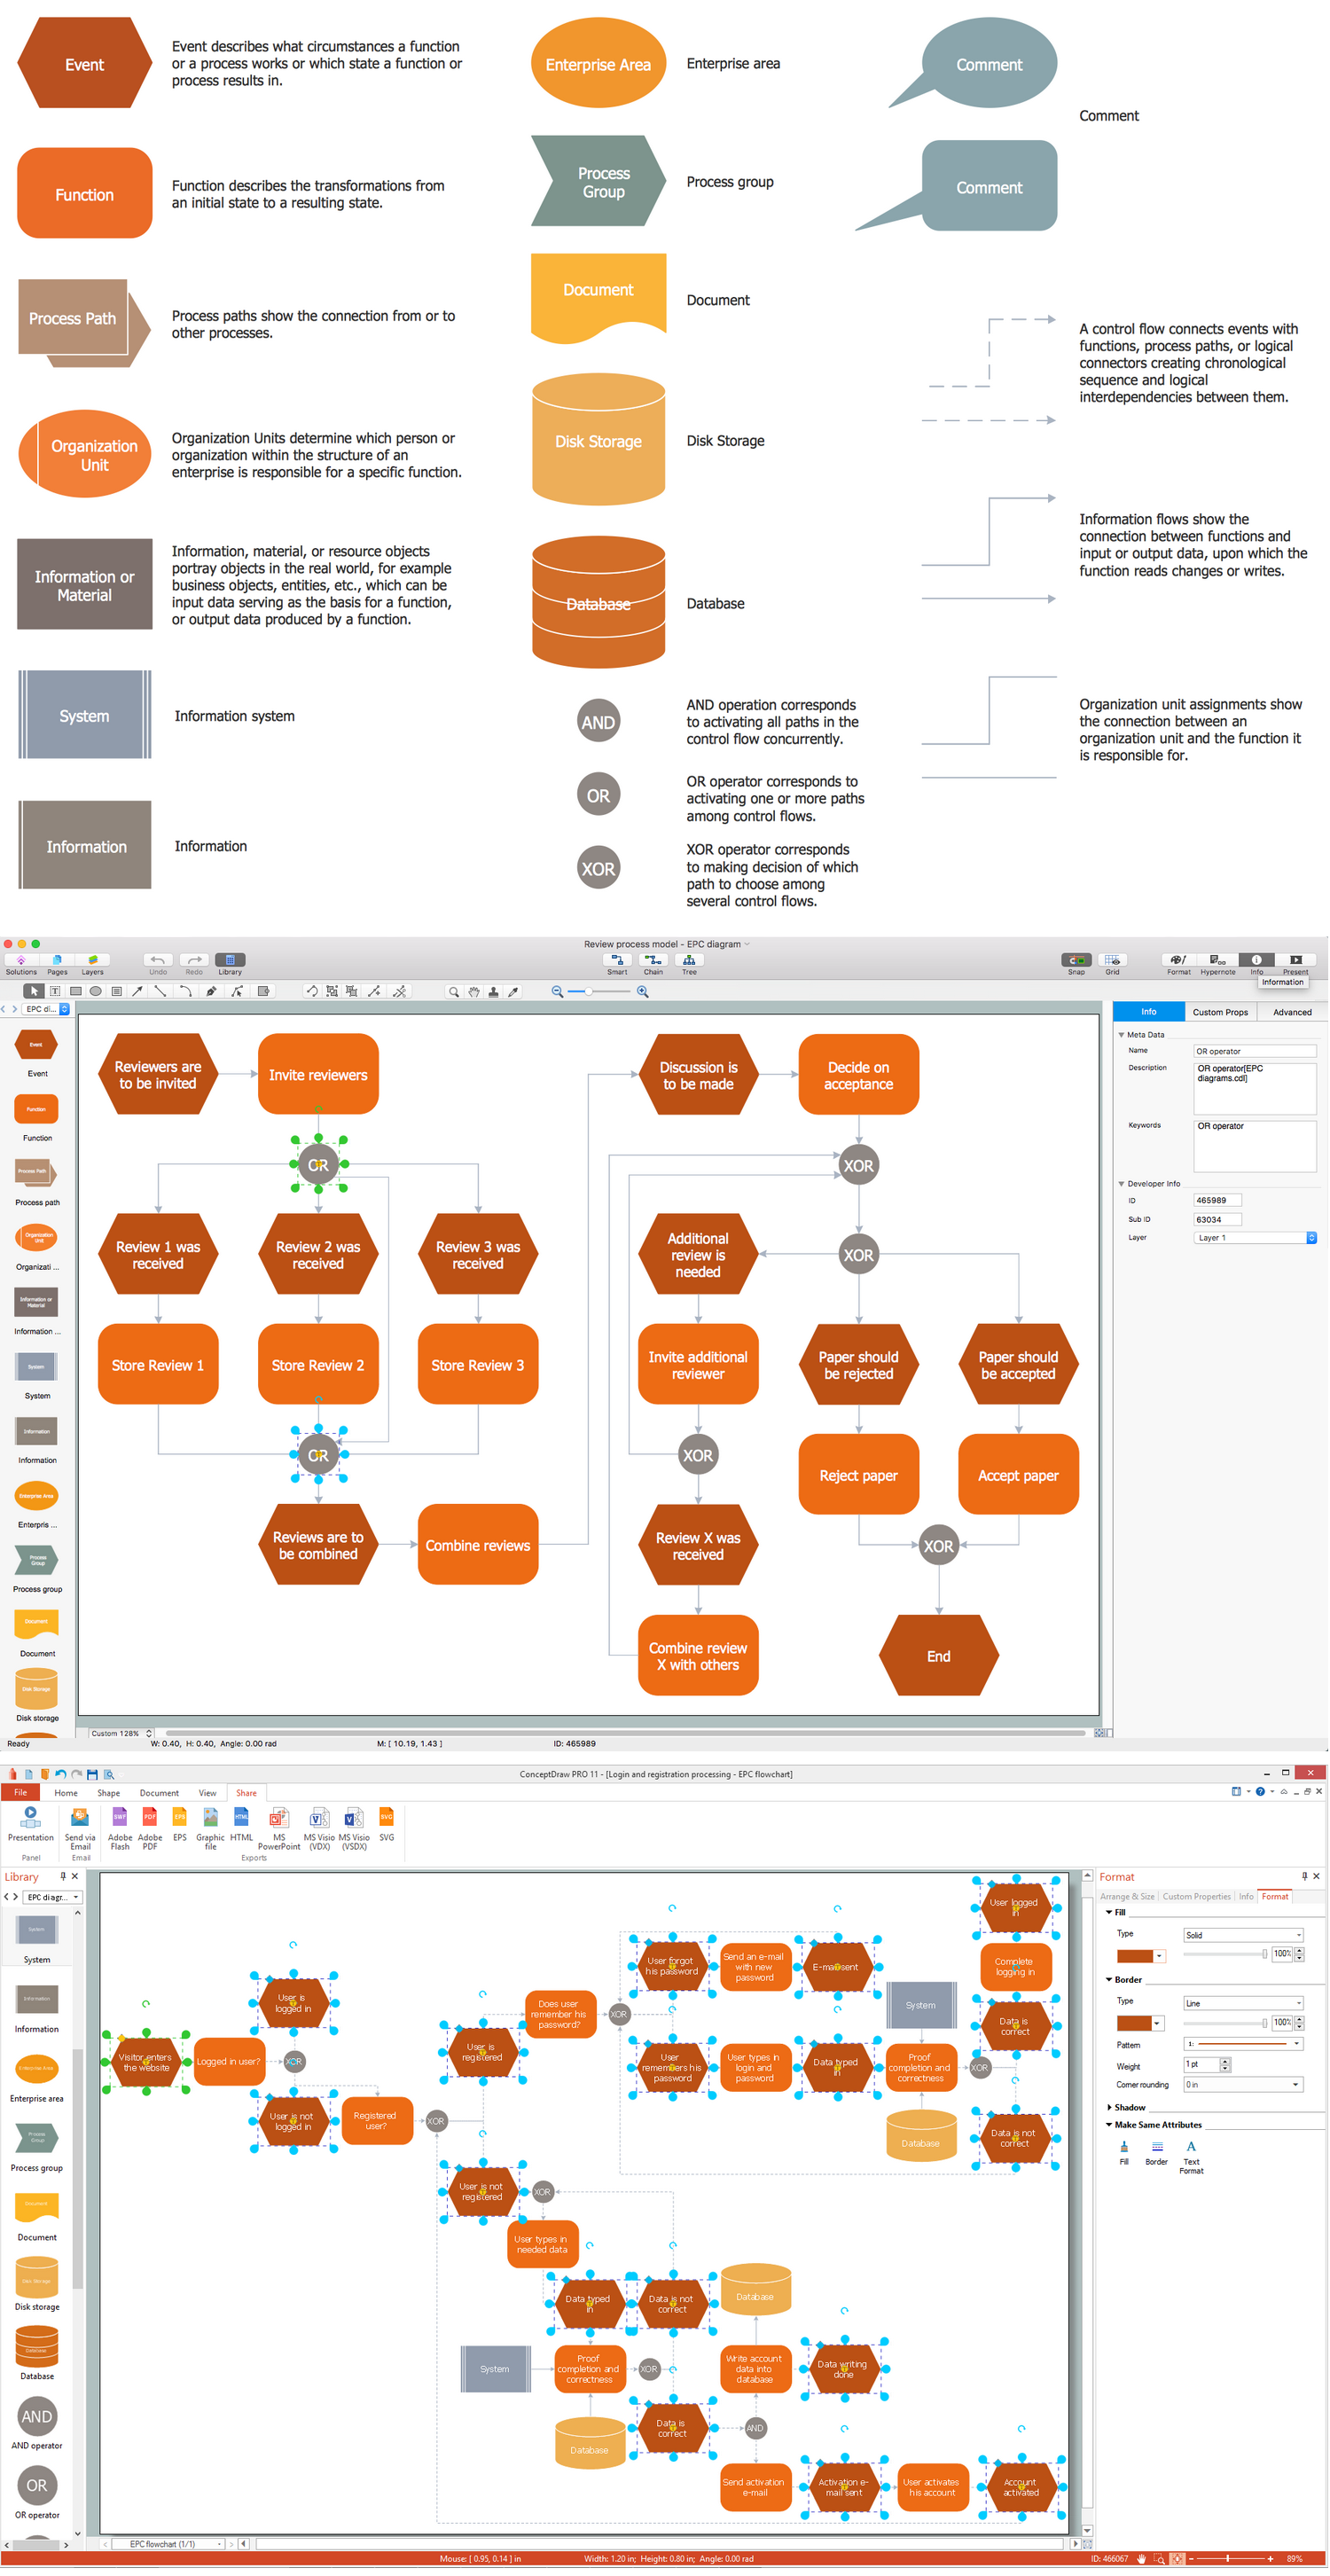
Picture: Business process Flow Chart — Event-Driven Process chain (EPC) diagrams
Related Solution:
The Total Quality Management Diagram solution helps your organization visualize business and industrial processes. Create Total Quality Management diagrams for business process with ConceptDraw software.
Picture: Management Tools — Total Quality Management
Related Solution:
A more detailed mind map of a business plan for a computer hardware reseller.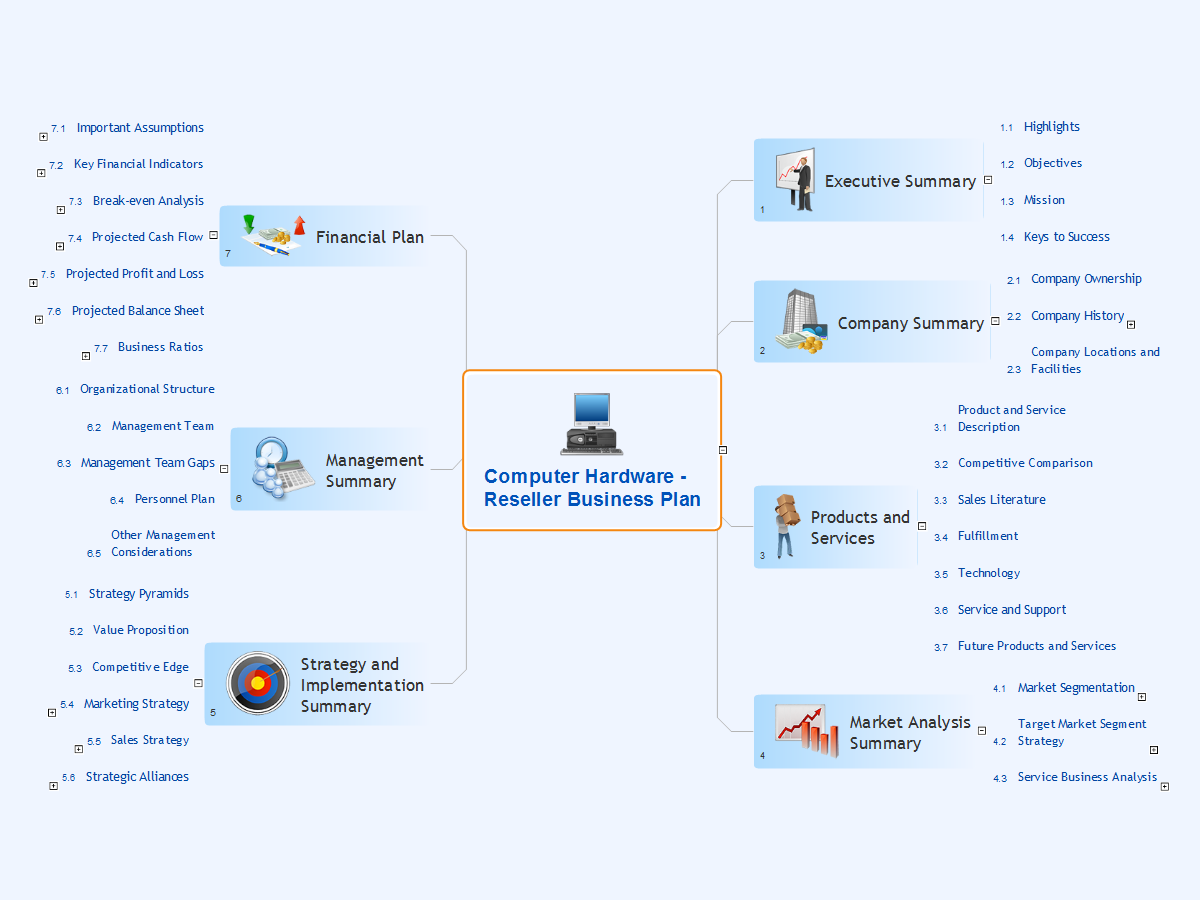
Picture: Computer Hardware - Reseller Business Plan
Related Solution:
Sports Selection Flow Chart - This sample was created in ConceptDraw DIAGRAM using the Flowcharts Solution from the Marketing Area and shows the Flow Chart of sport selection. An experienced user spent 10 minutes creating this sample.
Picture: Flow Chart for Olympic Sports
Related Solution:
ConceptDraw DIAGRAM is a powerful electrical design software. The Electrical Engineering solution from the Engineering area of ConceptDraw Solution Park allows you easy, quick and effective draw the professional looking electrical, circuit and wiring diagrams and schemes, maintenance and repair diagrams for electronics and electrical engineering, and many other types of diagrams.
Picture: Electrical Design Software
Related Solution:
Functional modeling allows to make complex business processes simple. One of the basic methods is IDEF0 and one of the most effective also. To create a business model, use flowchart symbols.
The IDEF0 library, supplied with ConceptDraw IDEF0 Diagrams solution contains 18 IDEF0 basic notation symbols. All symbols are the vector graphic images what means, that one can customize their size preserving the stable quality. Another library of IDEF0 symbols can be find out in the the Business Process Diagrams solution, included to the Business Processes section of ConceptDraw Solution Park. These libraries composed from just vector objects and are totally compatible. You can apply the IDEF0 symbols from both libraries at your flowcharts, if needed.
Picture: IDEF0 Flowchart Symbols
Related Solution:
ConceptDraw DIAGRAM diagramming and vector drawing software is the best choice for making professional looking Emergency Plan template, examples and samples. ConceptDraw DIAGRAM provides Fire and Emergency Plans solution from the Building Plans Area of ConceptDraw Solution Park.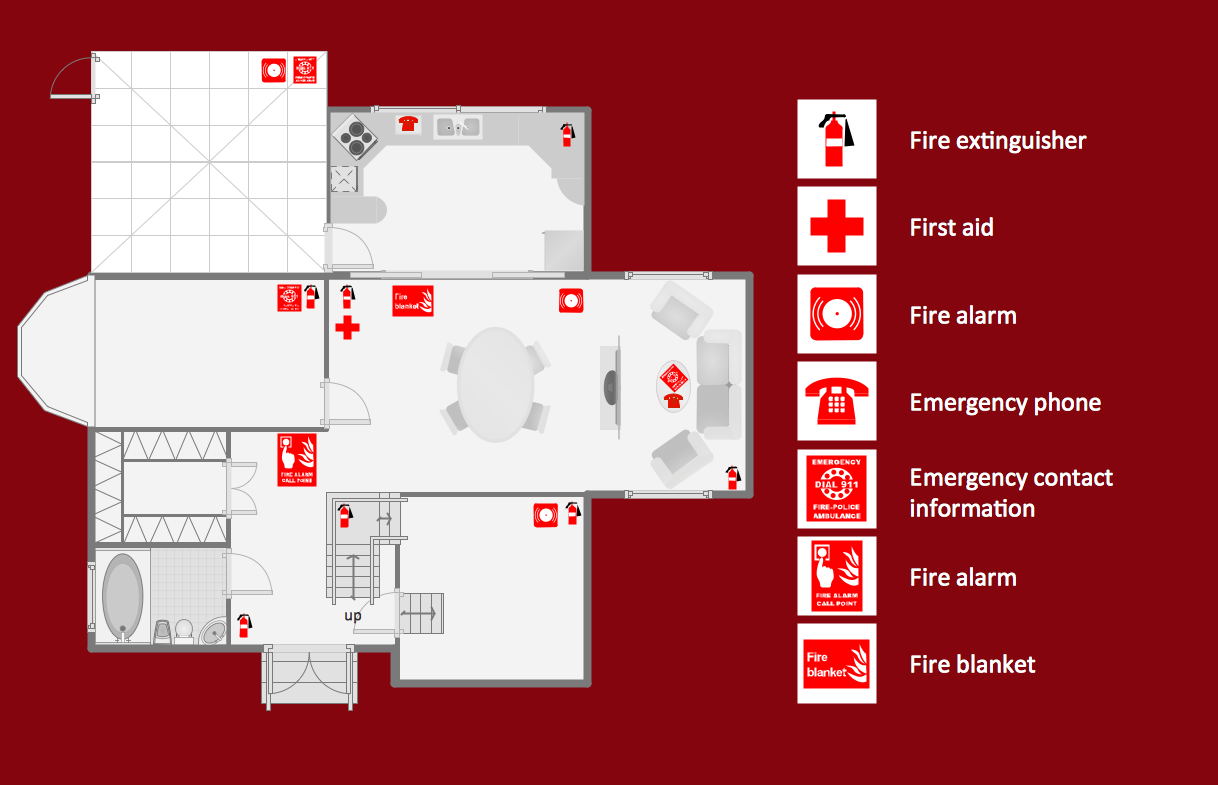
Picture: Emergency Plan Template
Related Solution:
ConceptDraw MINDMAP has impressive import and export capabilities includes following formats:
OPML
Mindjet™ MindManager™
Microsoft™ Office products:
PowerPoint™
Project™
Word™
FreeMind (import only)
XMind (import only)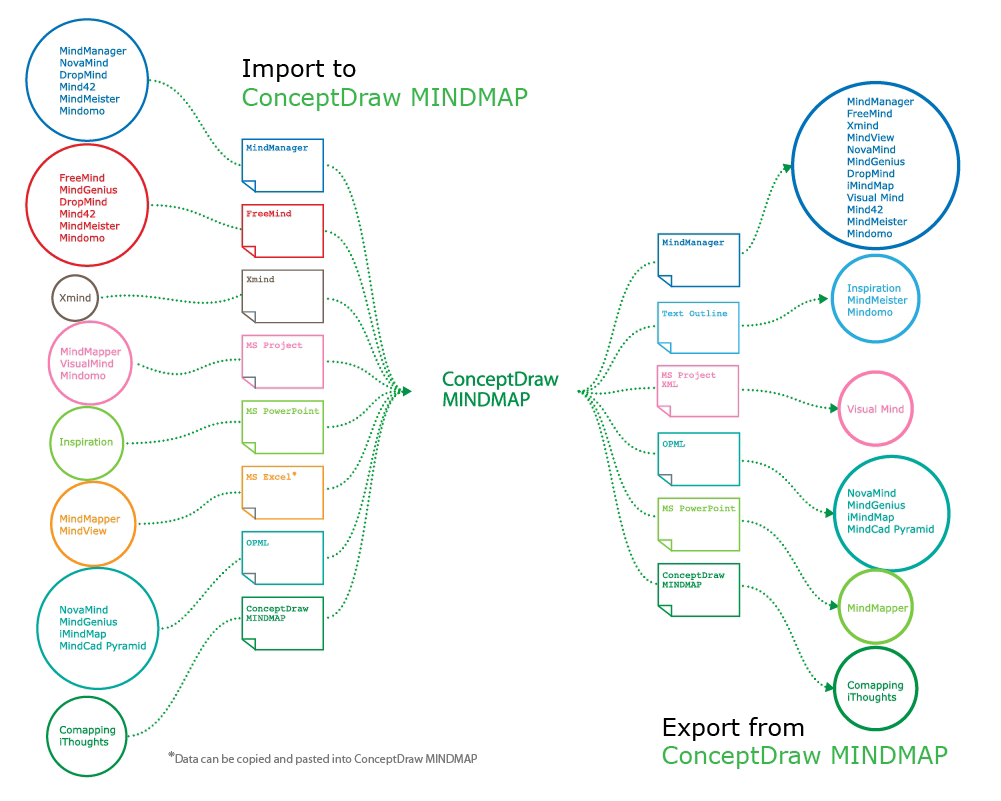
Picture: How to Exchange ConceptDraw MINDMAP Files with Mindjet MindManager
Related Solution: