How to Design Landscape
How to design landscape? You can draw it by hand on a sheet of paper, but for this you need to know the bases of the perspective, you need to have good artistic abilities and to know how to depict the natural elements.
But it is much easier and convenient to use the modern ConceptDraw DIAGRAM diagramming and vector drawing software extended with Landscape & Garden Solution from the Building Plans Area.

Example 1. How to design landscape?
Landscape & Garden Solution is a multiplicity of predesigned pictorial samples which are the good professional examples and can become excellent source of inspiration for you.

Example 2. Bushes and Trees Library Design Elements
Landscape & Garden Solution is a powerful drawing tool with 14 libraries of specially designed landscape design shapes:
- Garden Accessories
- Garden Furniture
- Garden Paths and Walkways
- Bushes and Trees
- Flowers and Grass
- Transparent Trees
- Patios
- Plots and Fences
- Plumbing
- Ponds and Fountains
- Roofs
- Outdoor Recreation Space
- Home Plan
- Dimensioning

Example 3. Flowers and Grass Library Design Elements
How to design landscape easy and quick? You don't need to be an artist to simply drag ready shapes from the libraries to your document and quickly arrange them according to your design idea.

Example 4. Formal Garden
This sample was created in ConceptDraw DIAGRAM using the Landscape & Garden Solution and shows the strict and symmetric design for the large garden. This sample is a perfect answer on the question how to design landscape quick and easy. An experienced user spent 25 minutes creating this sample.
Use Landscape & Garden Solution from the Building Plans Area to design your own landscape plan quick, easy and effective.
All source documents are vector graphic documents. They are available for reviewing, modifying, or converting to a variety of formats (PDF file, MS PowerPoint, MS Visio, and many other graphic formats) from the ConceptDraw STORE. The Landscape & Garden Solution is available for all ConceptDraw DIAGRAM or later users.
TEN RELATED HOW TO's:
Data flow diagrams are the graphical tool, used in the visualization of data flow of some data processing systems. It is the valuable process modeling tool. Also designing DFD is the important component of the initial part of any information system development project. The standard symbols are used to represent the interaction of a system components and how various kinds of components influence on data flow. The ConceptDraw Data Flow Diagrams solution is design to assist professional software engineers in making DFDs according to Gane and Sarson, and Yourdon and Coad notations.
Do you imagine yourself as a successful IT specialist? To your mind, they all use data flow diagram examples to learn and to get inspired. Aren’t you still with us?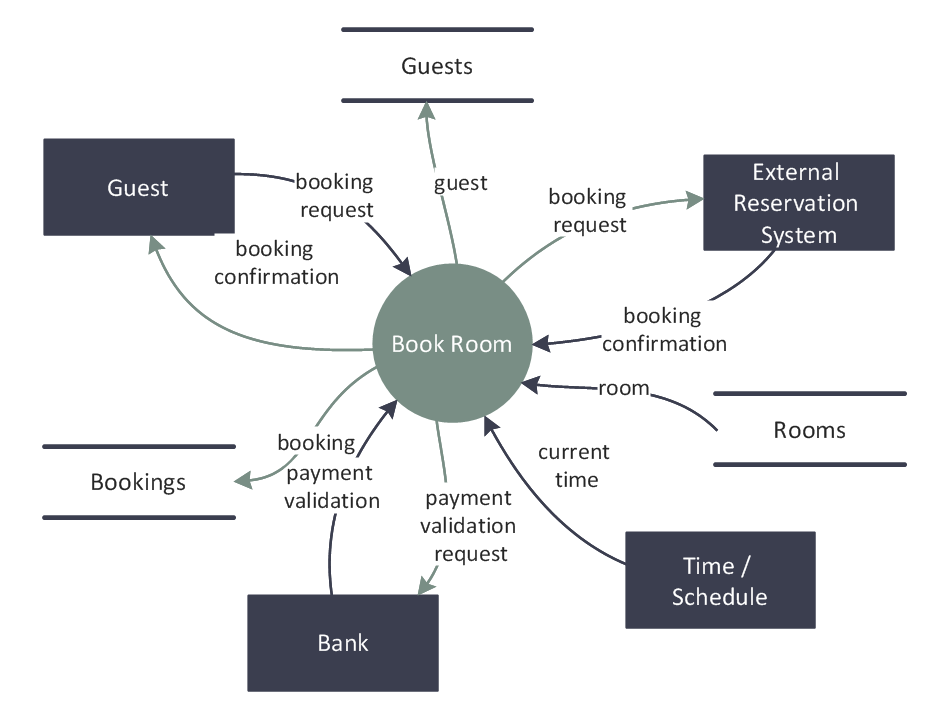
Picture: Data Flow Diagram Examples
Related Solution:
The Nature Solution addition to ConceptDraw Solution Park for ConceptDraw DIAGRAM includes new libraries that provide a wide range nature objects and it can be used in many areas.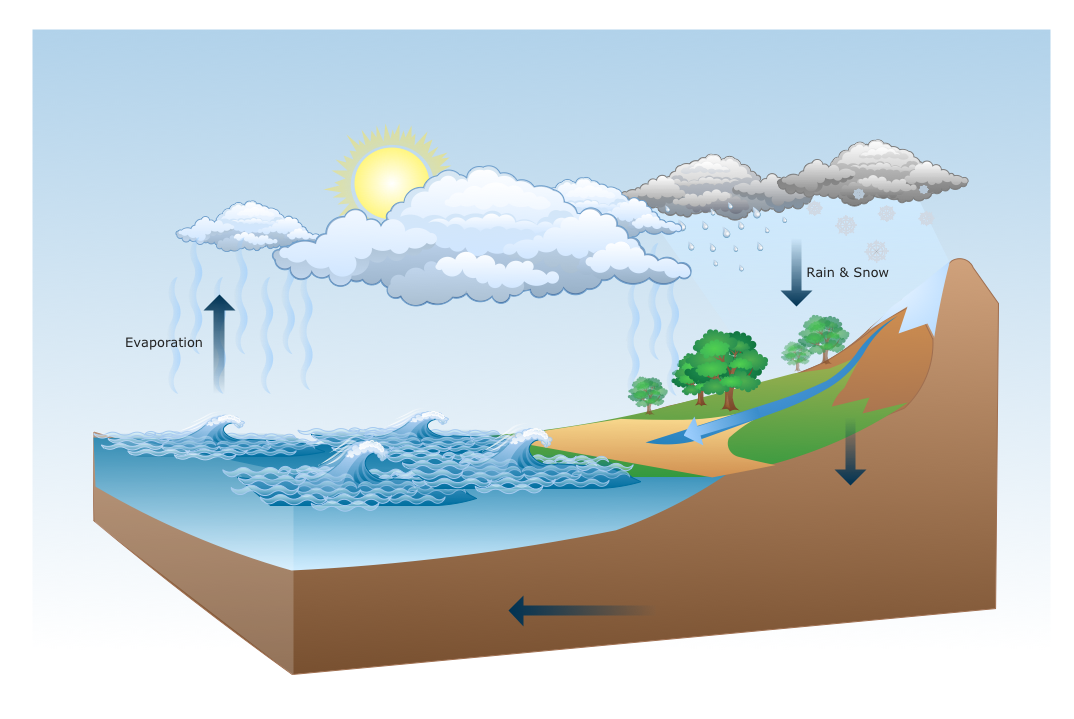
Picture: Drawing Illustration
It’s very important for any establishment to have a fire exit plan and to train it several times a year. The plan must be put on each floor of the building in a way that it could be easily seen. To make the plan clear and descriptive, you should look through examples and then create one for you your building.
Find out the fire exit plan example created with ConceptDraw DIAGRAM and its Fire and Emergency Plans solution. This plan is a floor plan that shows the ways in which people inside the building can be evacuated in the event of a fire. The location of telephones, fire extinguishers and first aid kits are indicated on the fire exit plan. The Legend in the lower right corner of the plan makes it clear and easy-to-read. Such plan should be placed on the wall on each floor of the building.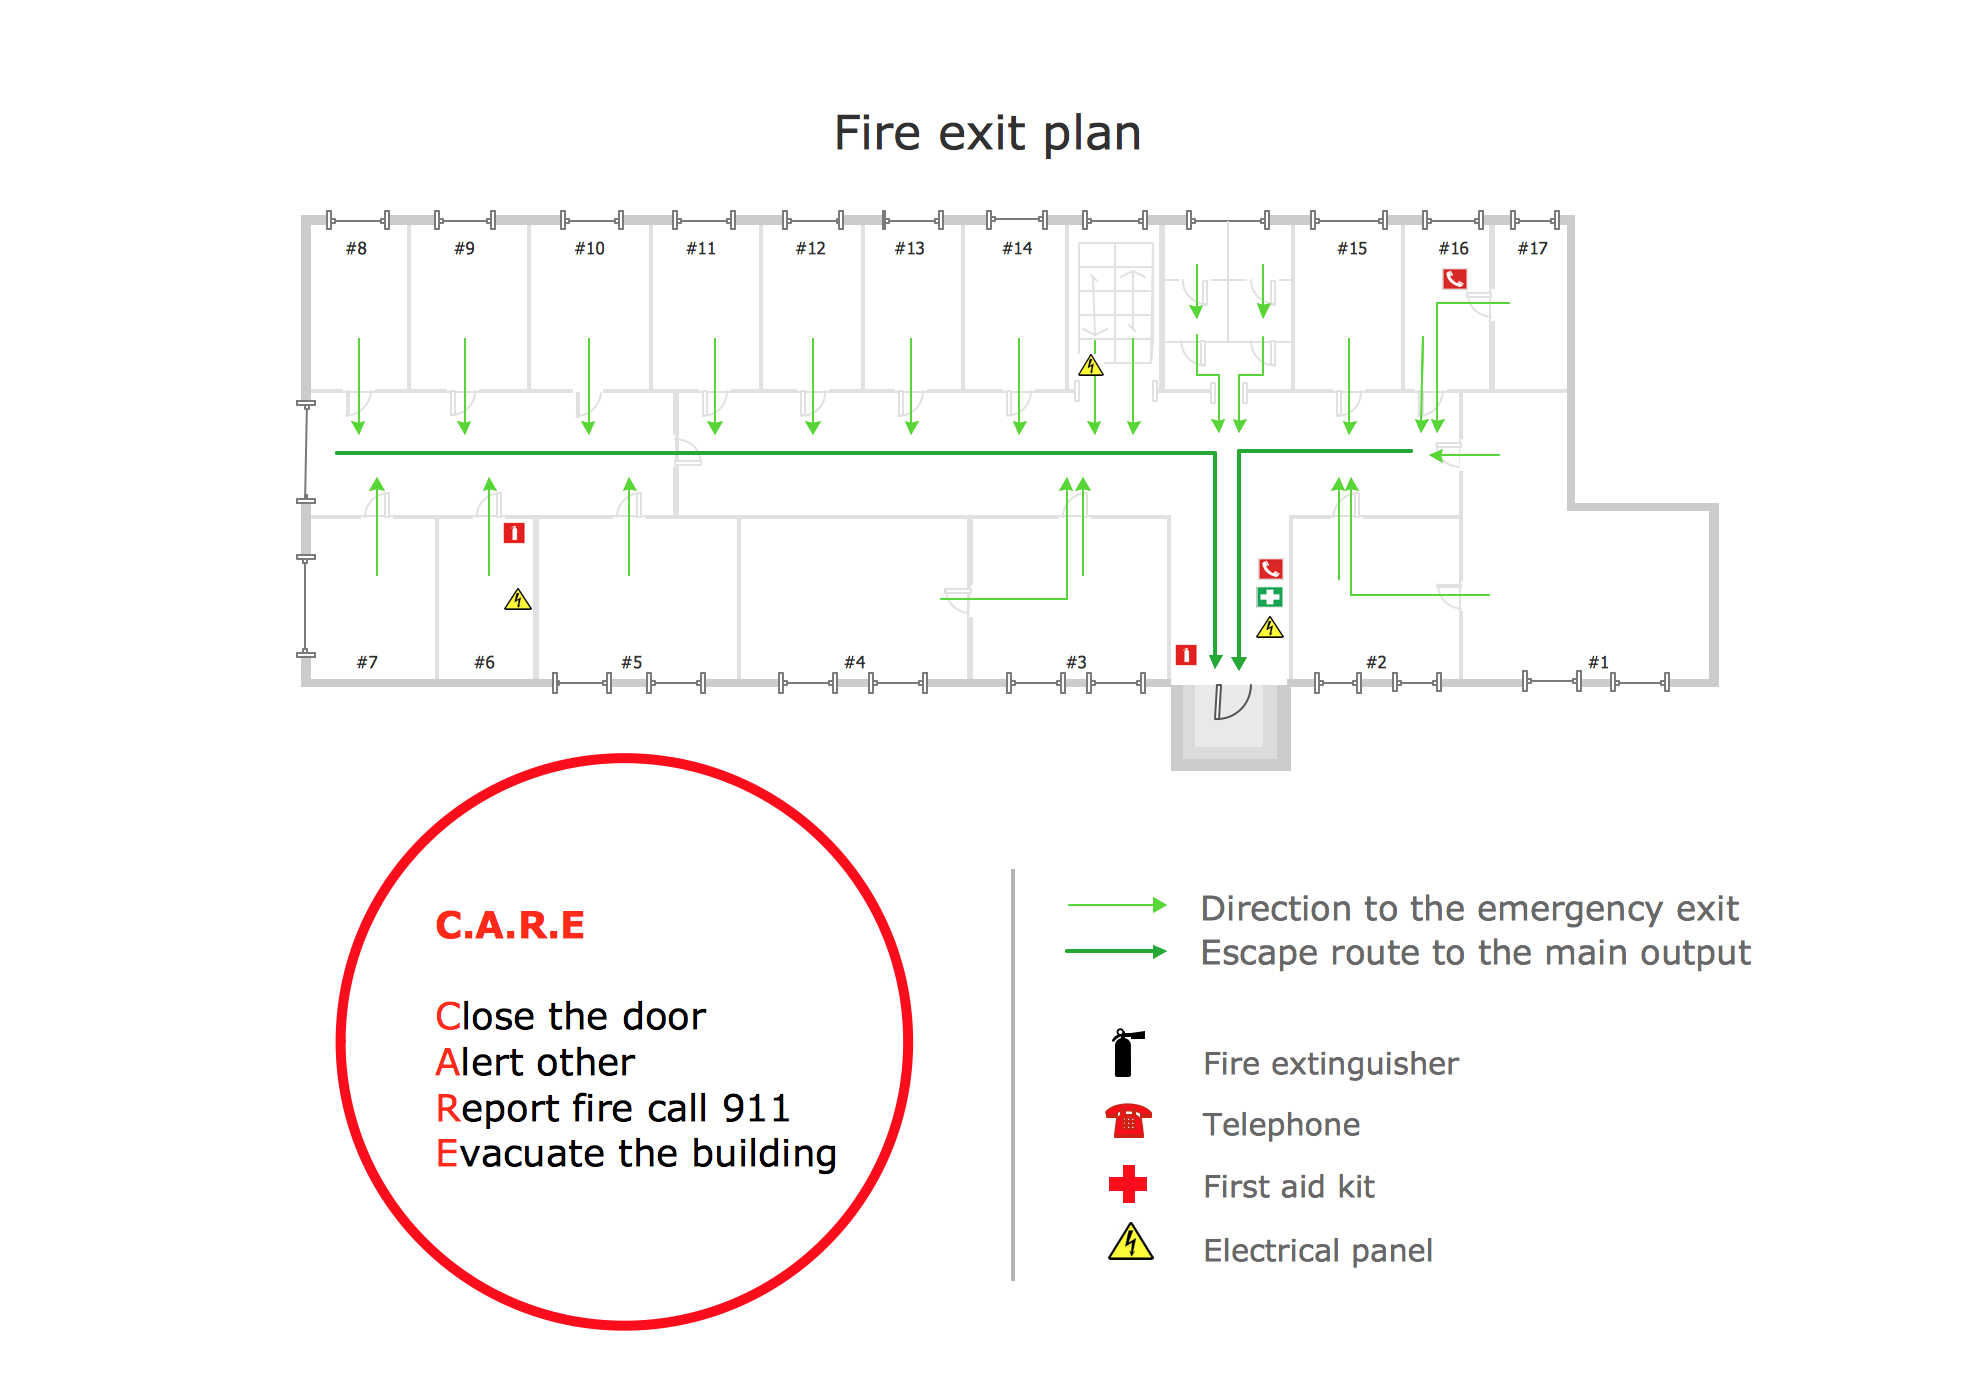
Picture: Fire Exit Plan. Building Plan Examples
Related Solution:
If you want to find a way to understand complex things in minutes, you should try to visualize data. One of the most useful tool for this is creating a flowchart, which is a diagram representing stages of some process in sequential order. There are so many possible uses of flowcharts and you can find tons of flow charts examples and predesigned templates on the Internet. Warehouse flowchart is often used for describing workflow and business process mapping. Using your imagination, you can simplify your job or daily routine with flowcharts.
Warehouse flowcharts are used to document product and information flow between sources of supply and consumers. The flowchart provides the staged guidance on how to manage each aspect of warehousing and describes such aspects as receiving of supplies; control of quality; shipment and storage and corresponding document flow. Warehouse flowchart, being actual is a good source of information. It indicates the stepwise way to complete the warehouse and inventory management process flow. Also it can be very useful for an inventory and audit procedures.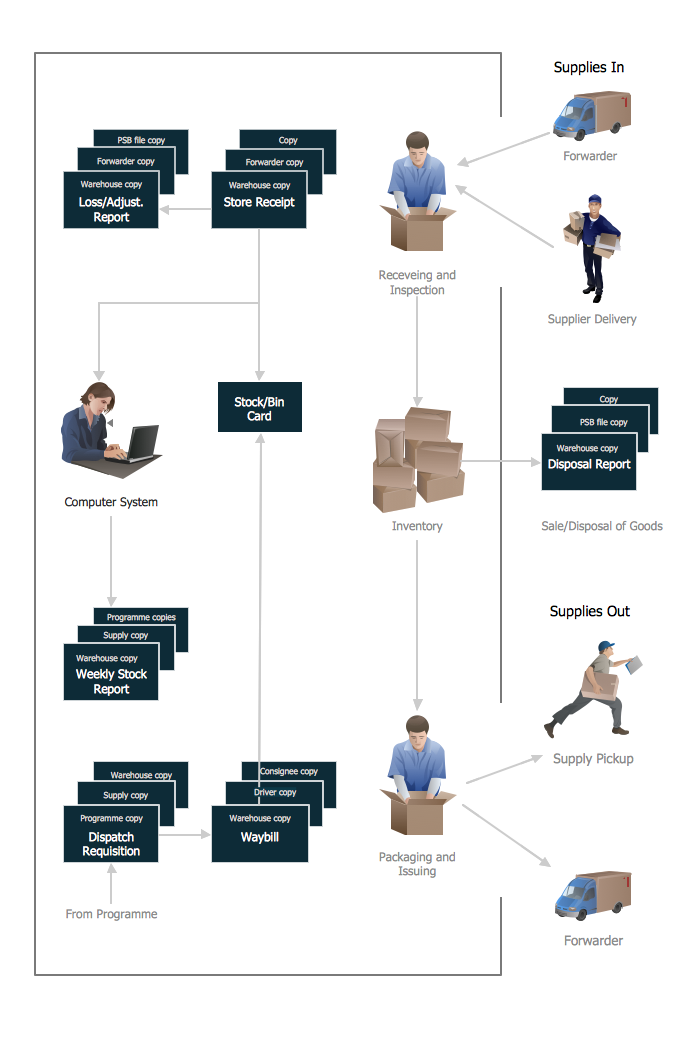
Picture: Flow Chart Example: Warehouse Flowchart
Related Solution:
Structured-systems analysis and design method uses data flow diagrams to represent the process of data flowing through a system. Talking about this might be useless without a proper example of DFD for online store (Data Flow Diagram). This DFD example shows all the distinctness that a diagram can bring into a scattered data structure.
Data flow diagrams are used to show how data is processed within some business processes. Making DFD is a common practice for business process modeling and analysis. This diagram represents the online store business flow. It describes inputs and outputs within online selling process and depicts the interactions between its participants. This DF diagram can be used by system analysts to create an overview of a business, to study and discover its inherent strengths and weak points.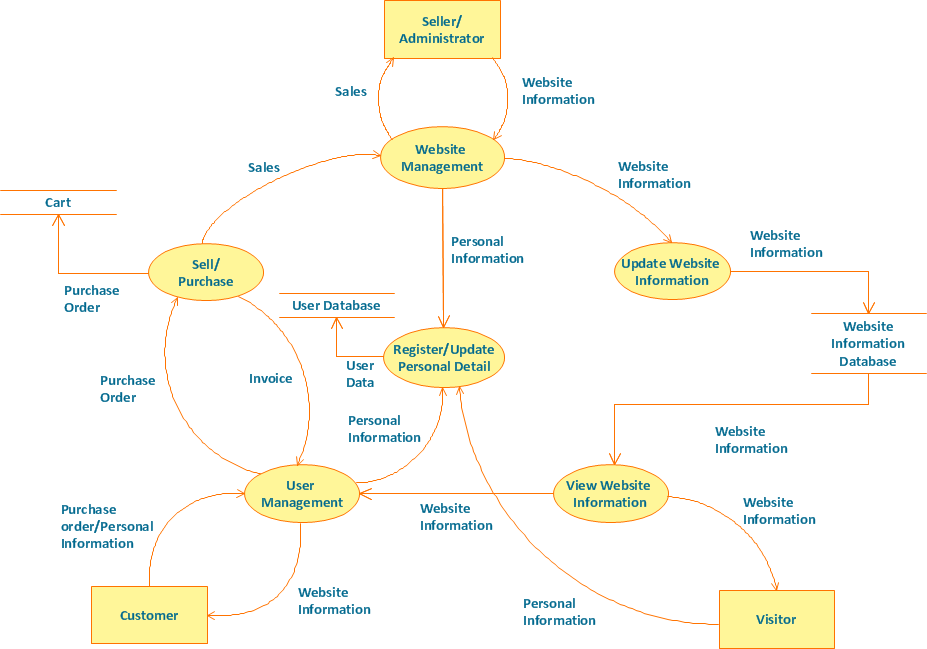
Picture: Example of DFD for Online Store (Data Flow Diagram)
Related Solution:
It’s very convenient to explain the different tactics and positions using the visual drawings. ConceptDraw DIAGRAM software extended with the Soccer solution from the Sport area of ConceptDraw Solution Park provides libraries, templates and samples allowing specialists or soccer fans to draw the soccer-related diagrams and schemas of any complexity in a few minutes.
Picture: Soccer (Football) Offside
Related Solution:
Risk Diagram (PDPC) - ConceptDraw OFFICE suite is a software for Risks Diagram making. This diagram identifies possible risks in accomplishing corrective actions. With the Risks Diagram, one analyzes each action separately in a tree of all actions and develops a preventive action in response of each potential obstacles or circumstances which may be a risk.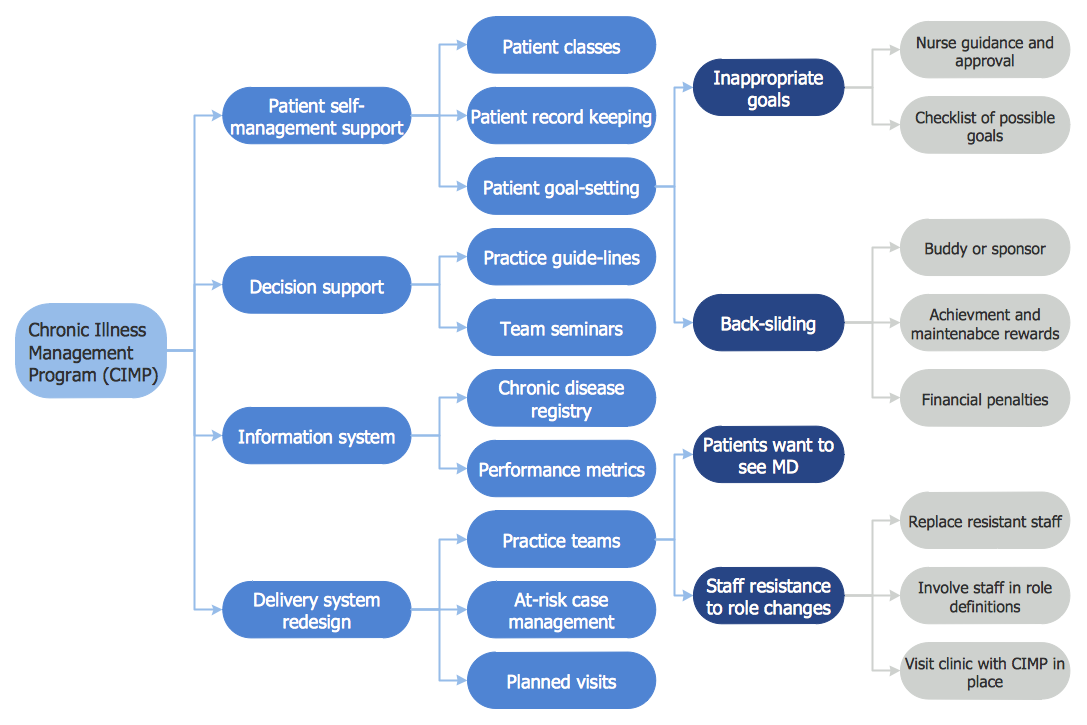
Picture: CORRECTIVE ACTIONS PLANNING. Risk Diagram (PDPC)
Create a Line Chart with ConceptDraw using our tips. Here you can find an explanation of how to create a line chart quickly.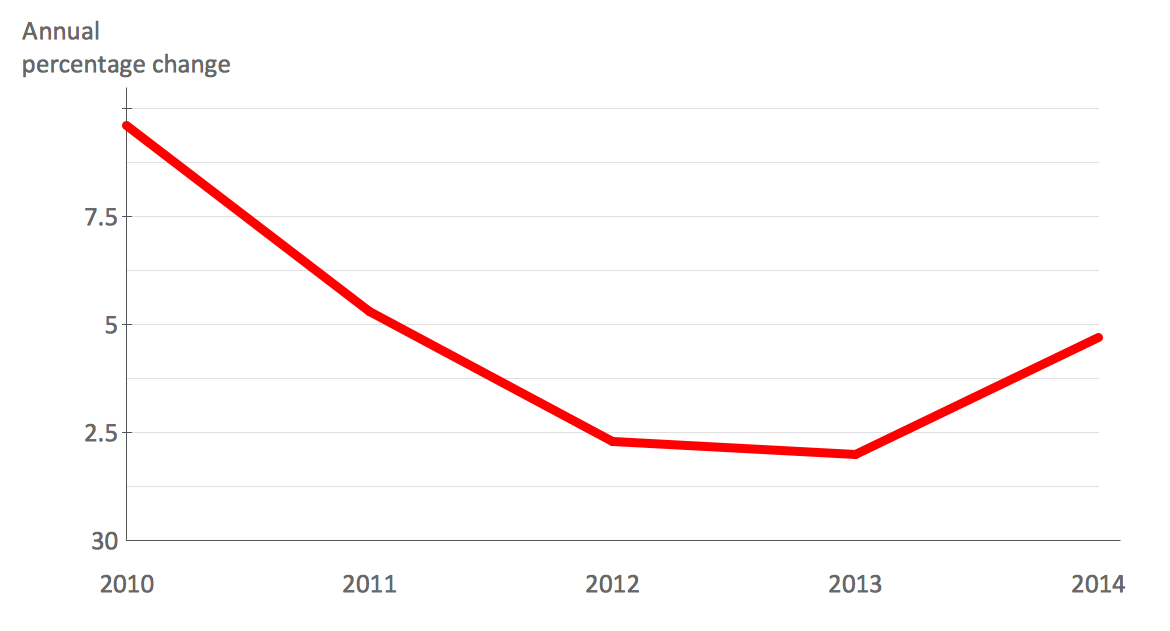
Picture: How to Create a Line Chart
Related Solution:
Biology is incredibly interesting and useful natural science which studies all living things on the earth (people, animals, plants), structure, functions, interactions, evolution of living organisms. Biologists of the whole world use actively illustrations and drawings in your science and education activity. To facilitate their task of biology drawing, ConceptDraw DIAGRAM diagramming and vector drawing software was extended with Biology solution from the Science and Education area. Now, ConceptDraw DIAGRAM is a powerful biology drawing software.
Picture: Biology Drawing Software
Related Solution:
How should diagramming software work? Is it possible to develop a diagram as quickly as the ideas come to you? The innovative ConceptDraw Smart Connectors Technology - This is more than enough versatility to draw any type of diagram with any degree of complexity.
Connection points are necessary for diagramming network, flowchart and organizational charts. In ConceptDraw you connect shapes by attaching, or snapping and gluing, connectors to shape connection points.
Picture: ConceptDraw Arrows10 Technology


