How To Draw a Histogram?
How to draw a Histogram? It's very fast and easy to draw any Histogram using the tools of ConceptDraw DIAGRAM software extended with Histograms solution from the Graphs and Charts area of ConceptDraw Solution Park.
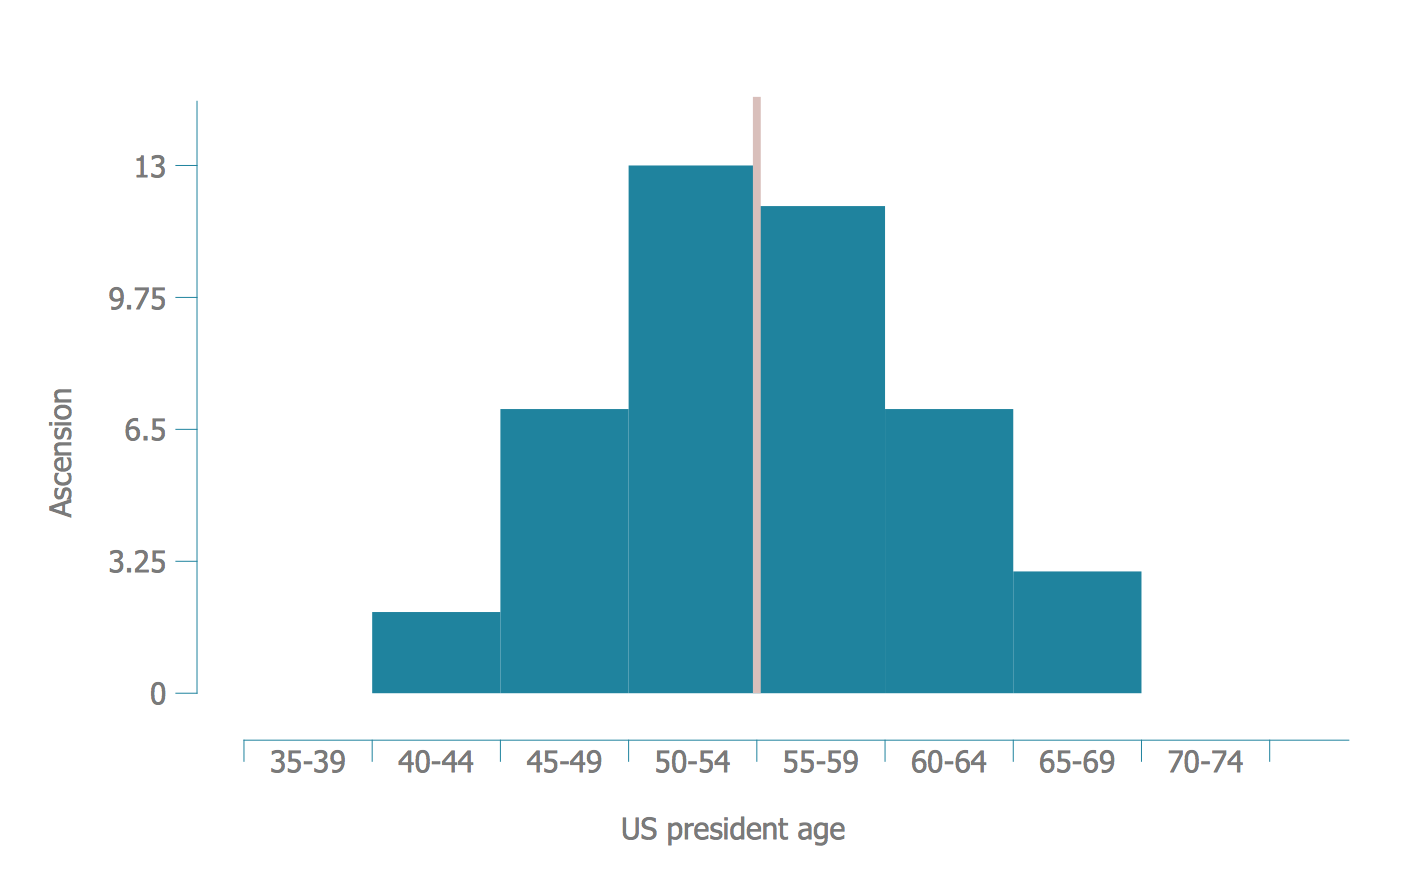
Example 1. How To Draw a Histogram
Histograms Solution from the Graphs and Charts area offers you the large collection of predesigned templates and samples, and library with ready-to-use vector objects.

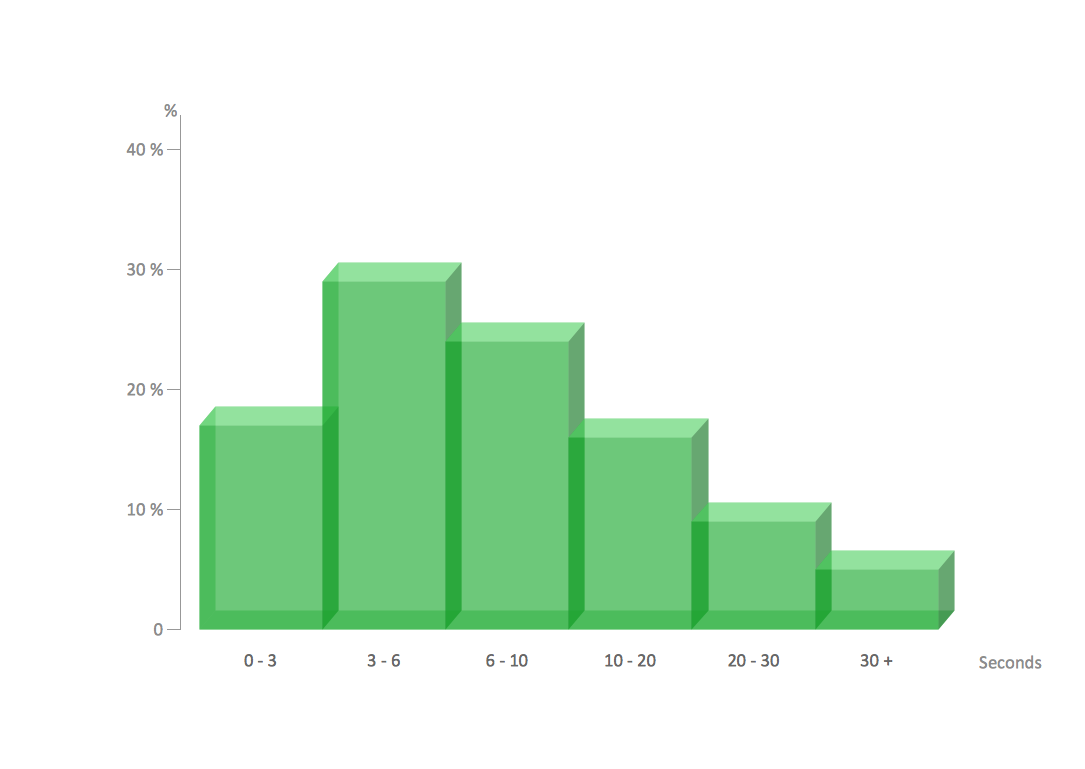
Example 2. Histograms Solution in ConceptDraw STORE
It's impossible to describe in words, how is it convenient and easy to open the desired template or sample from the ConceptDraw STORE and change it according to your data, or even use as is if it entirely suits you.
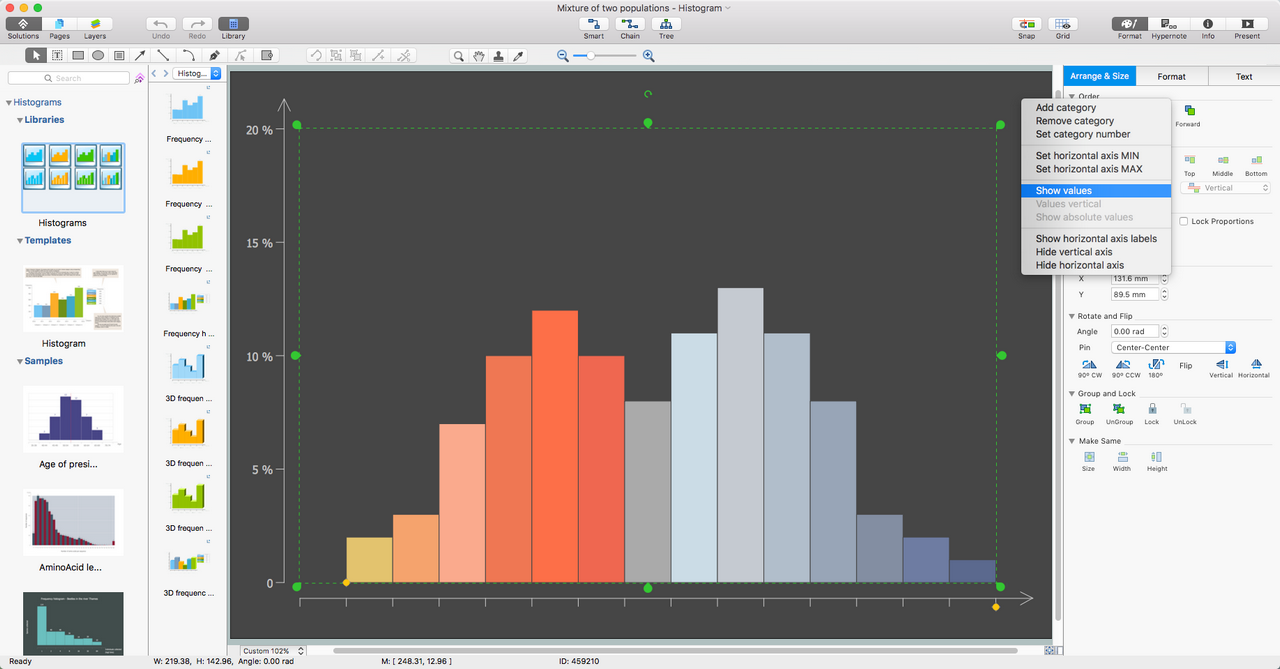
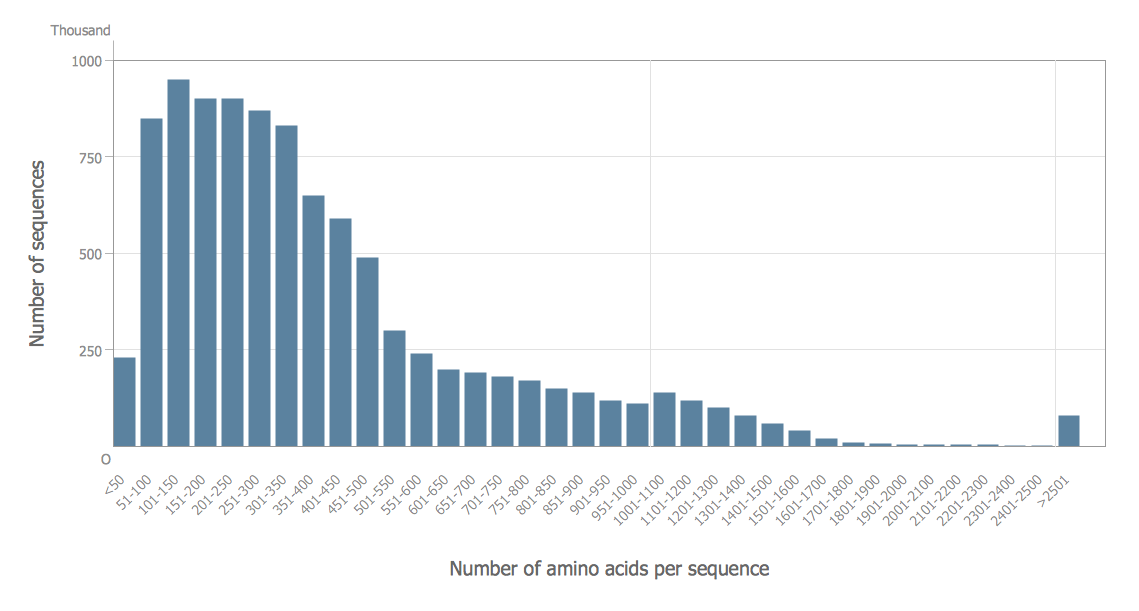
Example 3. How To Draw a Histogram in ConceptDraw DIAGRAM
Now you will answer with confidence "Simply and fast with Histograms Solution" for the question "How To Draw a Histogram?".
Use the Histograms Solution for ConceptDraw DIAGRAM diagramming and vector drawing software to create your own professional looking Histograms of any complexity quick, easy and effective, and then successfully use them in various fields.
The Histograms designed with ConceptDraw DIAGRAM are vector graphic documents and are available for reviewing, modifying, converting to a variety of formats (image, HTML, PDF file, MS PowerPoint Presentation, Adobe Flash or MS Visio), printing and send via e-mail in one moment.