IDEF0 Visio
“IDEF0” is a compound acronym from “ICAM Definition for Function Modelling”, where “ICAM” is another acronym for “Integrated Computer Aided Manufacturing”. The mentioned IDEF0 is a function modelling methodology, used to describe the manufacturing functions, offering a functional modelling language for the development, analysis, re-engineering and integration of business processes, information systems and software engineering analysis.
The “IDEF0” is a part of the “IDEF” family of modelling languages, used in the software engineering sphere of business activity. It is built on the functional modelling language called “SADT”, which is an acronym to the “Structured Analysis and Design Technique”. This “IDEF0 Functional Modelling method” was created for a purpose of modelling the actions, activities and decisions of some organization or system, being derived from the established graphic modelling language “SADT”, as was mentioned before, that was developed by SofTech, Inc. company.
IDEF0 includes a definition of a graphical modelling language and a description of a comprehensive methodology for developing models, being used to show system control, functional flow and data flow of the lifecycle processes. IDEF0 can graphically represent a wide range of manufacturing and other business operations of any complexity, providing the precise as well as rigorous description, promoting the consistency of interpretation as well as usage.
In 1981 the “ICAM program” developed a few techniques known as the “IDEF” ones, including “IDEF0”, which was used to produce a so called "function model” that is known to be a structured representation of the functions, processes or activities within the subject area or modelled system, as mentioned before. The techniques include also “IDEF1”, which are used for producing a so called "information model", that represents the semantics and the structure of information within some modelled system or subject area. “IDEF2” is another technique used for producing a so called "dynamics model”, which represents the time-varying behavioral characteristics of the modelled system or subject area.
IDEF0 may be also used for modelling automated as well as non-automated systems. It may be used for defining the requirements for new systems, specifying the functions and designing the implementations, that performs the functions and meets the requirements. IDEF0 can also be used for analyzing the functions for the existing systems, while these systems perform, and for recording the mechanisms of the mentioned systems, that they are sticking to.
As a result, applying “IDEF0” to a system means creating a model, consisted of a hierarchical series of text, glossary and diagrams, which are referenced to each other. The two main modelling components are functions, which are usually illustrated in a way of a diagram with the use of boxes, and the data as well as the objects that relate with each other representing their functions in a way of the arrows. The “IDEF0” model can be displayed as an example of what you can do in ConceptDraw DIAGRAM and you might find it having the right solution, which is available to be downloaded from this site or from ConceptDraw STORE application, where all the solutions are being kept so the ConceptDraw DIAGRAM users can find them when it’s needed.
Each activity within the mentioned model is described with help of a verb-based label placed in a shape of a box. The inputs are illustrated with help of arrows entering the left side of the activity box. At the same time, the outputs are illustrated as already exiting arrows on the right side of the box. Controls are represented in a way of arrows entering the top of the box, when mechanisms are represented using the shapes of arrows entering from the bottom of the box. All mentioned constituents of the “IDEF0” model, which are Controls, Inputs, Outputs as well as the Mechanisms are all referred to as “concepts”.
IDEF0 is a model, consisting of a hierarchical series of text, glossary cross and diagrams, which all referenced to each other, having the two main modelling components, which are functions that are usually represented on a diagram with help of boxes and data with objects that interrelate the mentioned functions, represented by arrows. The IDEF0 model is simple to create having ConceptDraw DIAGRAM software, as the mentioned application is a great alternative of MS Visio for Mac, as MS Visio itself cannot be used on MacBook, but ConceptDraw DIAGRAM software works both on Windows and on Mac. Moreover, all the files from MS Visio can always be imported to ConceptDraw DIAGRAM and all of the files from ConceptDraw DIAGRAM can be always opened in MS Visio, if needed.
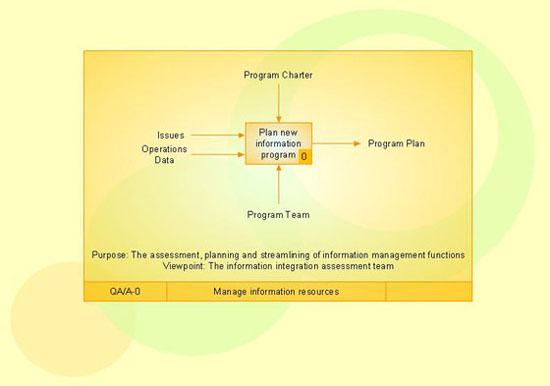
The “IDEF0 process” itself starts with the identification of the main function, which is expected to be decomposed, being identified on a “Top Level Context Diagram”, defining the scope of the so called “IDEF0 analysis”. You can see an example of a “Top Level Context Diagram” for a particular information system management process on this site as well as in one of the solutions, which a few “lower-level diagrams” can be generated from. ConceptDraw DIAGRAM is known to be an “IDEF0 Diagram Software”, which works same good on Windows and Mac and it is well-known to be a great alternative to MS Visio for Mac as you can tell yourself once you download this unique application from this site.
Having the mentioned IDEF0 Diagram Software extended with so called “IDEF0 Diagrams solution”, which can be found and downloaded from the “Software Development area” of “ConceptDraw Solution Park” from this site means having a very powerful diagramming as well as vector drawing IDEF0 software, which you can use when you need to create an IDEF0 Diagram of any complexity within only a few hours or even minutes, using the pre-made examples as the drafts for your own unique models.

Sample 1. IDEF0 Diagrams Solution
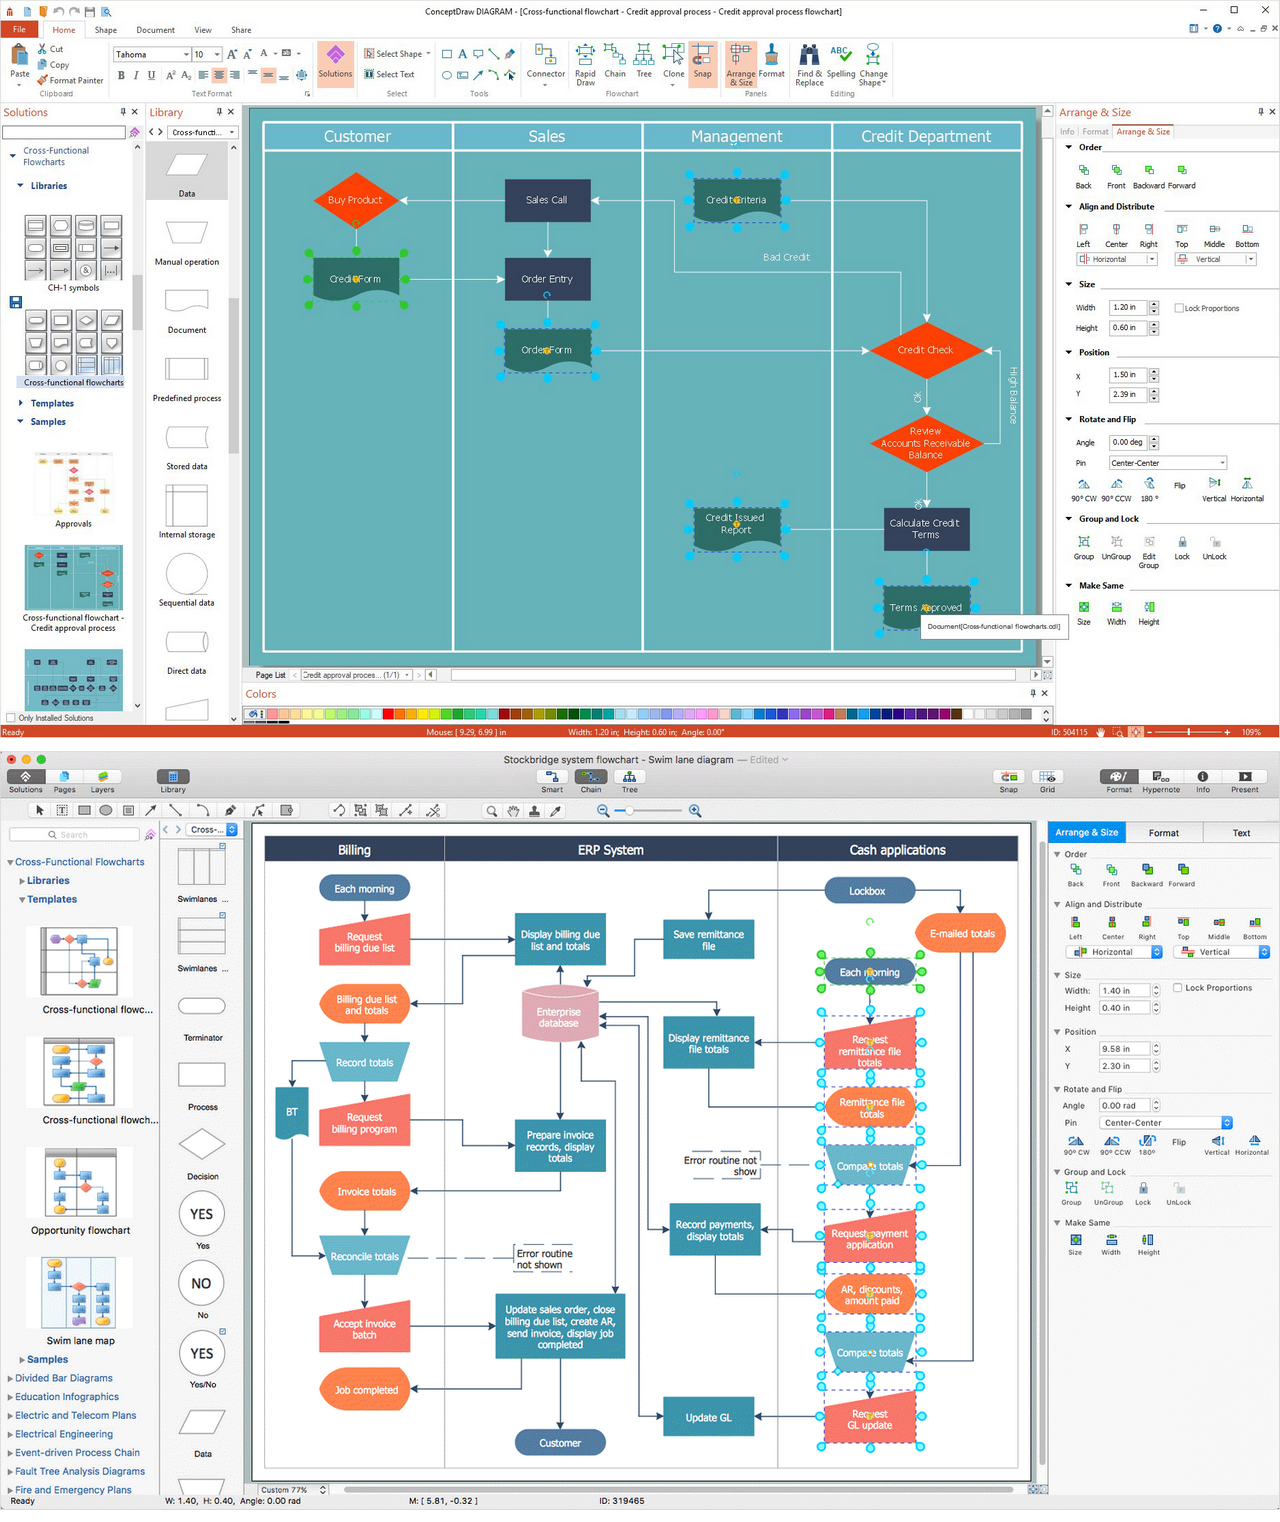
Compatibility of ConceptDraw DIAGRAM and MS Visio is increadibly useful and convenient for exchanging information between those users who use ConceptDraw DIAGRAM and their colleagues who utilize MS Visio.
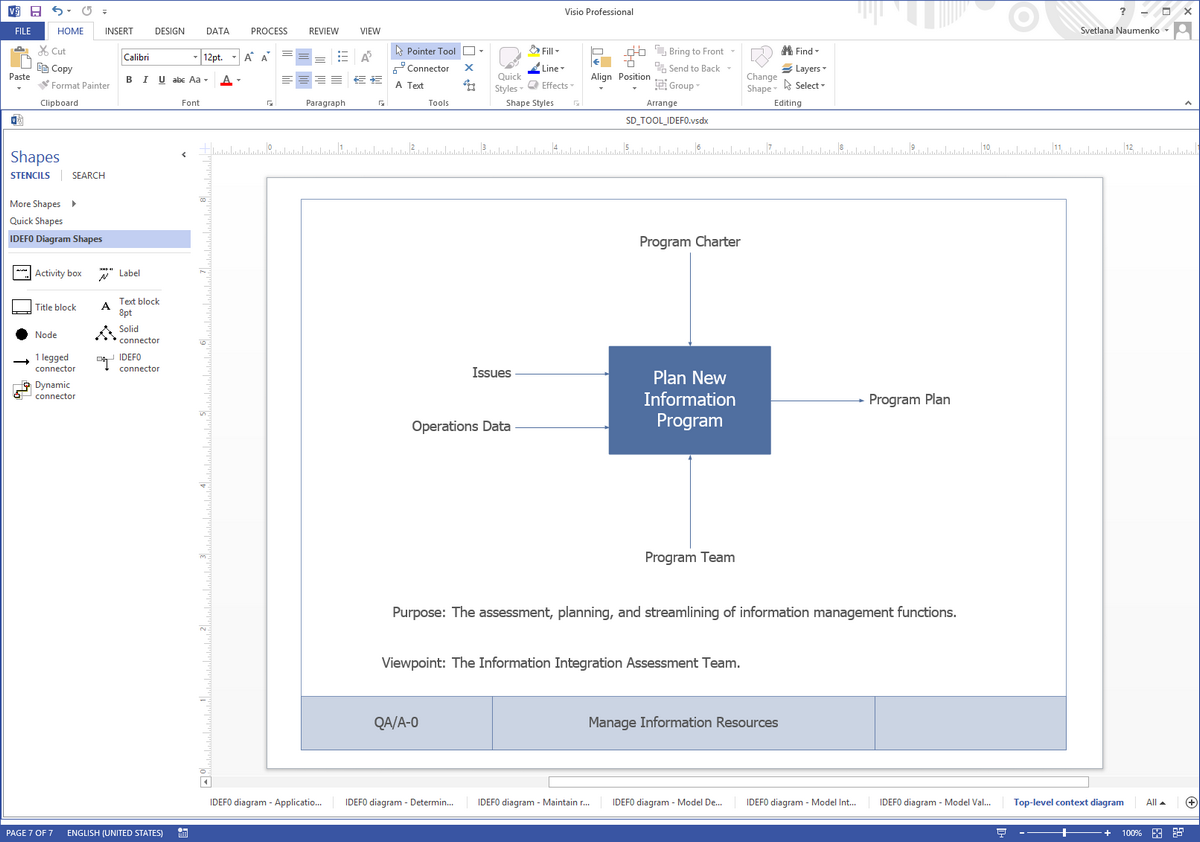
Sample 2. IDEF0 Diagrams in MS Visio
All IDEF0 diagrams created in ConceptDraw DIAGRAM application are vector graphic documents that can be reviewed, modified as well as converted to MS Visio “.VSDX” file format. To obtain the IDEF0 Visio documents from ConceptDraw DIAGRAM documents you can use the wide export possibilities of ConceptDraw DIAGRAM ConceptDraw DIAGRAM can export and also import MS Visio files, which can help MS Visio users to get used to a better software starting to use ConceptDraw DIAGRAM as a main tool for achieving their goals in drawing. After importing the Visio files in ConceptDraw DIAGRAM you can always simply change them according to your needs using the exsting pre-designed vector objects from “IDEF0 Diagrams library” from the IDEF0 Diagrams Solution.
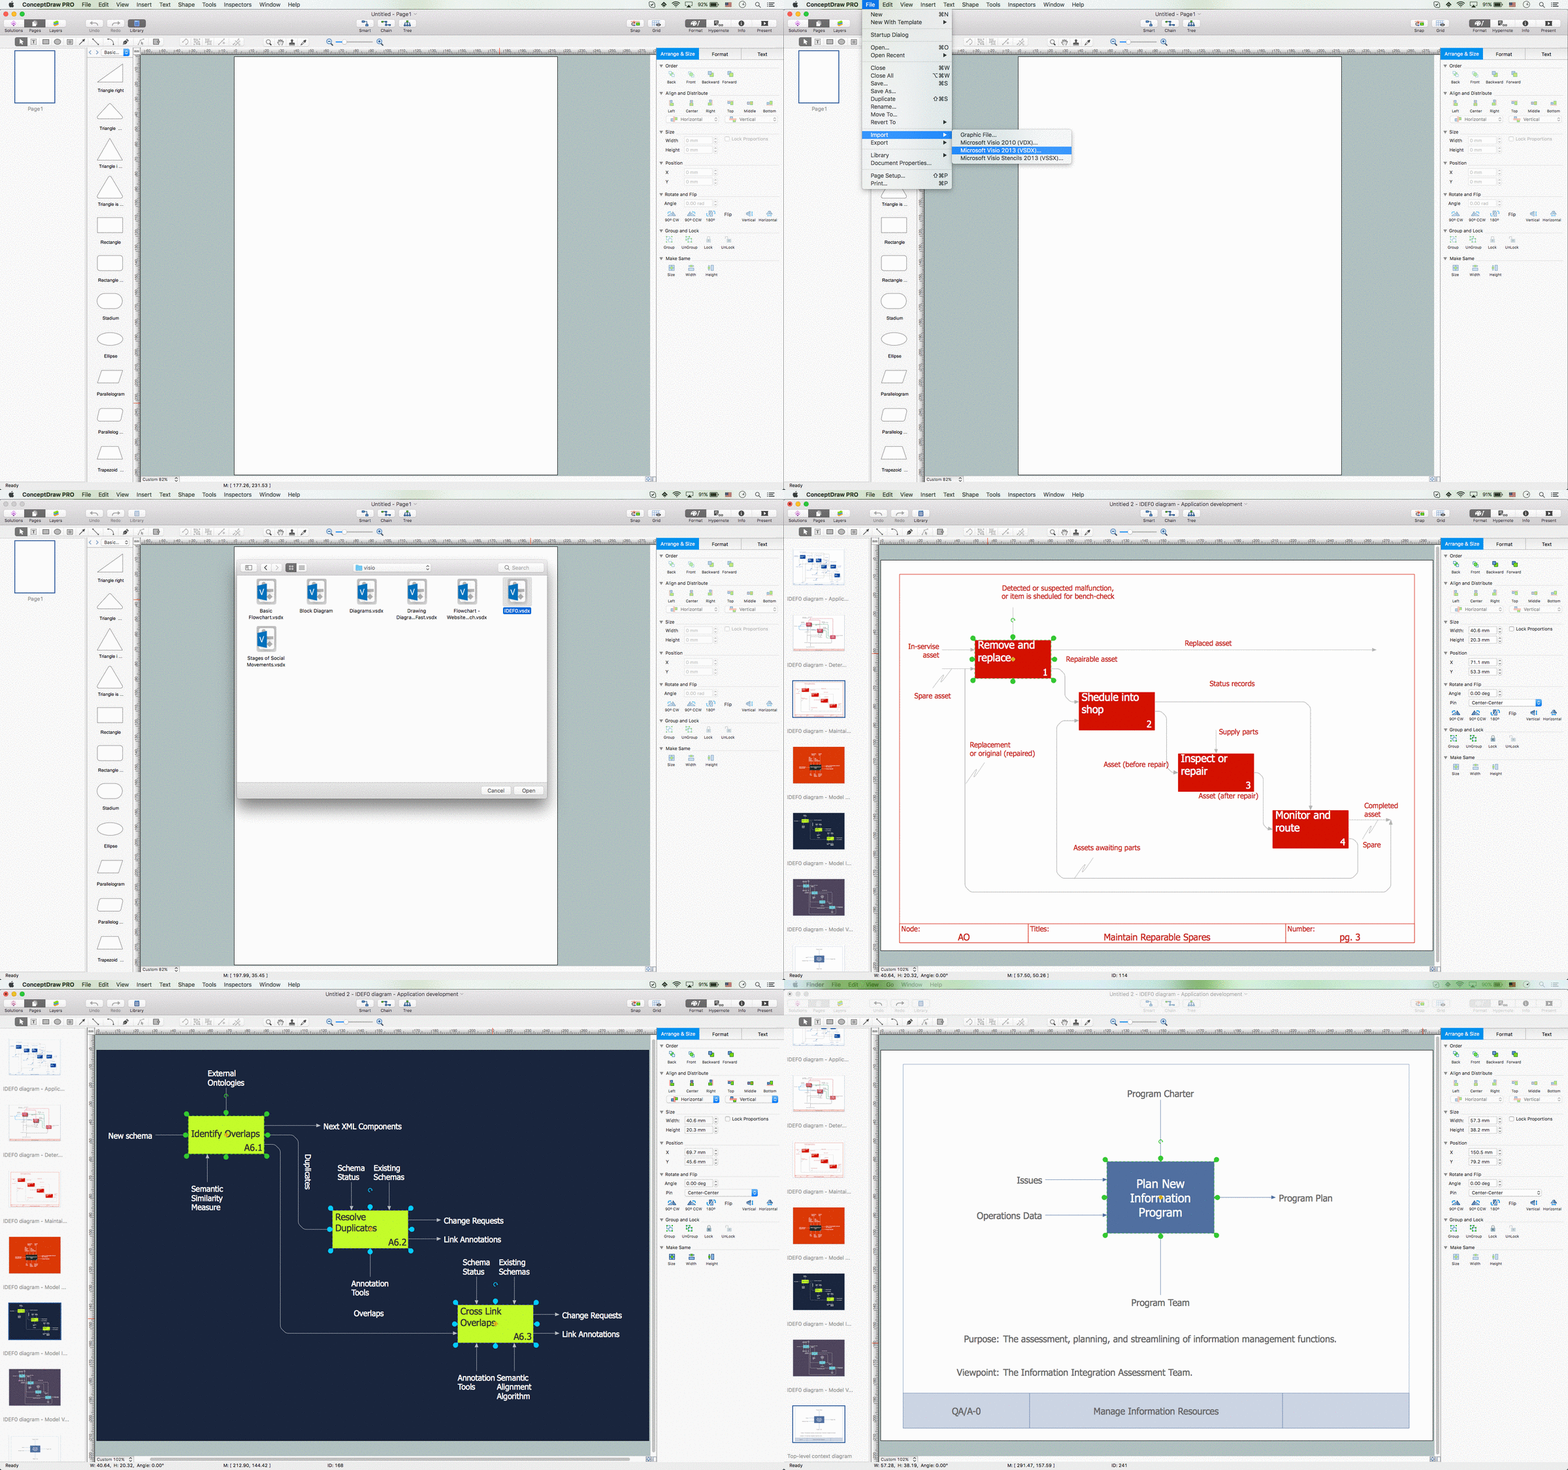
Sample 3. IDEF0 Diagrams in MS Visio
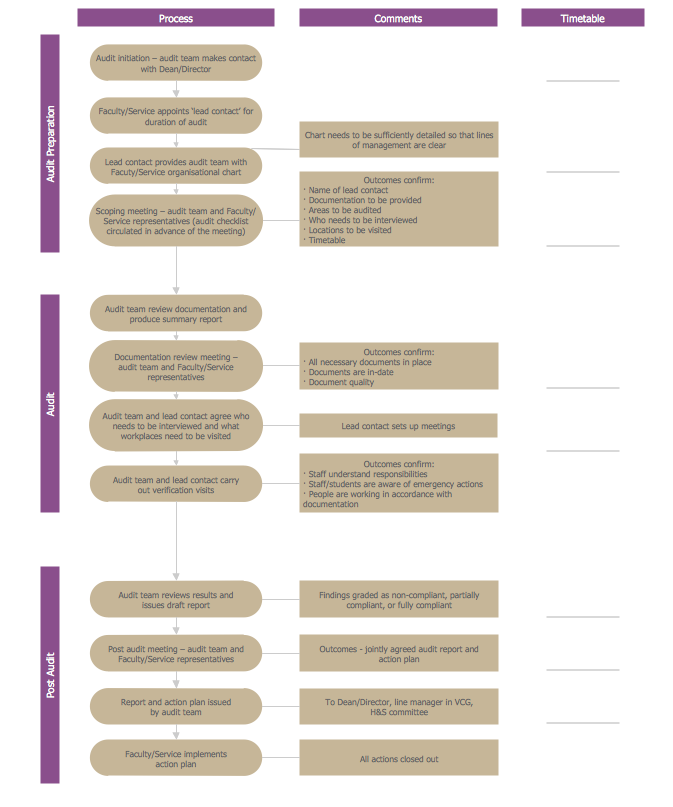
Use the IDEF0 Diagrams Solution for ConceptDraw DIAGRAM software to create your own professional looking ConceptDraw documents with IDEF0 Diagrams of any complexity quick, easy and effective, and also IDEF0 Visio documents. Apply them actively and successfully in your work activity.
All source documents are vector graphic documents. They are available for reviewing, modifying, or converting to a variety of formats (PDF file, MS PowerPoint, MS Visio, and many other graphic formats) from the ConceptDraw STORE. The IDEF0 Diagrams Solution is available for all ConceptDraw DIAGRAM users.