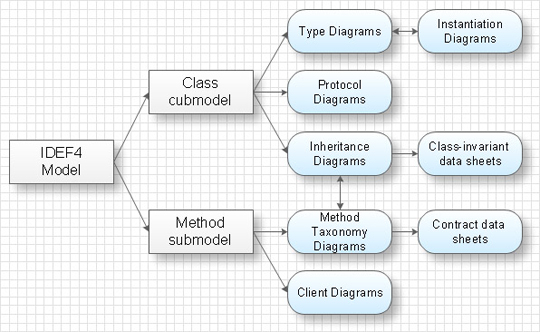
The diagram of heredity represents hereditary ties between classes. For example, at the picture below the structure of heredity and Filled Rectangle class behavior is shown.
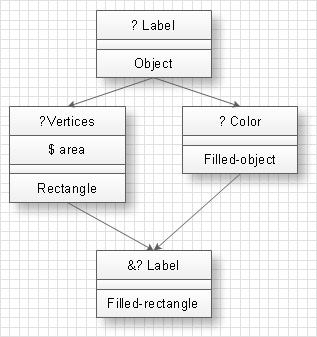
Diagrams of protocols define arguments of classes for protocols call. At the picture below the diagram of a protocol for Fill-closed-object is shown.
It is obvious from the diagram that Fill-closed-object gets requests from Polygon object (primary argument) and Color object (secondary argument) and returns the request to Polygon object.
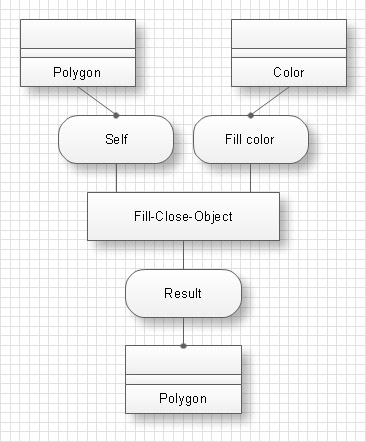
Diagrams of objects creation come into diagrams of types and describe possible situations at composition of ties between created objects..
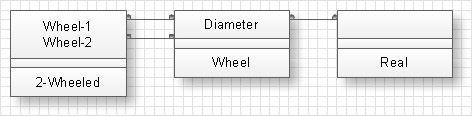
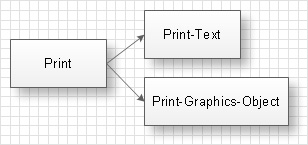
The diagram of methods systematization describes specific type of system behavior at the influence on the set of methods. Arrows on the diagram point at additional influences, done at the sets of methods. The sets of methods are grouped accordingly to additional obligatory conditions. At the example given below the set of methods ‘Print’ has an obligatory condition that the object must be printed and the set of methods ‘Print-Text’ – that the printed object must be a text.
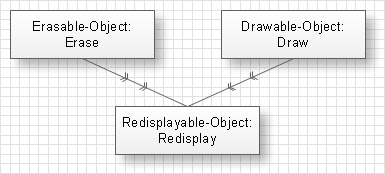
Diagrams of clients represent clients and operations suppliers. Double arrows on the diagram point from the called operation to the calling operation. At the example given below a diagram of clients is shown. On this diagram the Redisplay operation which belongs to Redisplayable-object class calls the Erase operation of the Erasable-object class and the Draw operation of the Drawable-object class.
IDEF4 standard implies not only graphical presentation but the additional information about diagrams of heredity, methods systematization and types which are contained in specifications. Accordingly to IDEF4 standard there are specifications of invariant classes and specifications of obligatory conditions.
Specifications of invariant classes are connected with diagrams of heredity and define influences which form properties of each concrete class of objects. For each class there exists a separate specification. For instance, the properties “Each square has four sides” and “All square sides are equal” are the properties of specification of the Square class.
Specifications of obligatory conditions are connected with sets of methods in diagrams of methods systematization and define obligatory conditions, which influence on methods and which methods should satisfy.
For each set of methods there is one specification of obligatory conditions. For example the set of methods ‘Pop’, which deletes values from the stack, as obligatory condition will have the absence of attempts to delete the value from the stack if the stack is empty.
IDEF 4 standard is developed by professional planners and programmers of the U.S. Air Force Armstrong Laboratory and is intended to facilitate the usage of object-oriented technologies at software development.
TEN RELATED HOW TO's:
Mathematical Drawing Software - Draw mathematical illustration diagrams easily from examples and templates!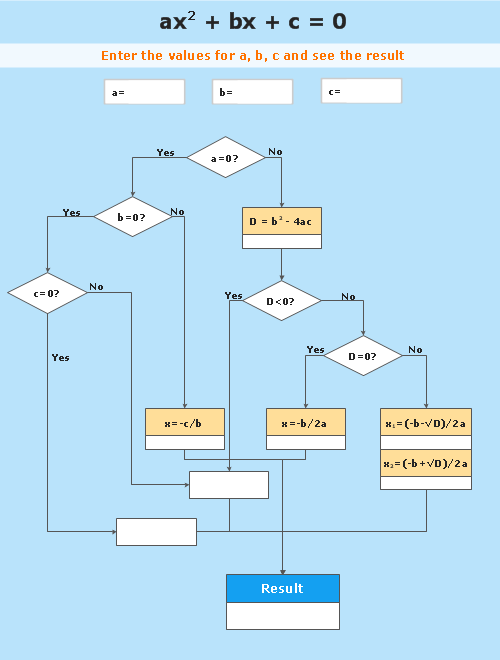
Picture: Basic Diagramming
Related Solution:
Working with information can be quite tedious, furthermore, some data can be quite difficult to perceive without any graphic representation. So, to facilitate your work, you can use business diagrams, such as simple flowcharts or Gantt charts for project management and orgcharts for clarifying your company structure. You can use a proper software, like ConceptDraw Pro, draw them on paper, or use whiteboards, but it is more convenient to use a digital tool.
This diagram shows a cross-functional flowchart that was made fore telecom service provider. A workflow of a common telecommunication service provider has a rather branched structure. Thus, it is useful to have a flow chart to visualize the sequences and interrelations of the work flow steps. Business process flowchart contains 17 processes and 4 decision points,that are distributed through 2 lines depicting the participants involved. Also there are connectors that show the data flow within processes. This flowchart displays a detailed model of the telecom service trading process, as well as all participants in the process and how they interact with each other.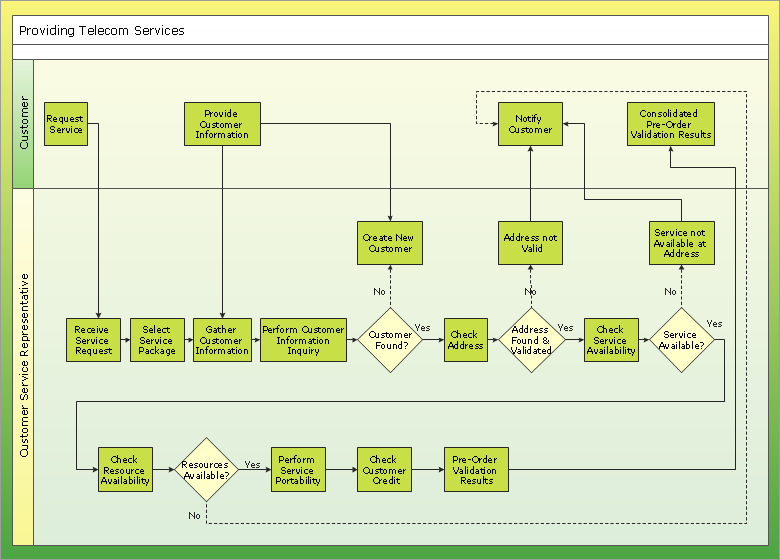
Picture: Business diagrams & Org Charts with ConceptDraw DIAGRAM
Data flow diagrams are the graphical tool, used in the visualization of data flow of some data processing systems. It is the valuable process modeling tool. Also designing DFD is the important component of the initial part of any information system development project. The standard symbols are used to represent the interaction of a system components and how various kinds of components influence on data flow. The ConceptDraw Data Flow Diagrams solution is design to assist professional software engineers in making DFDs according to Gane and Sarson, and Yourdon and Coad notations.
Do you imagine yourself as a successful IT specialist? To your mind, they all use data flow diagram examples to learn and to get inspired. Aren’t you still with us?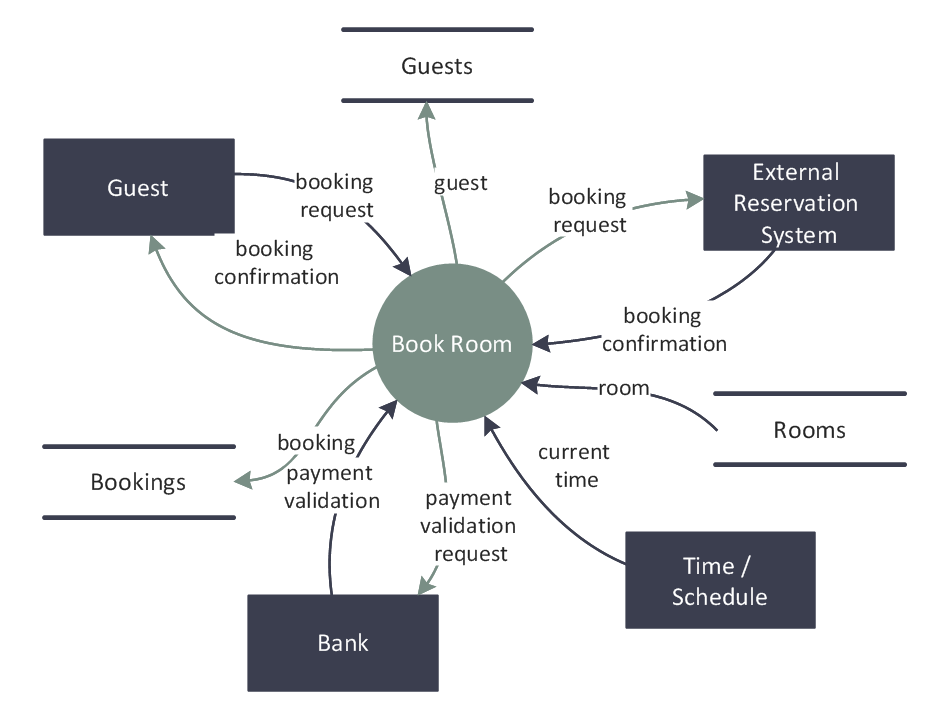
Picture: Data Flow Diagram Examples
Related Solution:
When trying to figure out the nature of the problems occurring within a project, there are many ways to develop such understanding. One of the most common ways to document processes for further improvement is to draw a process flowchart, which depicts the activities of the process arranged in sequential order — this is business process management. ConceptDraw DIAGRAM is business process mapping software with impressive range of productivity features for business process management and classic project management. This business process management software is helpful for many purposes from different payment processes, or manufacturing processes to chemical processes. Business process mapping flowcharts helps clarify the actual workflow of different people engaged in the same process. This samples were made with ConceptDraw DIAGRAM — business process mapping software for flowcharting and used as classic visio alternative because its briefly named "visio for mac" and for windows, this sort of software named the business process management tools.
This flowchart diagram shows a process flow of project management. The diagram that is presented here depicts the project life cycle that is basic for the most of project management methods. Breaking a project into phases allows to track it in the proper manner. Through separation on phases, the total workflow of a project is divided into some foreseeable components, thus making it easier to follow the project status. A project life cycle commonly includes: initiation, definition, design, development and implementation phases. Distinguished method to show parallel and interdependent processes, as well as project life cycle relationships. A flowchart diagram is often used as visual guide to project. For instance, it used by marketing project management software for visualizing stages of marketing activities or as project management workflow tools. Created with ConceptDraw DIAGRAM — business process mapping software which is flowcharting visio alternative or shortly its visio for mac, this sort of software platform often named the business process management tools.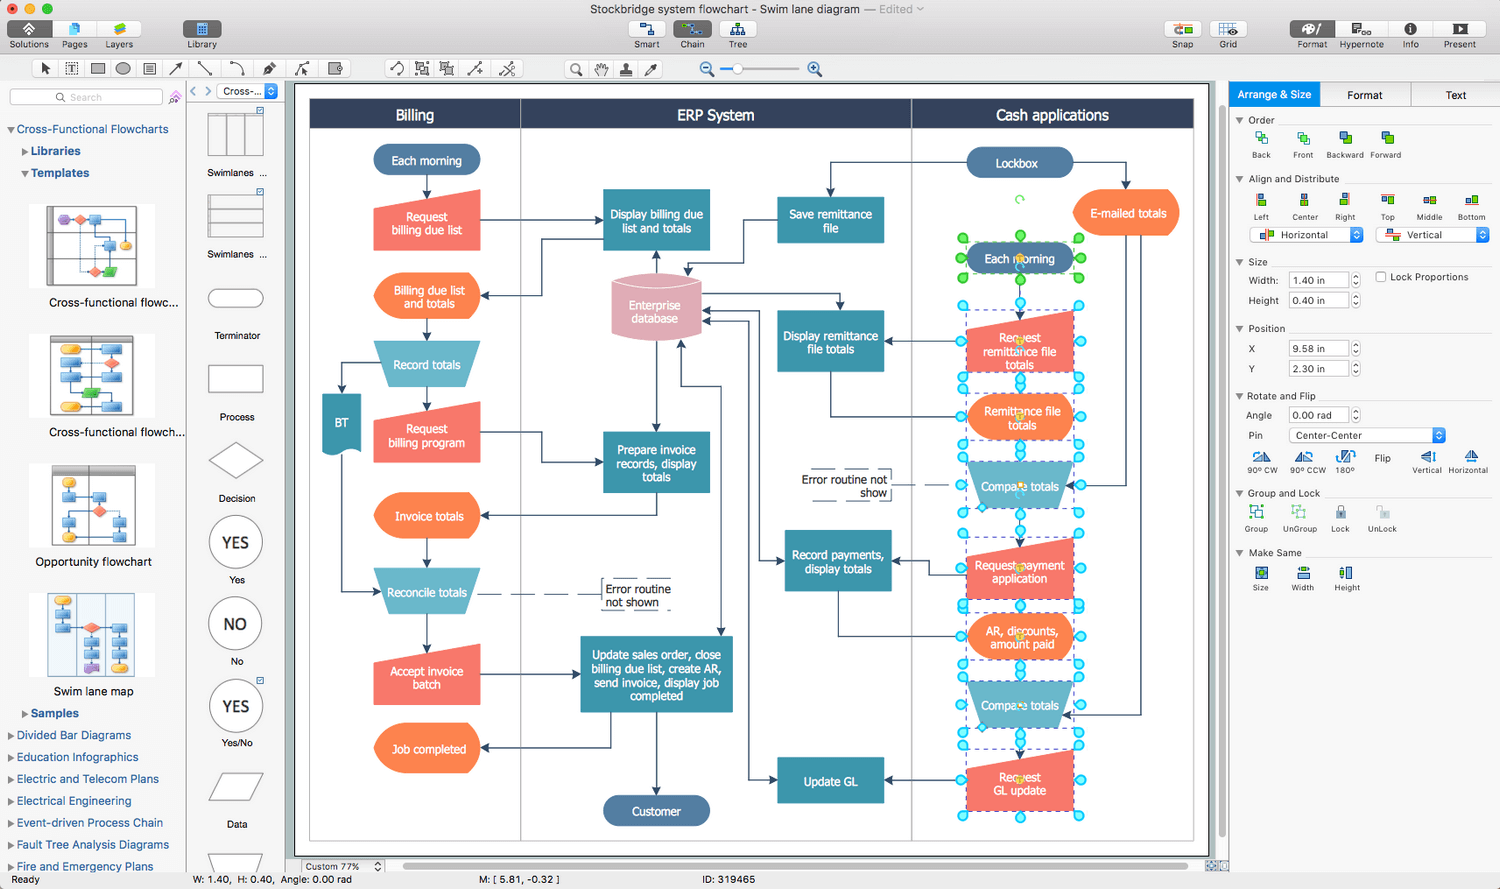
Picture: Process Flowchart: A Step-by-Step Comprehensive Guide
Related Solution:
Stakeholder management is a critical component to the successful delivery of any project, programme or activity.
ConceptDraw DIAGRAM is a powerful diagramming and vector drawing software. Now, thanks to the Stakeholder Onion Diagrams Solution included to the Management Area of ConceptDraw Solution Park, ConceptDraw DIAGRAM became also unique stakeholder management system design software.
Picture: Stakeholder Management System using Onion Diagram
Related Solution:
It is important to have an electrical circuits scheme, when you plan a renovation or move to a new apartment. You have to arrange interior according to that plan, and it’s trouble-free to create wiring diagrams with ConceptDraw DIAGRAM , furthermore, this software has all the features needed to create an interior plan as well. So, get inspired by tons of examples included to ConceptDraw DIAGRAM solutions, and start your diagramming experience!
A wiring diagrams, that are represented on this drawing was created to depict the components of the electrical circuit schemes. These diagrams are created to depict the information about circuit arrangements and connections. Wiring diagrams, in contrast to physical drawings, use standard symbol's notation to depict different circuit devices and connections. That is why, wiring diagrams are applied to discover and repair electrical and electronic circuits. The vector graphic objects provided by ConceptDraw Electrical Engineering solution can help any specialist in electric engineering to design electrical schemes, circuit and wiring plans, power systems charts, and Maintenance and Repair diagrams.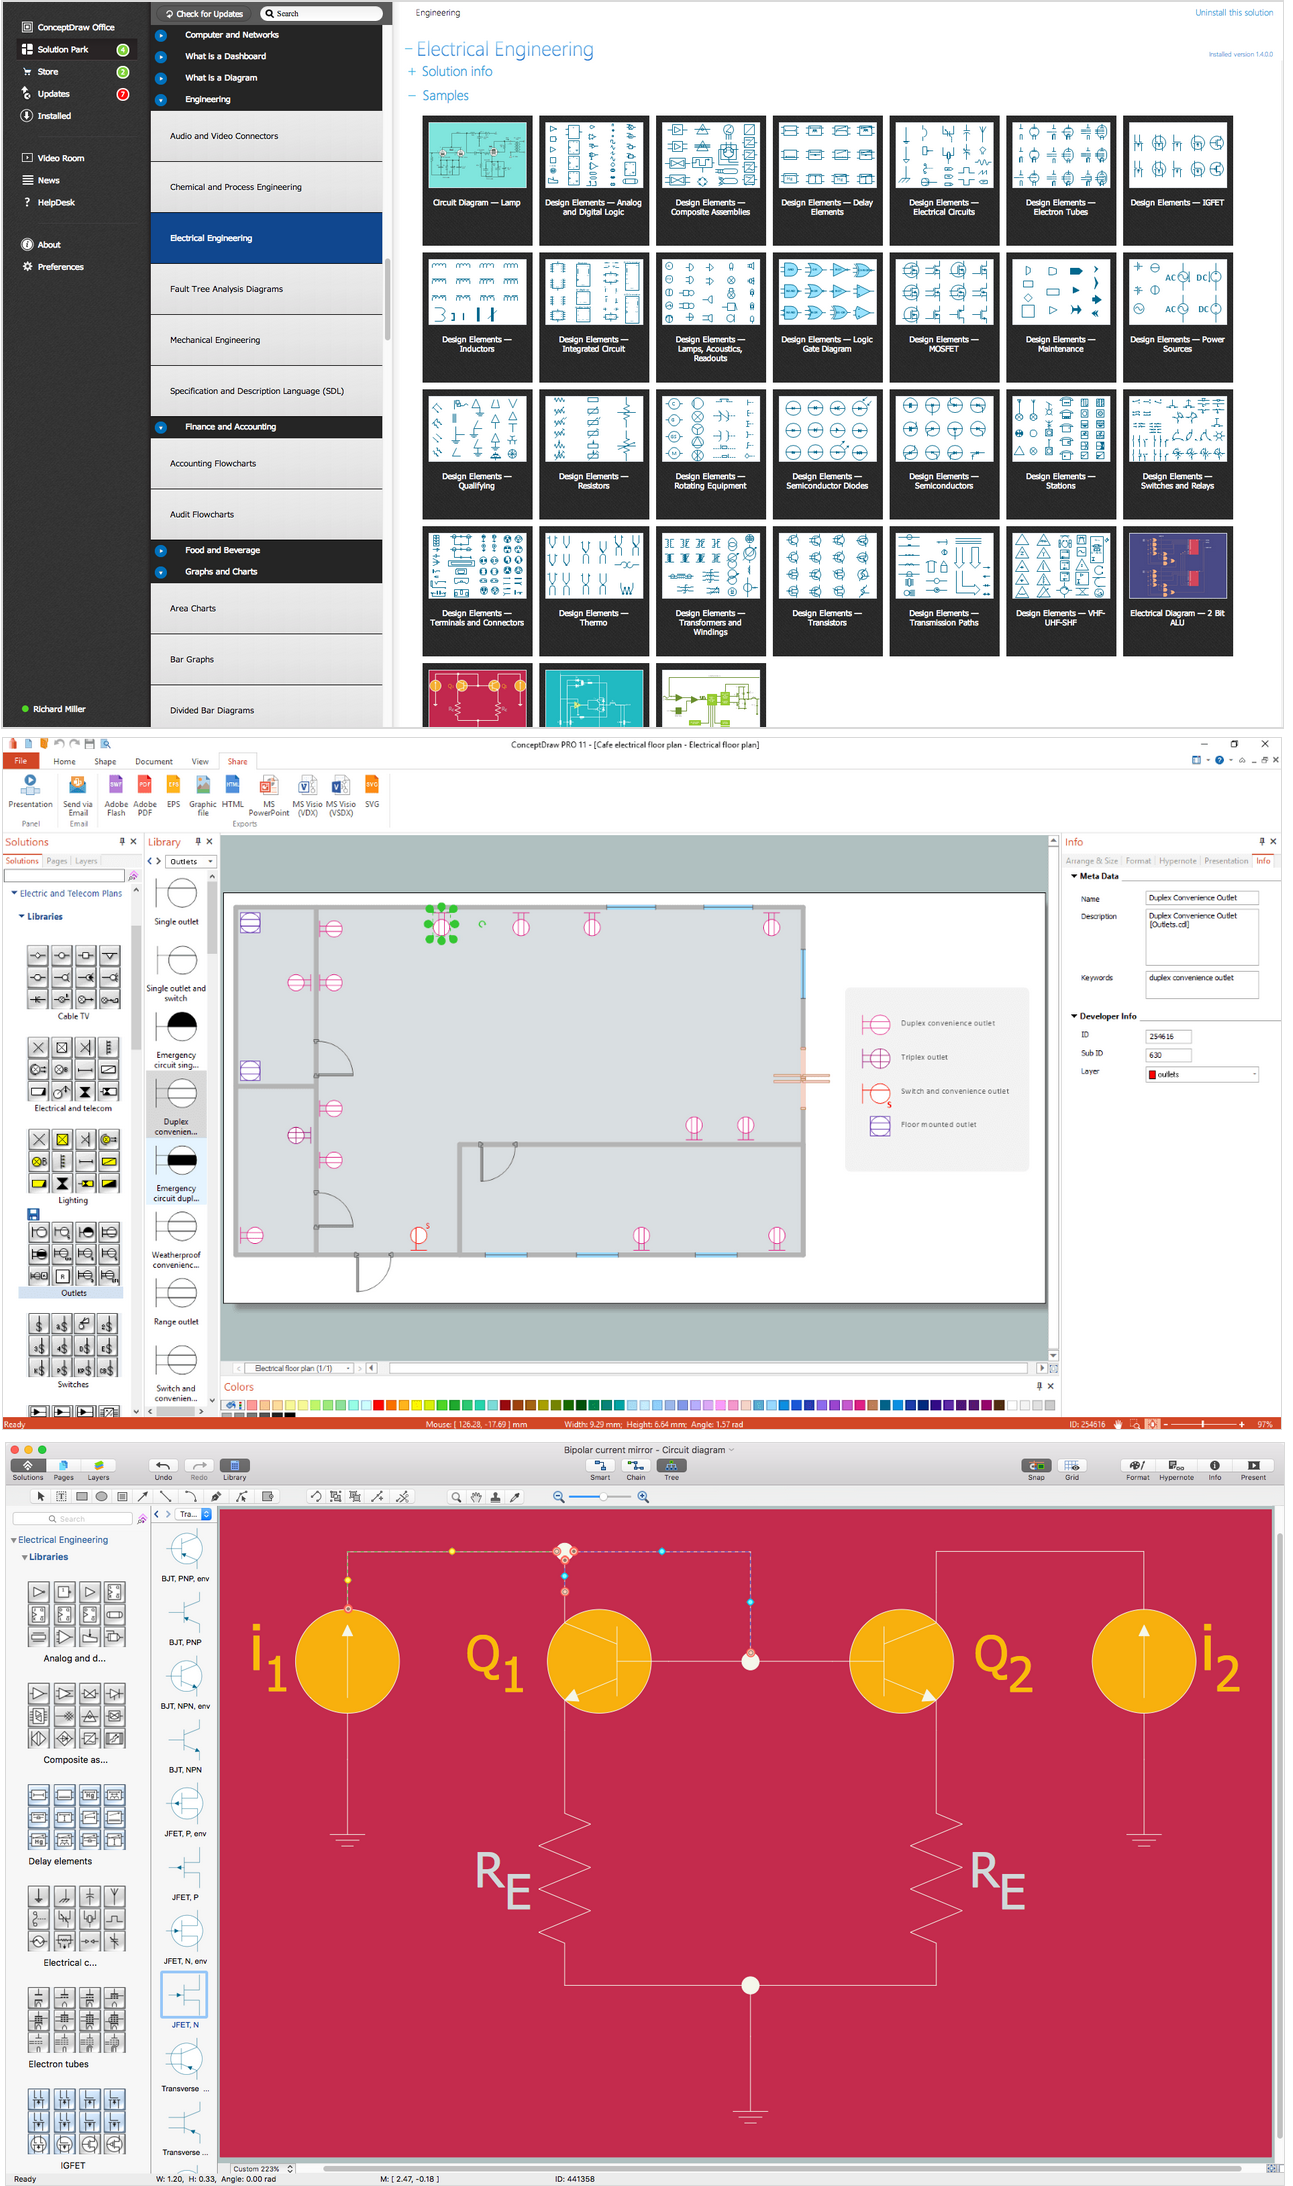
Picture: Wiring Diagrams with ConceptDraw DIAGRAM
Related Solution:
ConceptDraw DIAGRAM is perfect for software designers and software developers who need to draw Network Layout Diagrams._Win_Mac.png)
Picture: Network Diagramming Software for Design Network Layout Diagrams
Related Solution:
Use Case Diagrams technology. Using visual graphical objects IDEF1 standard allows to model information interrelations.
Picture: IDEF1 standard
This sample was created in ConceptDraw DIAGRAM diagramming and vector drawing software using the Flowcharts solution from the Diagrams area of ConceptDraw Solution Park.
This sample shows the Flowchart that displays the procedures of 2PP (two-party preferred) voting and counting the voters. The two-party-preferred vote is the result of the elections that was distributed to the final two parties.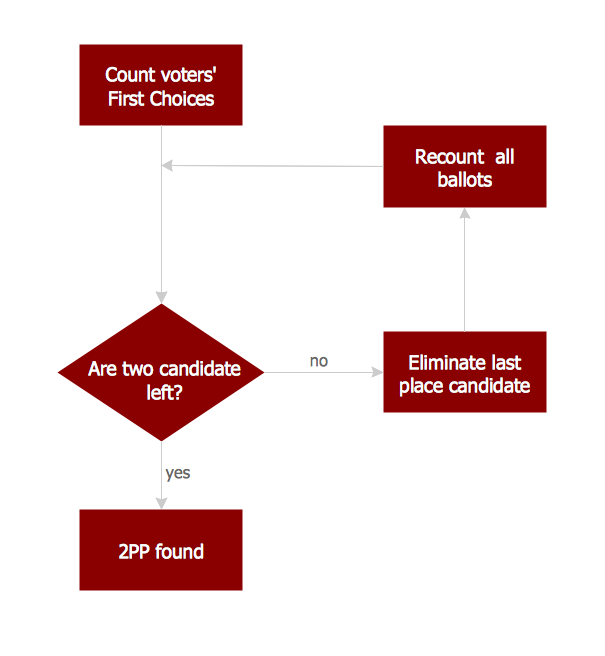
Picture: Basic Flowchart Images. Flowchart Examples
Related Solution:
Process mapping helps with sharing business results and reorganizing workflow. In almost every case, after creating a sales process flowchart the steps that are redundant become obvious for a manager. It's easy to find a flowchart examples that will help in developing one for your business.
This sales process flowchart consists of a sequence of steps that represent a simple sale process. Each step is shown graphically by a rectangle representing processing steps or an activity, or a diamond representing a decision. These rectangles are linked by arrows, that indicate the direction of the sales workflow. ConceptDraw Sales Flowcharts solution delivers a the full set of classical flowchart notation symbols, along with sales-related icons and pictograms.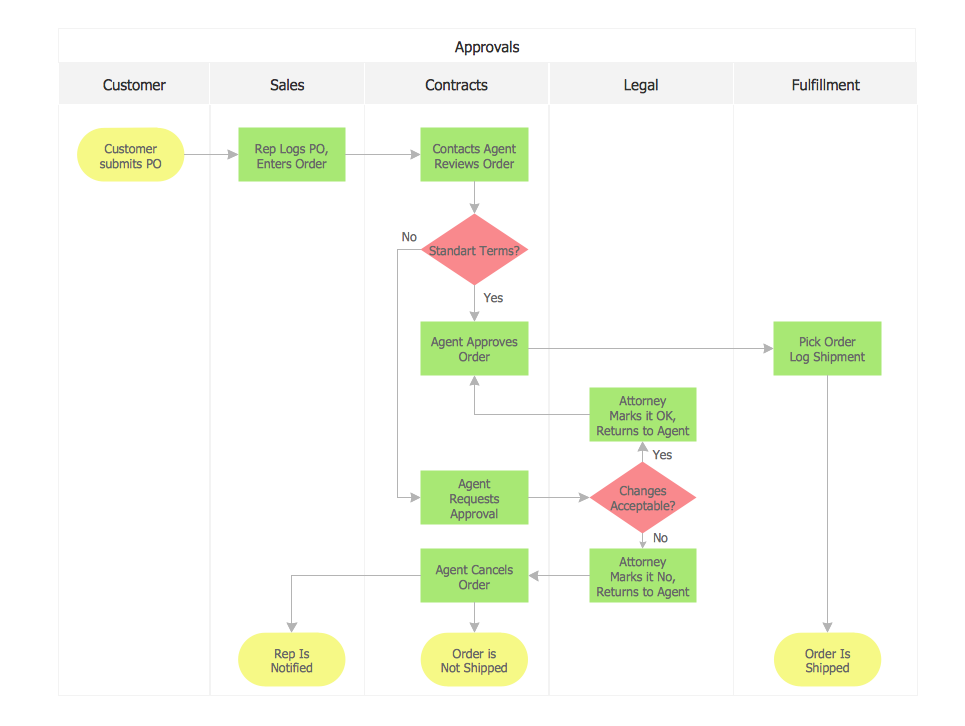
Picture:
Sales Process Flowchart
Flowchart Examples
Related Solutions: