Make a Histogram
ConceptDraw DIAGRAM extended with Histograms solution from the Graphs and Charts area of ConceptDraw Solution Park lets you make a Histogram of any complexity in minutes.
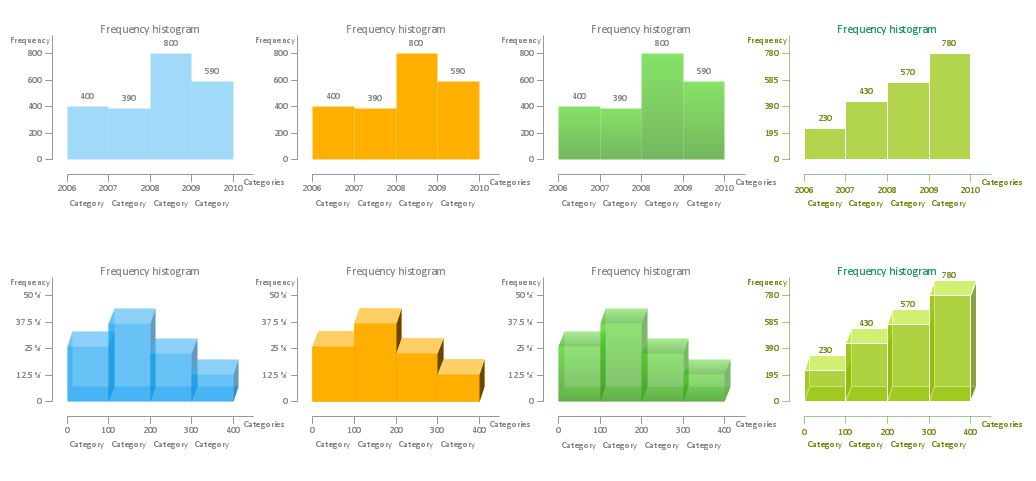
Example 1. Make a Histogram — Histograms library Design Elements
To make a Histogram use the predesigned vector objects from the Histograms library of Histograms solution. You need just a few movements - drag the predesigned Histogram object from the library to the document and simply set values according to your data. And now professional looking, visual and clear Histogram will be completed.

Example 2. Make a Histogram — Black cherry tree histogram
Make a Histogram in ConceptDraw DIAGRAM and you will get a vector graphic document which can be reviewed, modified and converted to MS Visio format, MS PowerPoint Presentation, PDF.
Use also templates and samples from the Histograms Solution offered in ConceptDraw STORE. You can apply them as the base for your own Histograms.

Example 3. Make a Histogram — Page load time sample
The samples you see on this page were created in ConceptDraw DIAGRAM software using the tools of Histograms Solution from the Graphs and Charts area. These samples demonstrate the solution's capabilities and the professional results you can achieve. An experienced user spent 5 minutes creating every of these samples.
Use Histograms Solution for ConceptDraw DIAGRAM to make a Histogram quick, easy, and effective.
All source documents are vector graphic documents. They are available for reviewing, modifying, or converting to a variety of formats (PDF file, MS PowerPoint, MS Visio, and many other graphic formats) from the ConceptDraw STORE. The Histograms Solution is available for all ConceptDraw DIAGRAM or later users.


