Maps and Directions
ConceptDraw DIAGRAM diagramming and vector drawing software extended with Directional Maps Solution from the Maps Area of ConceptDraw Solution Park is a powerful maps and directions design software. Let's review the tools of this solution.

Example 1. Maps and Directions
Look at the variety of libraries offered by Directional Maps Solution - 10 libraries with 338 vector shapes. How is it easy design:
- directional maps,
- transit maps,
- road maps,
- various navigation schemes,
and many other kinds of maps using these ready objects!


The libraries and also collection of predesigned templates, samples, and examples are the full set of tools needed for effective drawing.

Example 2. 3D Directional Map
The following features make ConceptDraw DIAGRAM the best Maps and Directions Design software:
- You don't need to be an artist to draw professional looking directional maps in a few minutes.
- Large quantity of ready-to-use vector objects makes your drawing maps quick and easy.
- Great number of predesigned templates and samples give you the good start for your own maps.
- ConceptDraw DIAGRAM provides you the possibility to use the grid, rules and guides. You can easily rotate, group, align, arrange the objects, use different fonts and colors to make your diagram exceptionally looking.
- All ConceptDraw DIAGRAM documents are vector graphic files and are available for reviewing, modifying, and converting to a variety of formats: image, HTML, PDF file, MS PowerPoint Presentation, Adobe Flash, MS Visio.
- Using ConceptDraw STORE you can navigate through ConceptDraw Solution Park, managing downloads and updates. You can access libraries, templates and samples directly from the ConceptDraw STORE.
- If you have any questions, our free of charge support is always ready to come to your aid.
TEN RELATED HOW TO's:
A set of predesigned fields and positions allows producing baseball diagrams without any drawing experience.
Picture: Simple Baseball Field — Sample
Related Solution:
These libraries of vector objects depict the Site Accessories and Parking and Roads elements. They are needed to draw architectural and landscape plans that show the architectural elements around buildings: parking spaces, hiking and biking trails, drainage systems, lights, and vehicle access control elements. These libraries are included into ConcepDraw solution for Site Planning. Site Accessories and Parking, Roads libraries contain near 40 vector images that will help depict an a surrounding territory at building plans.
These libraries of vector objects depict the Site Accessories and Parking and Roads elements. They are needed to draw architectural and landscape plans that show the architectural elements around buildings: parking spaces, hiking and biking trails, drainage systems, lights, and vehicle access control elements. These libraries are included into ConcepDraw solution for Site Planning. Site Accessories and Parking, Roads libraries contain near 40 vector images that will help depict an a surrounding territory at building plans.
Picture: Building Drawing. Design Element Site Plan
Related Solution:
Plumbing systems are very important for any manufacture, and it's a good practice to have a clear scheme of that system. To create one, you should use a piping and instrumentation diagram software with a possibility to save files in vector format, so you can print them without quality loss. ConceptDraw DIAGRAM is a great tool for creating diagrams, and you don't need to be very experienced to use it efficiently.
This example of Piping and Instrumentation Diagram (P&ID) depicts a scheme that illustrates the physical sequence and functional communications of piping, instrumentation and plumbing equipment components of a typical food trailer.
Seeking to avoid health troubles in a mobile food service , the plumbing demands for food trailers must be considered accurately. This P&ID shows all of piping including a basic set of piping system components along with multiple sinks, extra water heaters and other elements to meet health guidelines.
Picture: Piping and Instrumentation Diagram Software
Related Solution:
If you want to find a way to understand complex things in minutes, you should try to visualize data. One of the most useful tool for this is creating a flowchart, which is a diagram representing stages of some process in sequential order. There are so many possible uses of flowcharts and you can find tons of flow charts examples and predesigned templates on the Internet. Warehouse flowchart is often used for describing workflow and business process mapping. Using your imagination, you can simplify your job or daily routine with flowcharts.
Warehouse flowcharts are used to document product and information flow between sources of supply and consumers. The flowchart provides the staged guidance on how to manage each aspect of warehousing and describes such aspects as receiving of supplies; control of quality; shipment and storage and corresponding document flow. Warehouse flowchart, being actual is a good source of information. It indicates the stepwise way to complete the warehouse and inventory management process flow. Also it can be very useful for an inventory and audit procedures.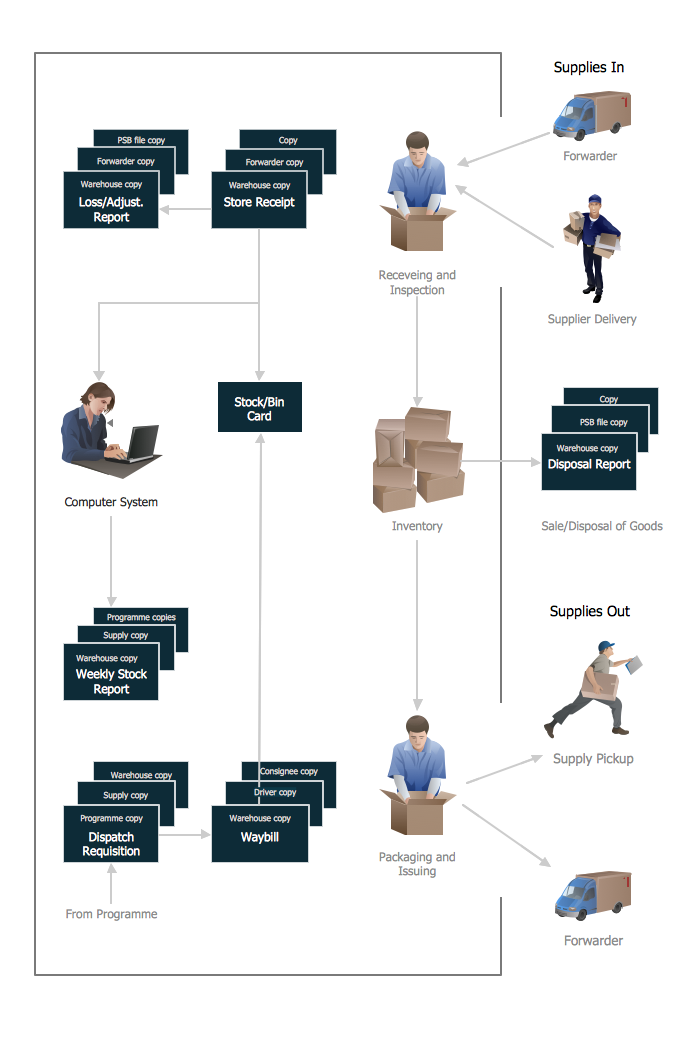
Picture: Flow Chart Example: Warehouse Flowchart
Related Solution:
Tool to draw Metro Map styled inforgraphics. Moscow Metro sample.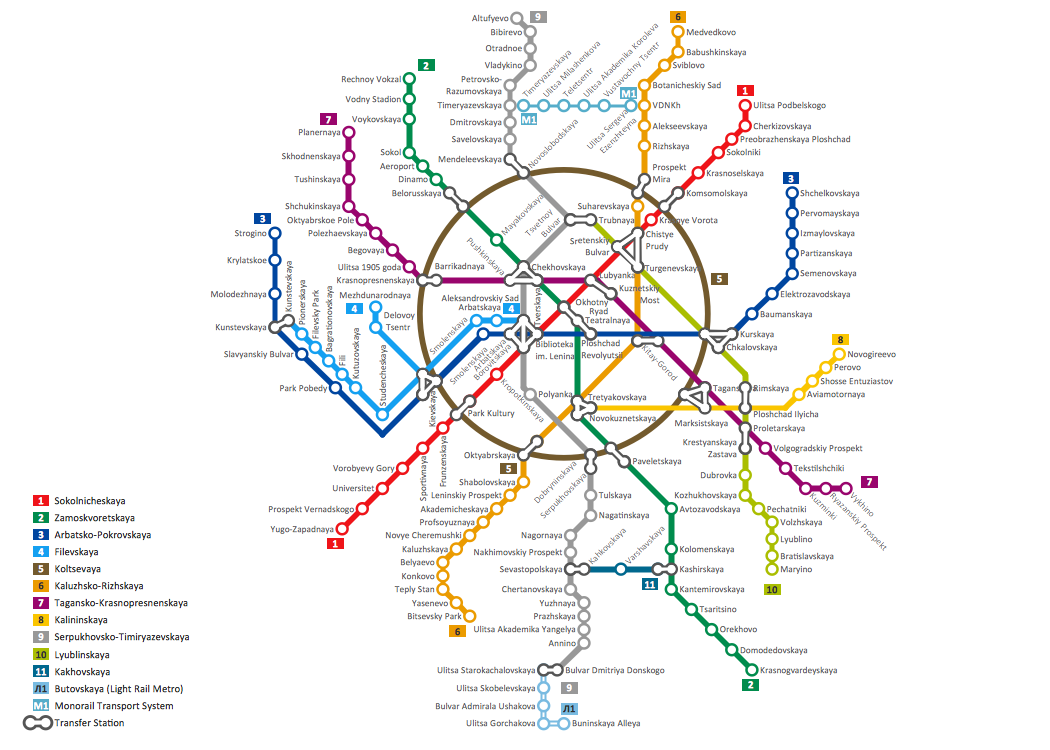
Picture: How to draw Metro Map style infographics? (Moscow)
Related Solution:
ConceptDraw DIAGRAM diagramming and vector drawing software offers the easiest and time-saving way of drawing the MTA Subway Map. Let's try to make sure this with Metro Map Solution from the Maps Area for ConceptDraw DIAGRAM Solution Park.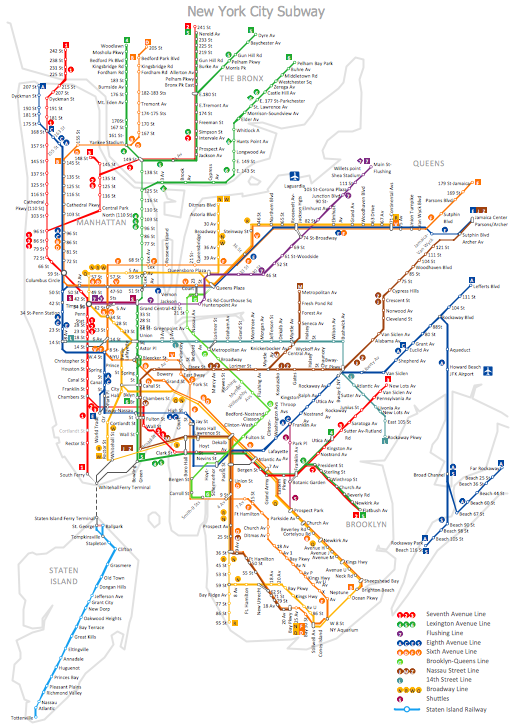
Picture: MTA Subway Map
Related Solution:
Pyramid diagrams help you visualize information as a triangle divided into horizontal slices. Labelled slices represent a hierarchy. Pyramids are used in marketing presentations to show and analyze hierarchy levels.
3D triangular diagram of DIKW pyramid has 6 levels: measurement, facts, data, information, knowledge, wisdom.
The data component include different scattered signs or symbols which are merely useless until these random objective facts are somehow processed. Data is a resource which has to be manipulated or rearranged to get useful. Information can be extracted from a pile of data, it also can be mined from different data storages.
Picture: Pyramid Diagram
Related Solutions:
ConceptDraw Wireless Networks solution contains a library with 81 vector stencils for drawing different types of wireless network diagrams.
Picture: Wireless Network Elements
Related Solution:
ConceptDraw DIAGRAM diagramming and vector drawing software is the best for drawing professional looking Computer Network Diagrams thanks to the network icons from the libraries of Computer Network Diagrams Solution from the Computer and Networks Area of ConceptDraw Solution Park.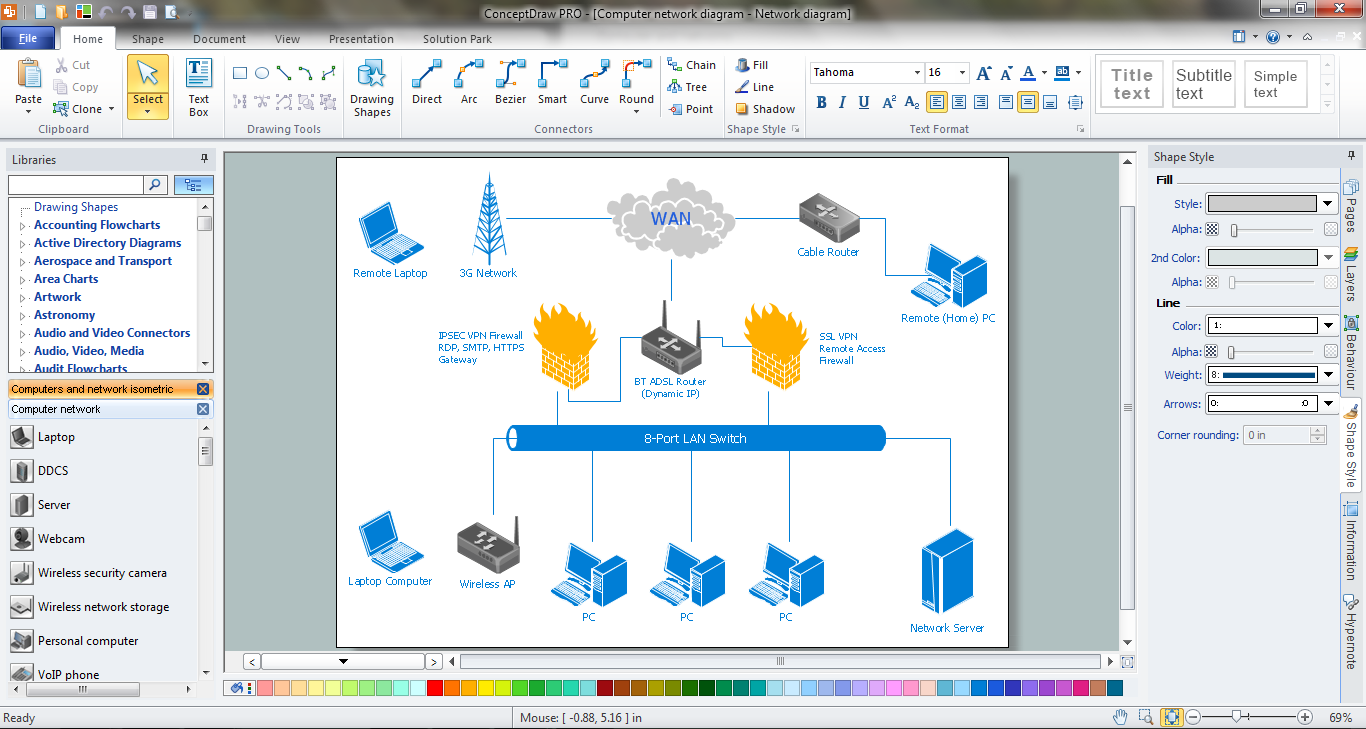
Picture: Network Icons
Related Solution:
ConceptDraw DIAGRAM diagramming and vector drawing software extended with Electrical Engineering Solution from the Industrial Engineering Area of ConceptDraw Solution Park affords you the easiest and fastest way for designing professional looking Electrical Schematics.
Picture: Electrical Schematics
Related Solution:
ConceptDraw
DIAGRAM 18