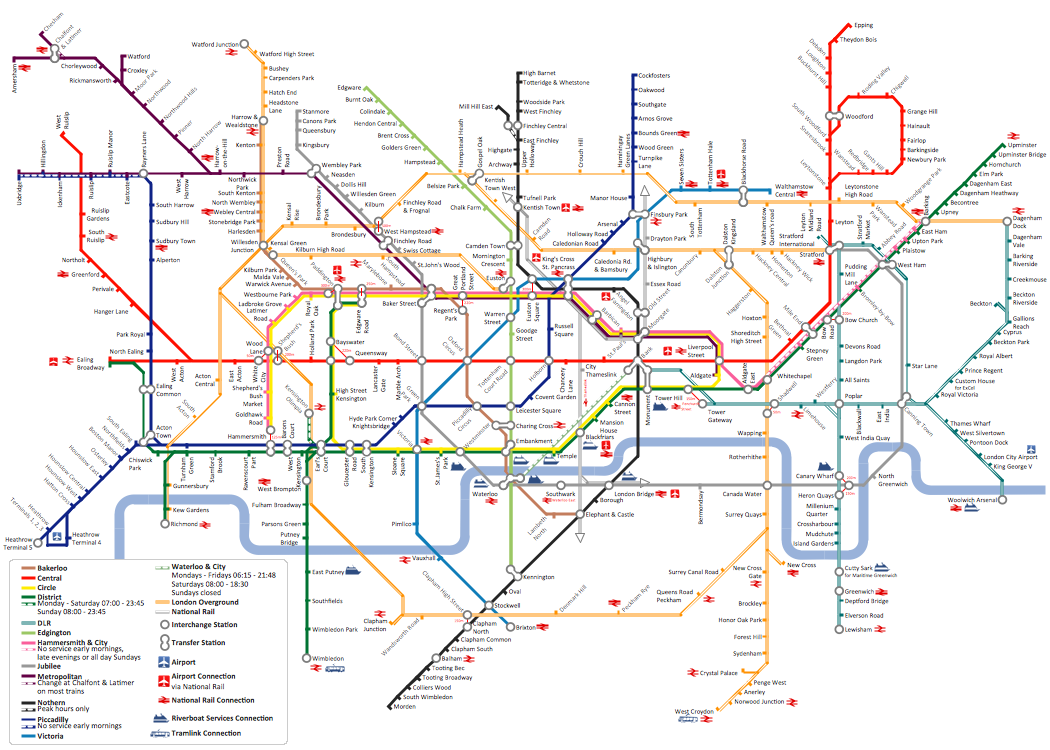
Example 2. Metro Map Example — Tube Map of London
The Metro Map solution provides a set of predesigned templates and samples that can be quickly modified according to your needs.

Example 3. Metro Map — Chronology of Social Networks
ConceptDraw DIAGRAM gives you the beautiful possibilities not just conveniently create your maps, but also make them bright and colorful. Creating the metro maps, route maps, transport schemes it is also useful to design the legend with additional explanatory information.

Example 4. Metro Map — New York City Subway Map
The samples you see on this page were created in ConceptDraw DIAGRAM using the Metro Map solution from the Maps Area of ConceptDraw Solution Park, and demonstrate the solution's capabilities and the results you can achieve using this solution.
All source documents are vector graphic documents. They are available for reviewing, modifying or converting to a variety of formats (PDF file, Power point Presentation, image or MS Visio) from ConceptDraw STORE, for all users who have installed Metro Map solutions.
FIVE RELATED HOW TO's:
There are numerous articles about the advantages of flowcharting, creating business graphics and developing different charts. Nevertheless, these articles are almost useless without the main component - the examples of flowcharts, org charts and without a fine example, it is difficult to get all the conveniences of creating diagrams. You can find tons of templates and vivid examples on Solution Park.
This illustration shows a variety of business diagrams that can be created using ConceptDraw DIAGRAM. It comprises a different fields of business activities: management, marketing, networking, software and database development along with design of infographics and business illustrations. ConceptDraw DIAGRAM provides a huge set of sample drawings including business process modeling diagrams,, network diagrams, UML diagrams, orgcharts, DFD, flowcharts, ERD, geographical maps and more.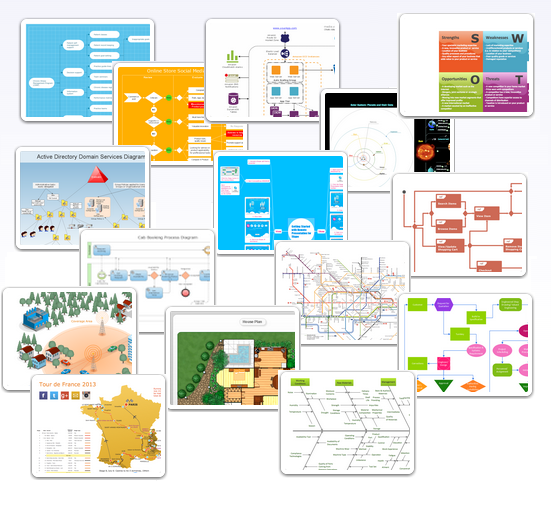
Picture: Examples of Flowcharts, Org Charts and More
Related Solution:
Follow samples and map templates to create nfographic maps. It's super-easy!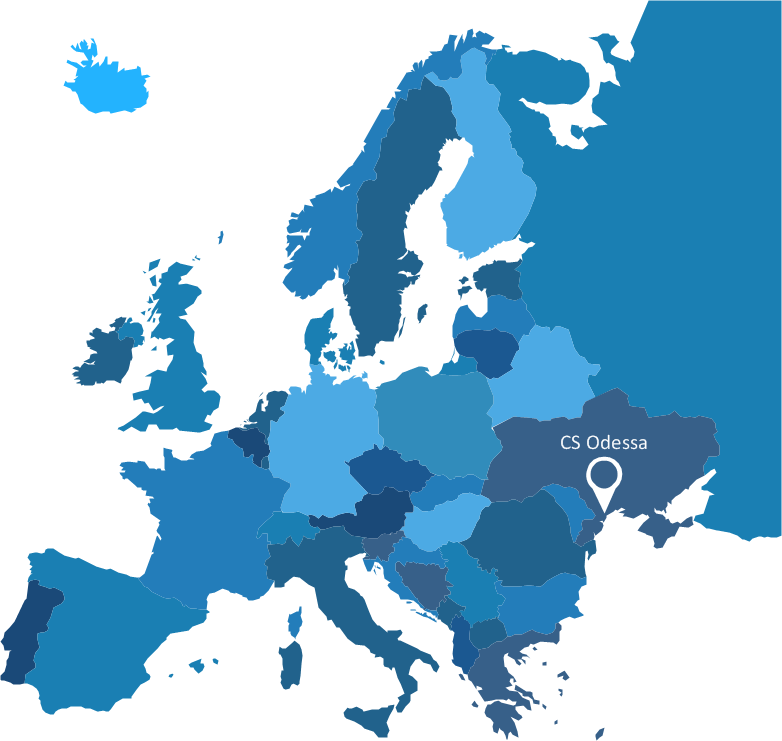
Picture: Map Infographic Creator
If you want to find a way to understand complex things in minutes, you should try to visualize data. One of the most useful tool for this is creating a flowchart, which is a diagram representing stages of some process in sequential order. There are so many possible uses of flowcharts and you can find tons of flow charts examples and predesigned templates on the Internet. Warehouse flowchart is often used for describing workflow and business process mapping. Using your imagination, you can simplify your job or daily routine with flowcharts.
Warehouse flowcharts are used to document product and information flow between sources of supply and consumers. The flowchart provides the staged guidance on how to manage each aspect of warehousing and describes such aspects as receiving of supplies; control of quality; shipment and storage and corresponding document flow. Warehouse flowchart, being actual is a good source of information. It indicates the stepwise way to complete the warehouse and inventory management process flow. Also it can be very useful for an inventory and audit procedures.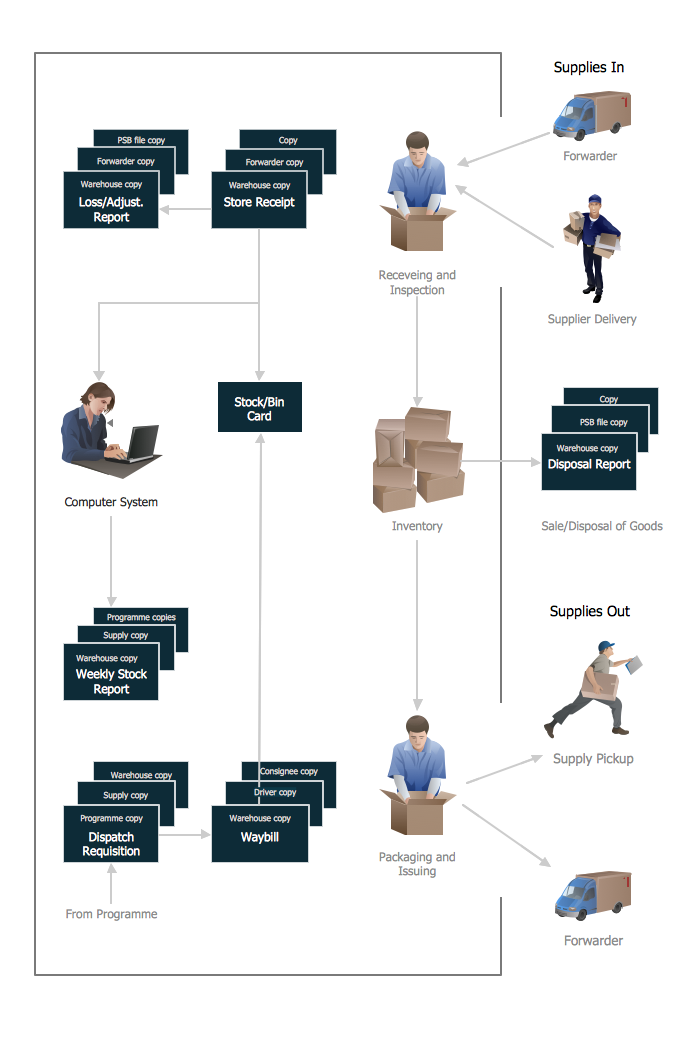
Picture: Flow Chart Example: Warehouse Flowchart
Related Solution:
Project timeline is a type of chart which allows visually represent the chronology of works for the project, placing the key points of the project (milestones) on a timescale.
You need to make professional looking project timeline? Create it with ConceptDraw DIAGRAM! ConceptDraw DIAGRAM extended with Timeline Diagrams Solution from the Management Area is the best timeline diagrams software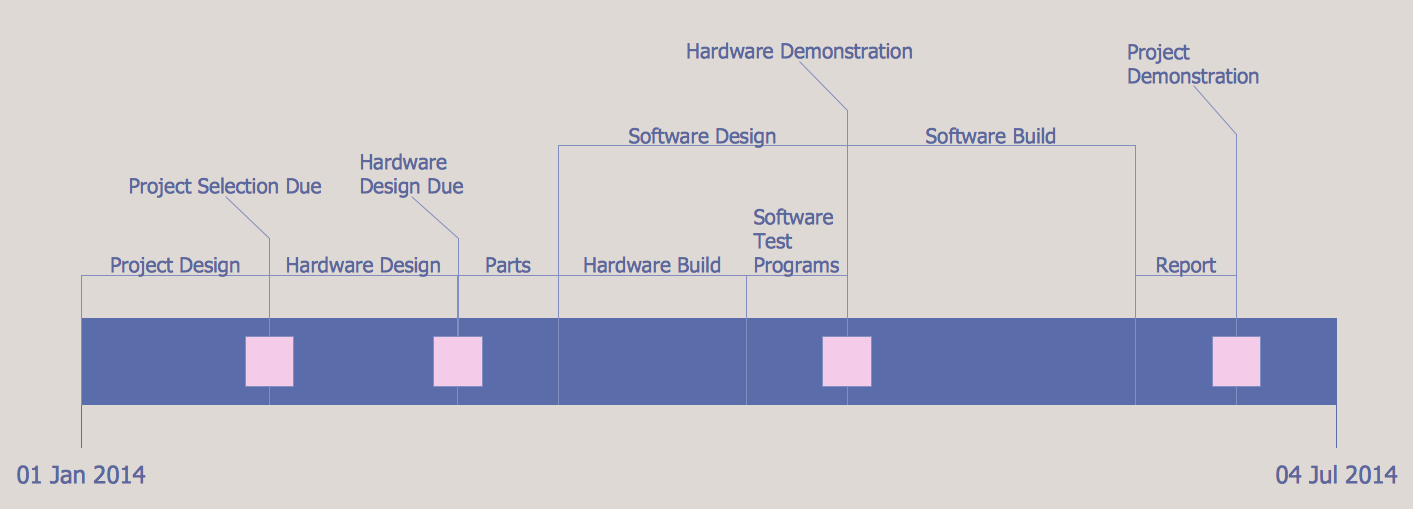
Picture: Project Timeline
Related Solution:
Effective spatial infographics design, easy geospatial data presenting, now it is reality thanks to the extensive drawing tools of the Spatial Infographics Solution included in “Infographics” Area of ConceptDraw Solution Park.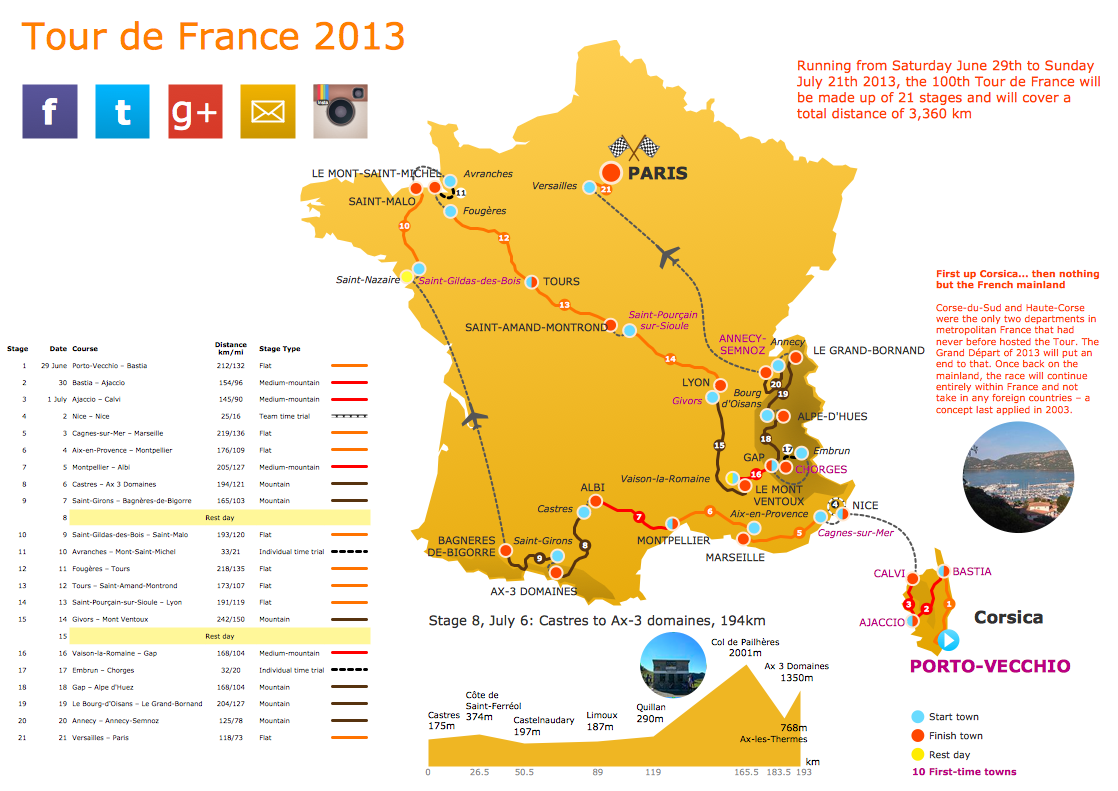
Picture: Geospatial Data
Related Solution:


