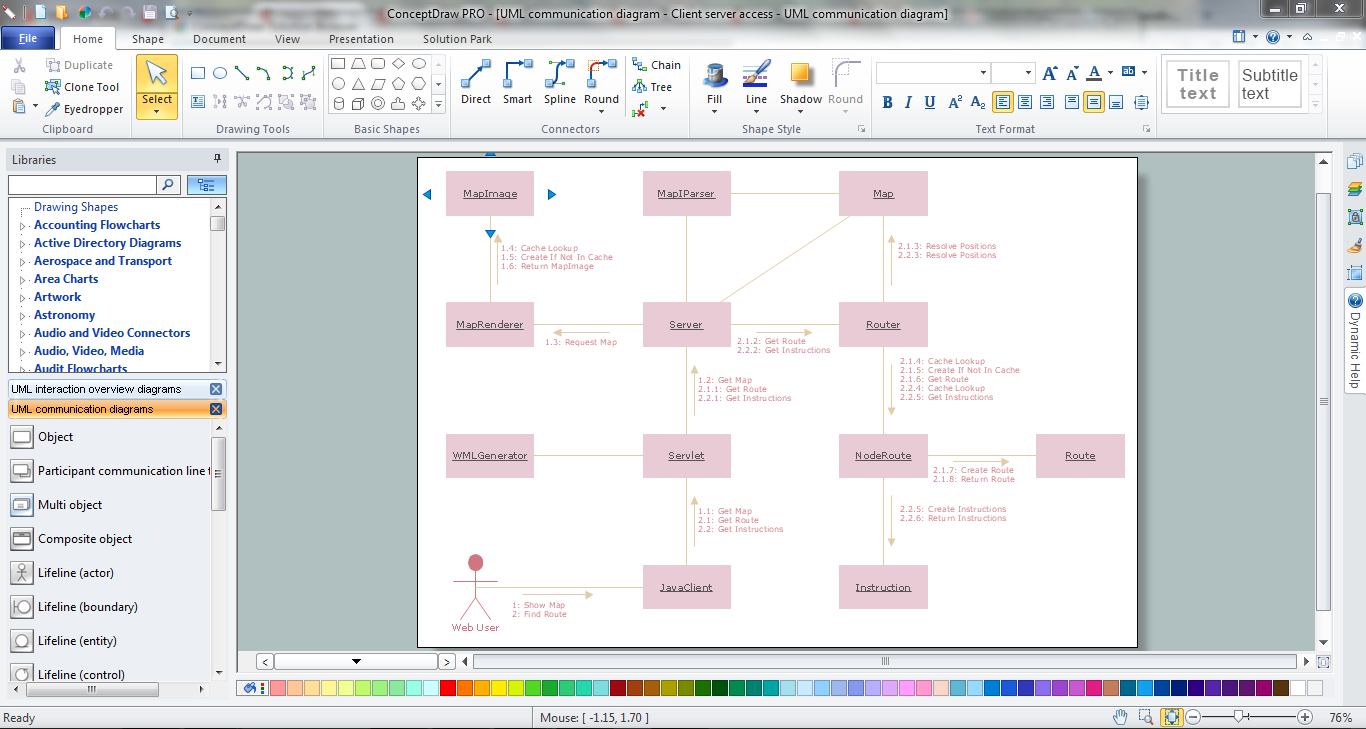
Example 1. Online Diagram Tool - ConceptDraw DIAGRAM /p>
Installed once on your computer, ConceptDraw DIAGRAM will be always at hand with useful drawing tools, templates and samples, numerous libraries of Rapid UML Solution for designing:

Example 2. Online Diagram Tool - ConceptDraw STORE
In addition to ConceptDraw DIAGRAM is offered one more useful online diagram tool - ConceptDraw STORE that lets you the possibility to navigate through solutions of ConceptDraw Solution Park, access libraries, templates and samples, and also manage downloads and updates.

Example 3. UML Use Case Diagram - Project Administrator
This example was created in ConceptDraw DIAGRAM using the vector objects from the UML Use Case library of Rapid UML Solution and shows the UML Use Case Diagram with actors, use cases and dependencies between them. An experienced user spent 10 minutes creating this sample using the online diagram tool.
Use the Rapid UML solution to create your own UML diagrams of any type quick, easy and effective.
All source documents are vector graphic documents. They are available for reviewing, modifying, or converting to a variety of formats (PDF file, MS PowerPoint, MS Visio, and many other graphic formats) from the ConceptDraw STORE. The Rapid UML Solution is available for all ConceptDraw DIAGRAM or later users.
NINE RELATED HOW TO's:
Fast visualization of structured data is main capability of the ConceptDraw DIAGRAM. With numerous vector stencils and standard flowchart symbols from object libraries and the RapidDraw technology this program stands as the best professional flowchart software for drawing with type of flowchart symbols. ConceptDraw DIAGRAM also known as best flowchart maker.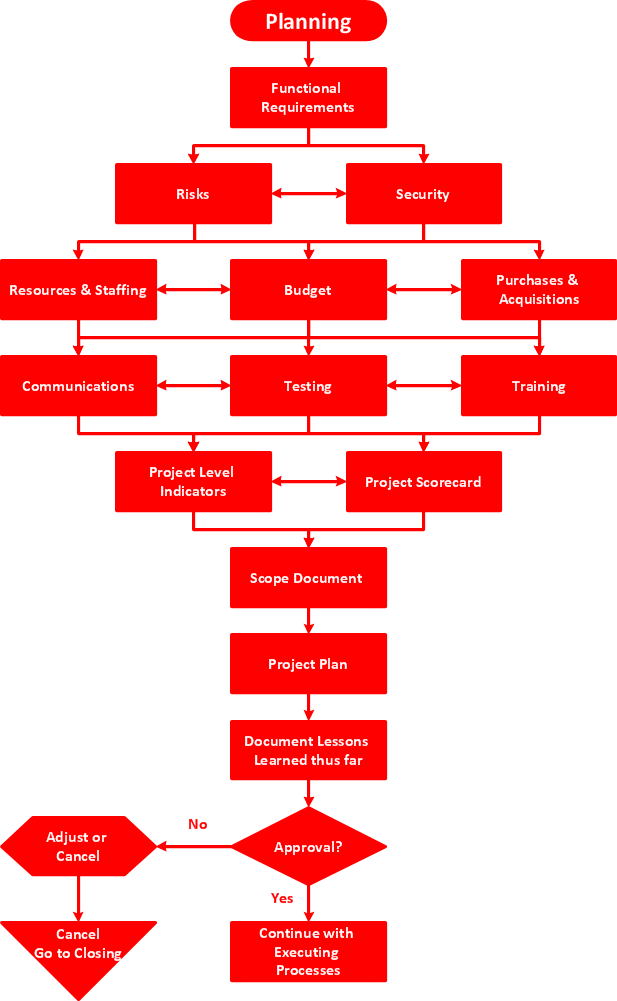
Picture: Easy Flowchart Program and Standard Flowchart Symbols
Related Solution:
Creating of Entity-Relationship Diagrams (ERDs) is a complex process that requires convenient, automated tools. ConceptDraw DIAGRAM diagramming and vector drawing software offers a powerful ER Diagram Tool - the Entity-Relationship Diagram (ERD) Solution from the Software Development Area.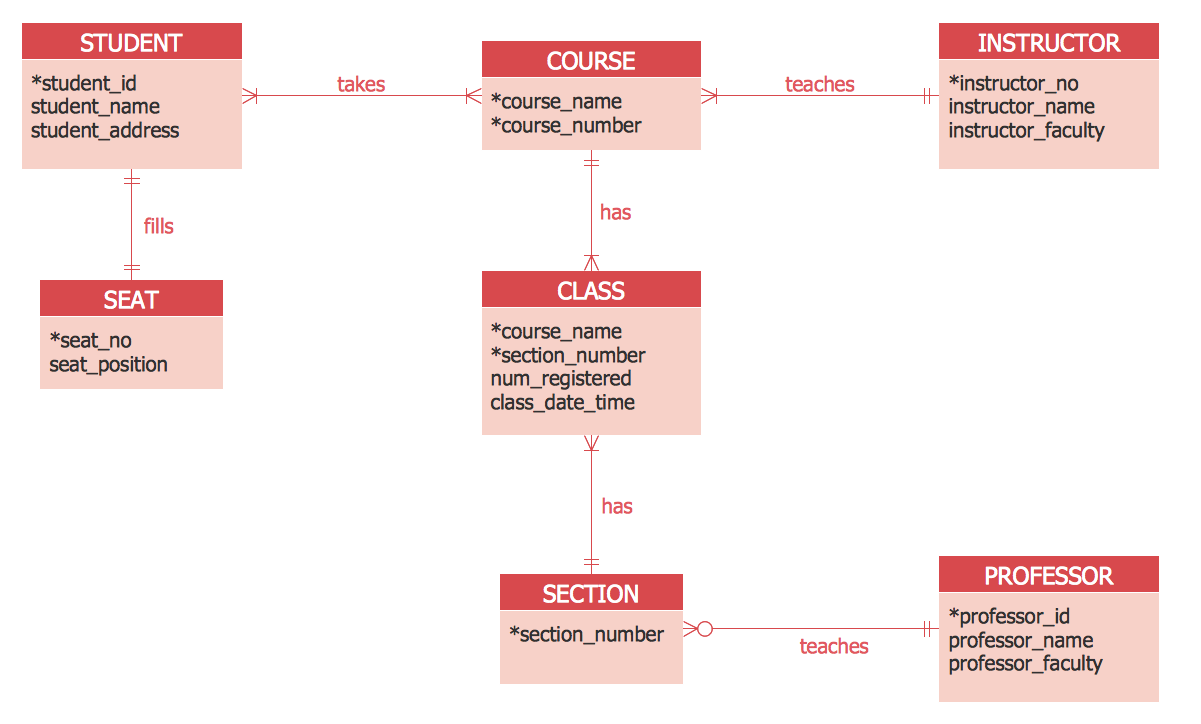
Picture: ER Diagram Tool
Related Solution:
Succeed in AWS architecture design, communication and collaboration with a team. 🔸 Create detailed and always up-to-date ✔️ AWS diagrams, ✔️ infrastructure based on AWS services, ✔️ auto-scalable architectures, ✔️ AWS-based applications
Picture: AWS icons 2.0
As restaurant industry is growing rapidly nowadays, researches show that almost half of the adults have worked in a restaurant or a cafe. Moreover, many of them dream to start their own someday. Unfortunately, it takes a lot of time to write a business plan and to find a great location, although some know how to create a restaurant floor plan in minutes or how to plan budget effortlessly. Hiring employees can also cause a lot of headache, but this is crucial for further success, because every guest comes to restaurant for a good service and delicious food. It is also worth noting that restaurant concept is also important, because it defines target audience and influences the menu.
This diagram represents the floor plan of an ongoing sports-theme establishment - restaurant, cafe, or other food service. A number of widescreen monitors installed along the perimeter provide visitors the opportunity to follow the course of a match from anywhere in the dining room of restaurant or cafe. The most of sports fans believe that food and alcohol is a big part of any sports show. That is why the dining room takes the most space - almost 60% of the total establishment space. Nearly all sports fans consume beverages while watching sports - beer, soda or water at least. Thus, the restaurant floor plan designers added a large lavatory there. Moreover, project developers considered unnecessary the gender division of such delicate place - perhaps they guess that only men are watching football, or believe that alcohol will eliminate the most of gender differences.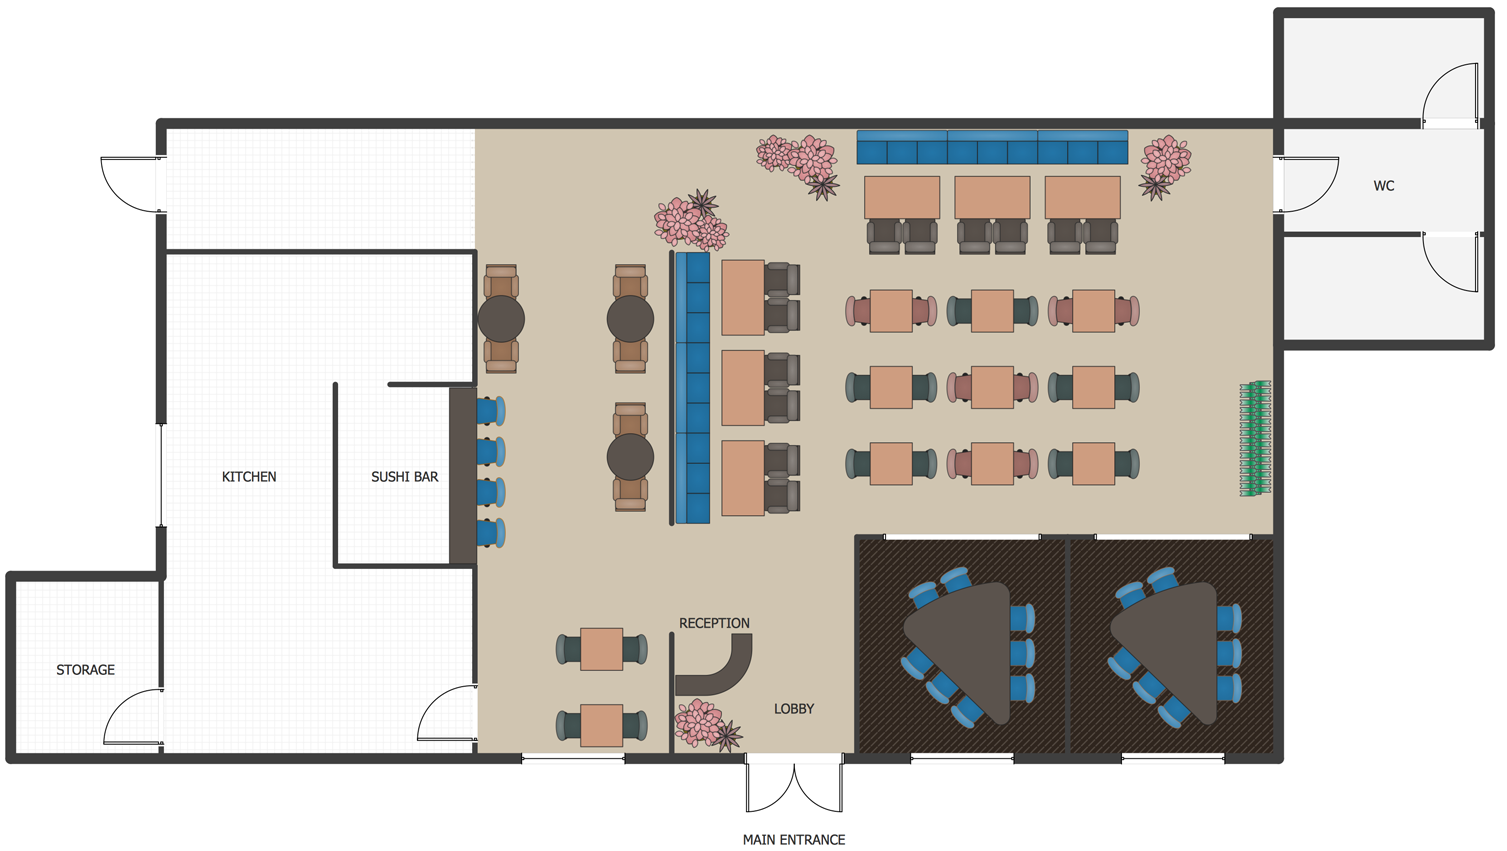
Picture: How To Create Restaurant Floor Plan in Minutes
Related Solution:
Unified Modeling Language (UML) is a visual modeling language in the field of software engineering. It is an open standard that provides the graphic notations for creating the visual models of object-oriented software systems. UML took in the notations of the Object-modeling technique, Object-oriented software engineering and the Booch method.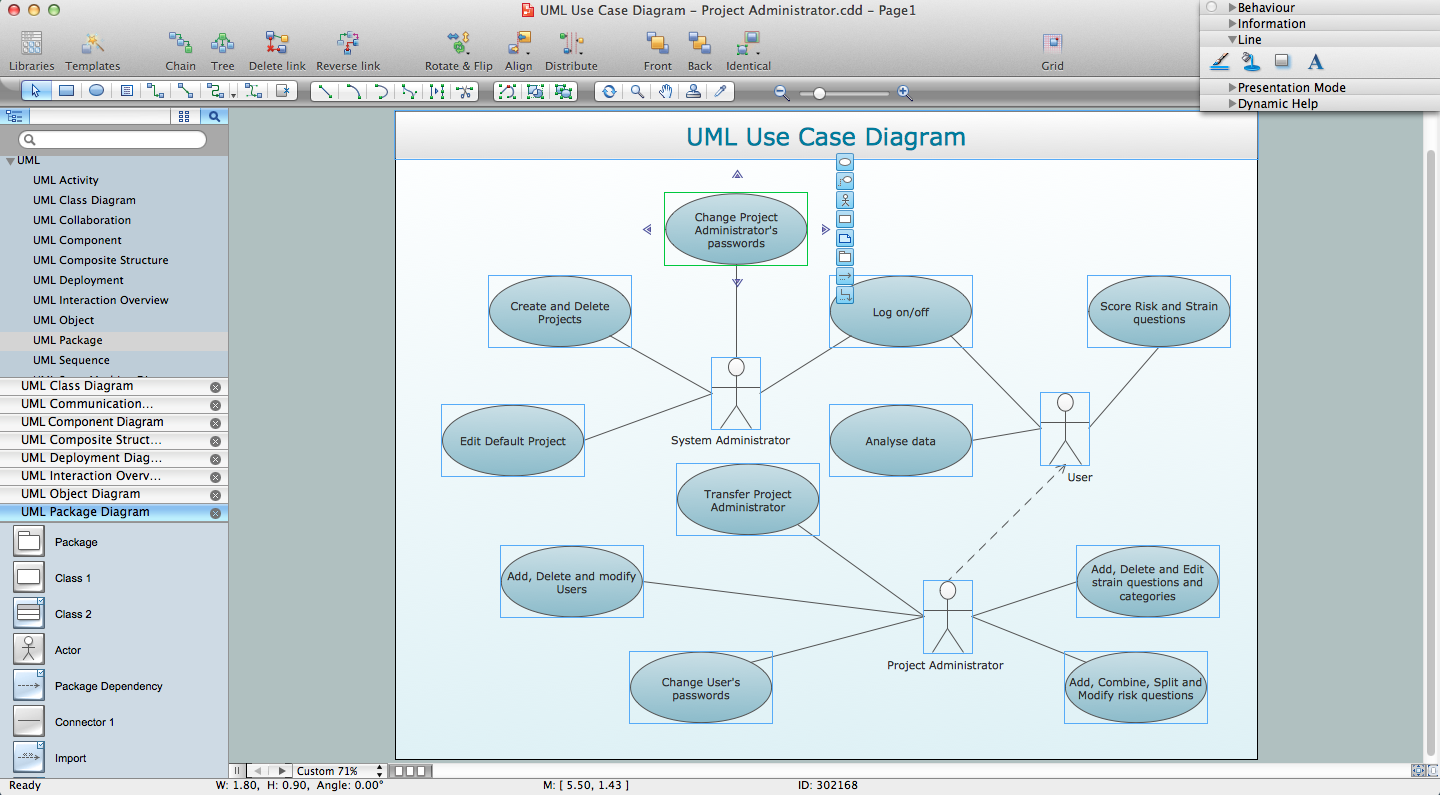
Picture: UML for Software Engineers
Related Solution:
The behavior of worker in organization is influences organizational effectiveness. A simple block diagram made with ConceptDraw Block diagrams solution can improve the understanding of expectations of workers regarding what they l contribute to organization and what they wait to obtain. Making block diagram depicting the individual behavior in organization is used in HR management to obtain an optimal and positive overall contribution to the organization.
The behavior of worker in organization is influences organizational effectiveness. A simple block diagram made with ConceptDraw Block diagrams solution can improve the understanding of expectations of workers regarding what they l contribute to organization and what they wait to obtain. Making block diagram depicting the individual behavior in organization is used in HR management to obtain an optimal and positive overall contribution to the organization.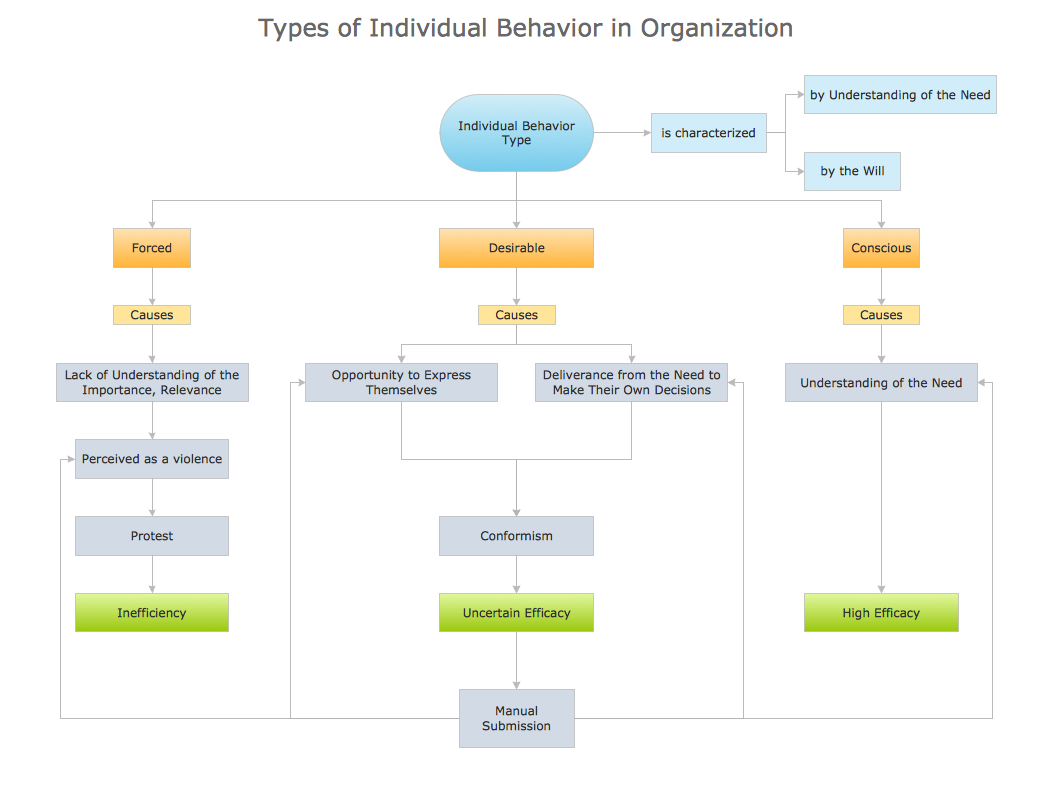
Picture: Basic Diagramming
Related Solution:
This sample was created in ConceptDraw DIAGRAM diagramming and vector drawing software using the Business Process Diagram Solution from the Business Processes area of ConceptDraw Solution Park. The Business Process Solution is based on the standard BPMN 2.0 and includes the set of libraries of ready-to-use objects.
Picture: BPR Diagram. Business Process Reengineering Example
Related Solution:
While developing software, it is very important to have a visual model, because it helps to represent the logic and the architecture of an application. Experienced engineers use UML diagrams to denote relationships between classes and their instances. UML is a general language for a set of diagrams like deployment diagrams, object diagrams or use case diagrams.
This diagram represents UML class diagram used for a software system development using an object-oriented method. Class diagrams are categorized as static structure diagrams that depict the physical structure of a system. Class diagram divides a software system's structure into "classes". Classes are defined by the methods and variables of objects. UML Class diagram is used to depict relationships and source code dependencies between objects.
Picture: UML Diagram
Related Solution:
There are many ways to define the flow of information within a system. Structured-systems analysis method often uses data flow diagrams to show data flow, data storages and data processing visualization. These diagrams are easy to develop and quite useful.
Here is a dataflow diagram presenting an example of the manufacturing process flow. The oval process shapes represent a process that controls data within the current system. The process may produce data or make some action based on data. Data flows are represented by lines. They show the movement of information through the system. The direction of the data flow is depicted by the arrow. The external entities are shown by rectangles. They represent the external entities interacting with the system. The data store objects (unclosed rectangles) are used to show data bases participating in a process flow.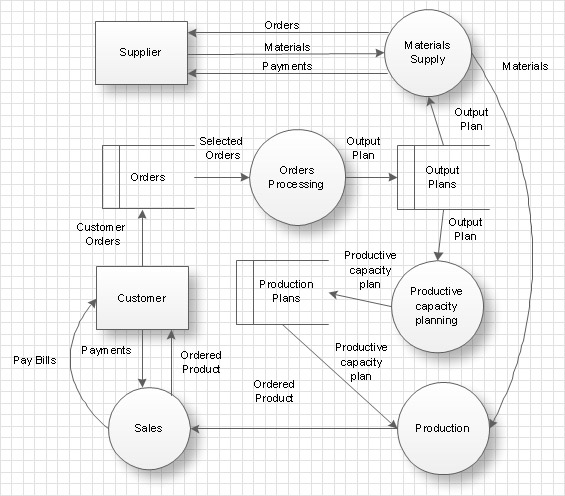
Picture: Data Flow Diagram
Related Solution:

