
Sample 1. ConceptDraw DIAGRAM - Organizational Structure Diagram Software
Organizational Charts Solution provides a wide variety of templates and samples and large quantity of predesigned vector objects to help you design your Organizational Structure Diagrams and other business diagrams.

Sample 2. Organizational Chart Library from Organizational Charts Solution
You can also use various vector clipart from other libraries of ConceptDraw Solution Park, fonts and colors from the ConceptDraw color palette to make your diagrams more visual, bright, attractive and successful.

Sample 3. Organizational structure - Foodbank
Look on these samples - how beautiful and attractive they are. They will have a great success on presentations, conferences, and so on.

Sample 4. Organizational structure diagram - United States Department of Labor
The Organizational Structure Diagrams you see on this page were created in ConceptDraw DIAGRAM using the Organizational Chart Library from Organizational Charts Solution. An experienced user spent 10-15 minutes creating each of these samples. These samples are available from ConceptDraw STORE.
Use the Organizational Charts Solution for ConceptDraw DIAGRAM to create your own Organizational Structure Diagrams of any complexity quick, easy and effective.
The Organizational Structure Diagrams designed with ConceptDraw DIAGRAM are vector graphic documents and are available for reviewing, modifying, converting to a variety of formats (image, HTML, PDF file, MS PowerPoint Presentation, Adobe Flash or MS Visio), printing and send via e-mail in one moment.
TEN RELATED HOW TO's:
ConceptDraw MINDMAP has impressive import and export capabilities includes following formats:
OPML
Mindjet™ MindManager™
Microsoft™ Office products:
PowerPoint™
Project™
Word™
FreeMind (import only)
XMind (import only)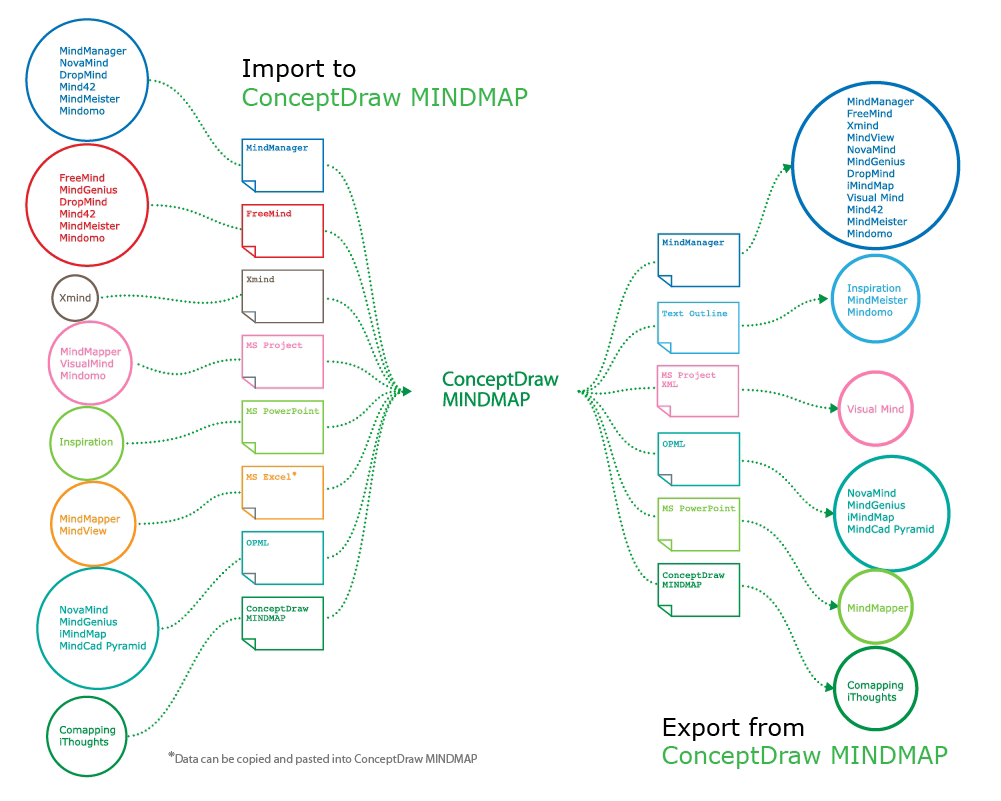
Picture: How to Exchange ConceptDraw MINDMAP Files with Mindjet MindManager
Related Solution:
Want to create Diagrams for Amazon Web Services architecture? ConceptDraw Solution Park with AWS architecture Solution will help you!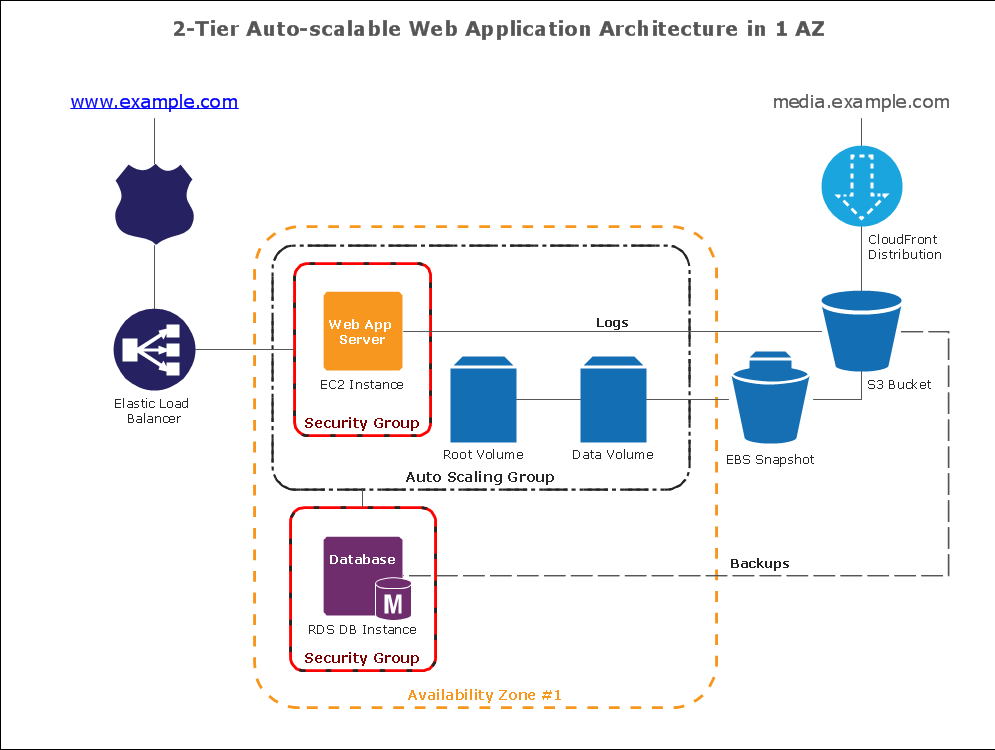
Picture: How To create Diagrams for Amazon Web Services architecture
Automatically create a presentation-quality diagram in one click with ConceptDraw DIAGRAM.
Picture: Visual Presentations Made Easy with Diagramming Software
Related Solution:
Start your business process mapping with conceptDraw DIAGRAM and its Arrows10 Technology. Creating a process map, also called a flowchart, is a major component of Six Sigma process management and improvement. Use Cross-Functional Flowchart drawing software for business process mapping (BPM).
Use a variety of drawing tools, smart connectors and shape libraries to create flowcharts of complex processes, procedures and information exchange. Define and document basic work and data flows, financial, production and quality management processes to increase efficiency of you business.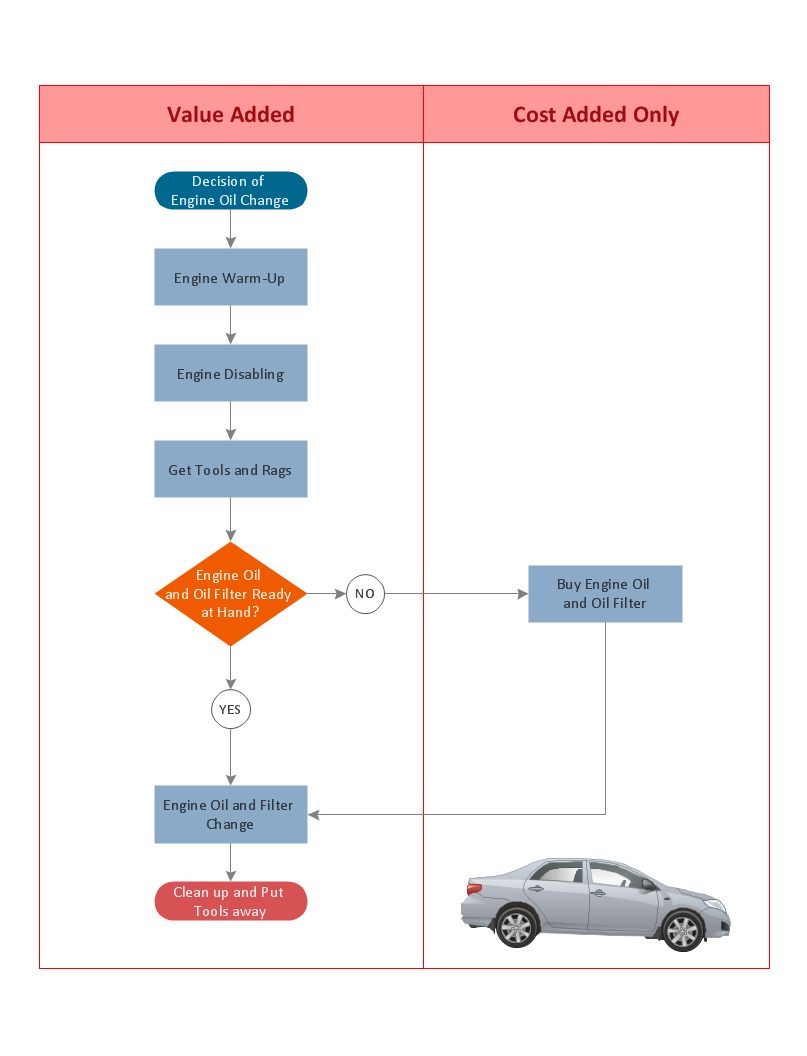
Picture: Cross Functional Flowchart for Business Process Mapping
ConceptDraw Flowcharts visualize a process or algorithm of program as step/operation blocks of various shapes connected with arrowed lines showed the process flow direction. They are used to visualize business or technical processes and software algorithms.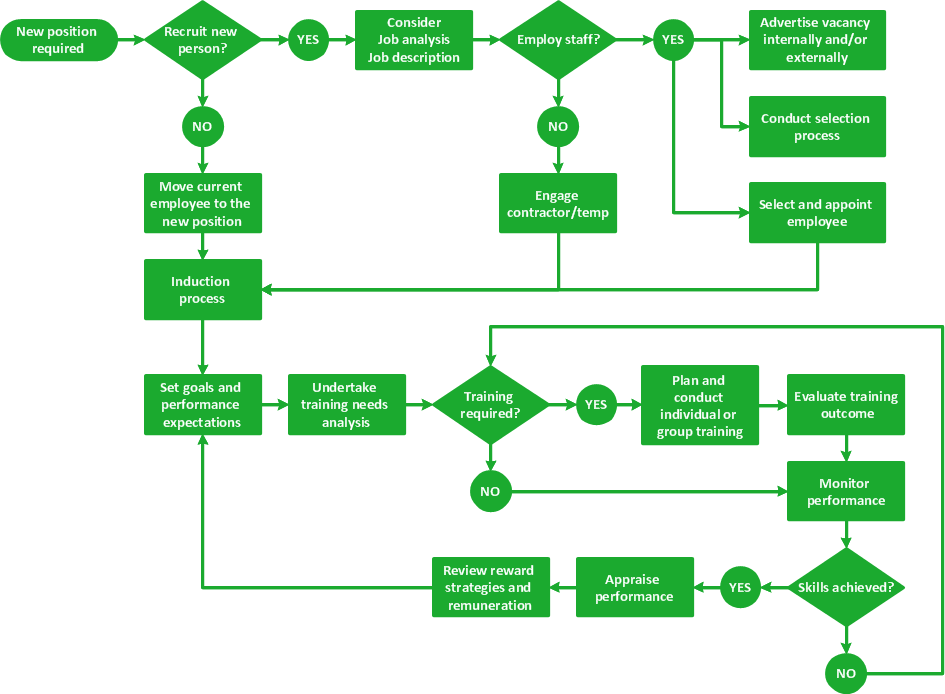
Picture: Selecting & Creating Flowcharts
Related Solution:
Example of Organizational Chart - Lots of organization chart examples created by ConceptDraw Organizational Chart Software. Include company organizational chart, hospital organizational chart, hotel Organizational chart, corporate organizational chart samples etc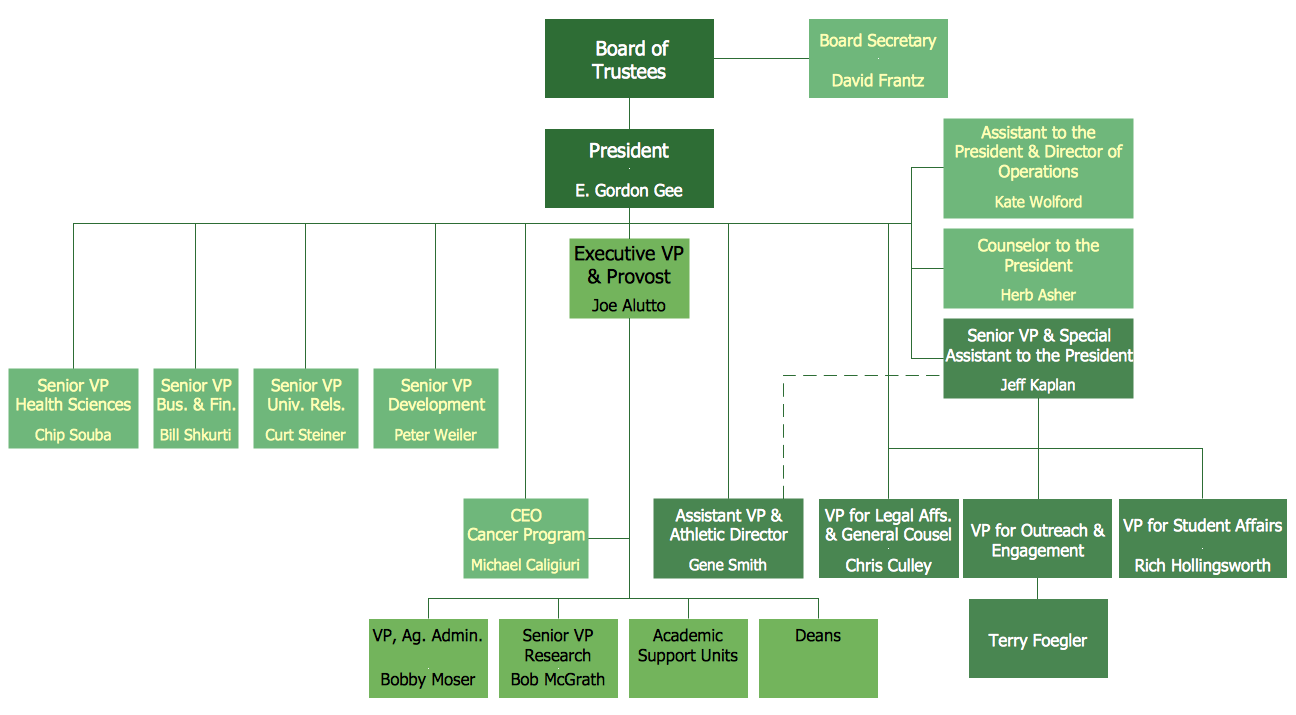
Picture: Example of Organizational Chart
Related Solution:
Flow chart is a diagrammatic representation of an algorithm and essential part of planning the system. Flow charts are widely used in technical analysis and programming for easy writing programs and explaining them to others. So, one of the most popular type of flow charts is Technical Flow Chart.
Technical Flow Chart can be drawn by pencil on the paper, but it will be easier to use for designing a special software. ConceptDraw DIAGRAM diagramming and vector drawing software extended with Flowcharts Solution from the Diagrams Area of ConceptDraw Solution Park will be useful for this goal.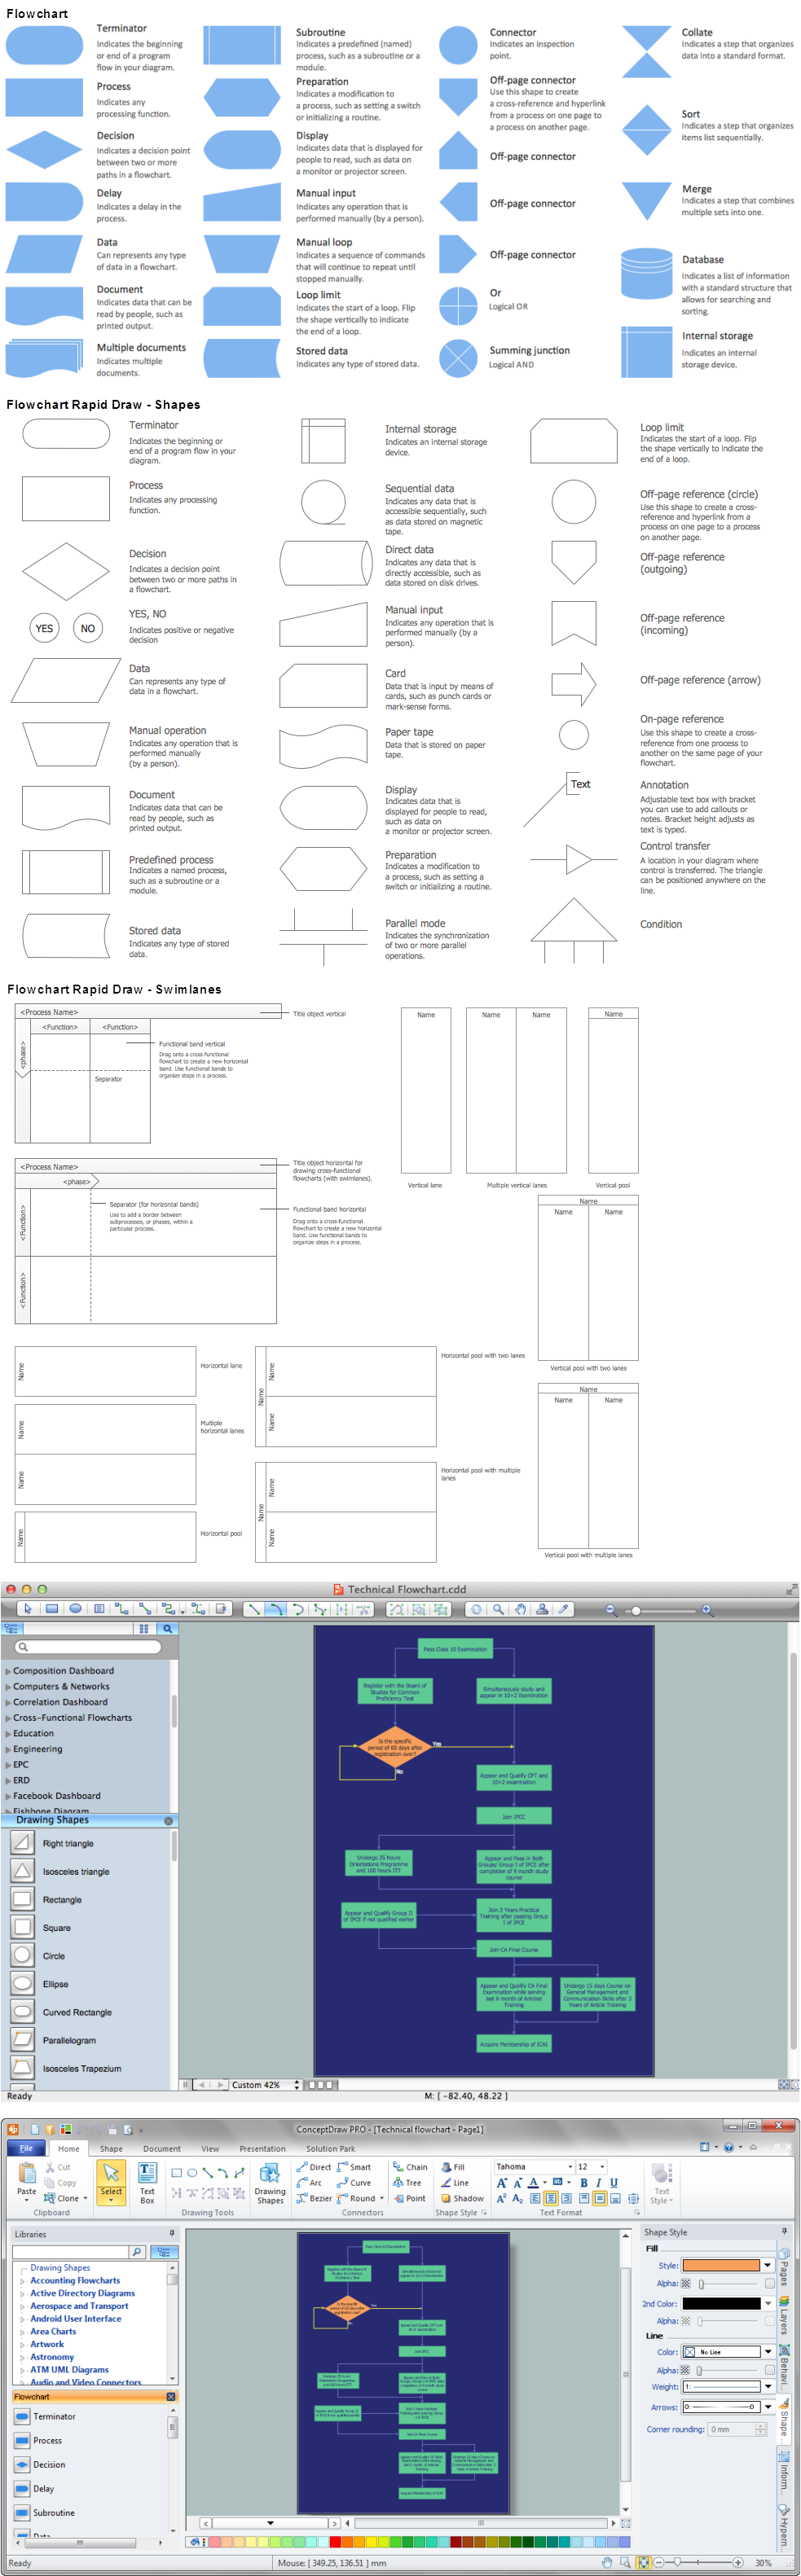
Picture: Technical Flow Chart
Related Solution:
Learn how to use ConceptDraw MINDMAP to create a simple presentation.
Picture: Create a Basic Presentation Quickly
Related Solution:
UML Composite Structure Diagram shows the internal structure of a class and the possible interactions at this structure.
ConceptDraw has 393 vector stencils in the 13 libraries that helps you to start using software for designing your own UML Diagrams. You can use the appropriate stencils of UML notation from UML Composite Structure library.
Picture: UML Composite Structure Diagram. Design Elements
Related Solution:
You can describe your own quality processes, brainstorm, and structure quality issues; then you can easily and quickly present it to your team.
Quality Management Mind Maps - Presentations, Meeting Agendas, Problem will be solved.
Picture: Why do you need the quality management for the organization
Related Solution:

