
Sample 1. Physics diagrams – Free Body Diagram
Physics Solution provides 3 libraries of nuclear physics, mechanics and optics vector symbols and clipart:
- Mechanics Library
- Nuclear Physics Library
- Optics Library
that will help you create your physics diagrams in few minutes.

Sample 2. Physics diagrams – The Eightfold Way
Physics solution offers also the whole collection of predesigned templates and samples of various physics diagrams that you can find in our ConceptDraw STORE. All samples and templates are available for changing and further successful using.

Sample 3. Physics diagrams – Ray Tracing Diagram for Concave Lens
The samples you see on this page were created in ConceptDraw DIAGRAM using the physics symbols and clipart from the Physics Solution for ConceptDraw DIAGRAM These samples demonstrate solution's capabilities and professional results you can achieve. An experienced user spent 5 minutes creating every of these samples.
Use the Physics Solution for ConceptDraw DIAGRAM software to create your own professional looking physics diagrams and illustrations of any complexity quick, easy and effective.
All source documents are vector graphic documents. They are available for reviewing, modifying, or converting to a variety of formats (PDF file, MS PowerPoint, MS Visio, and many other graphic formats) from the ConceptDraw STORE. The Physics Solution is available for all ConceptDraw DIAGRAM or later users.
TEN RELATED HOW TO's:
Also included are standardized hr flowchart symbols, meaning your diagrams will be relevant and understood by all business associates.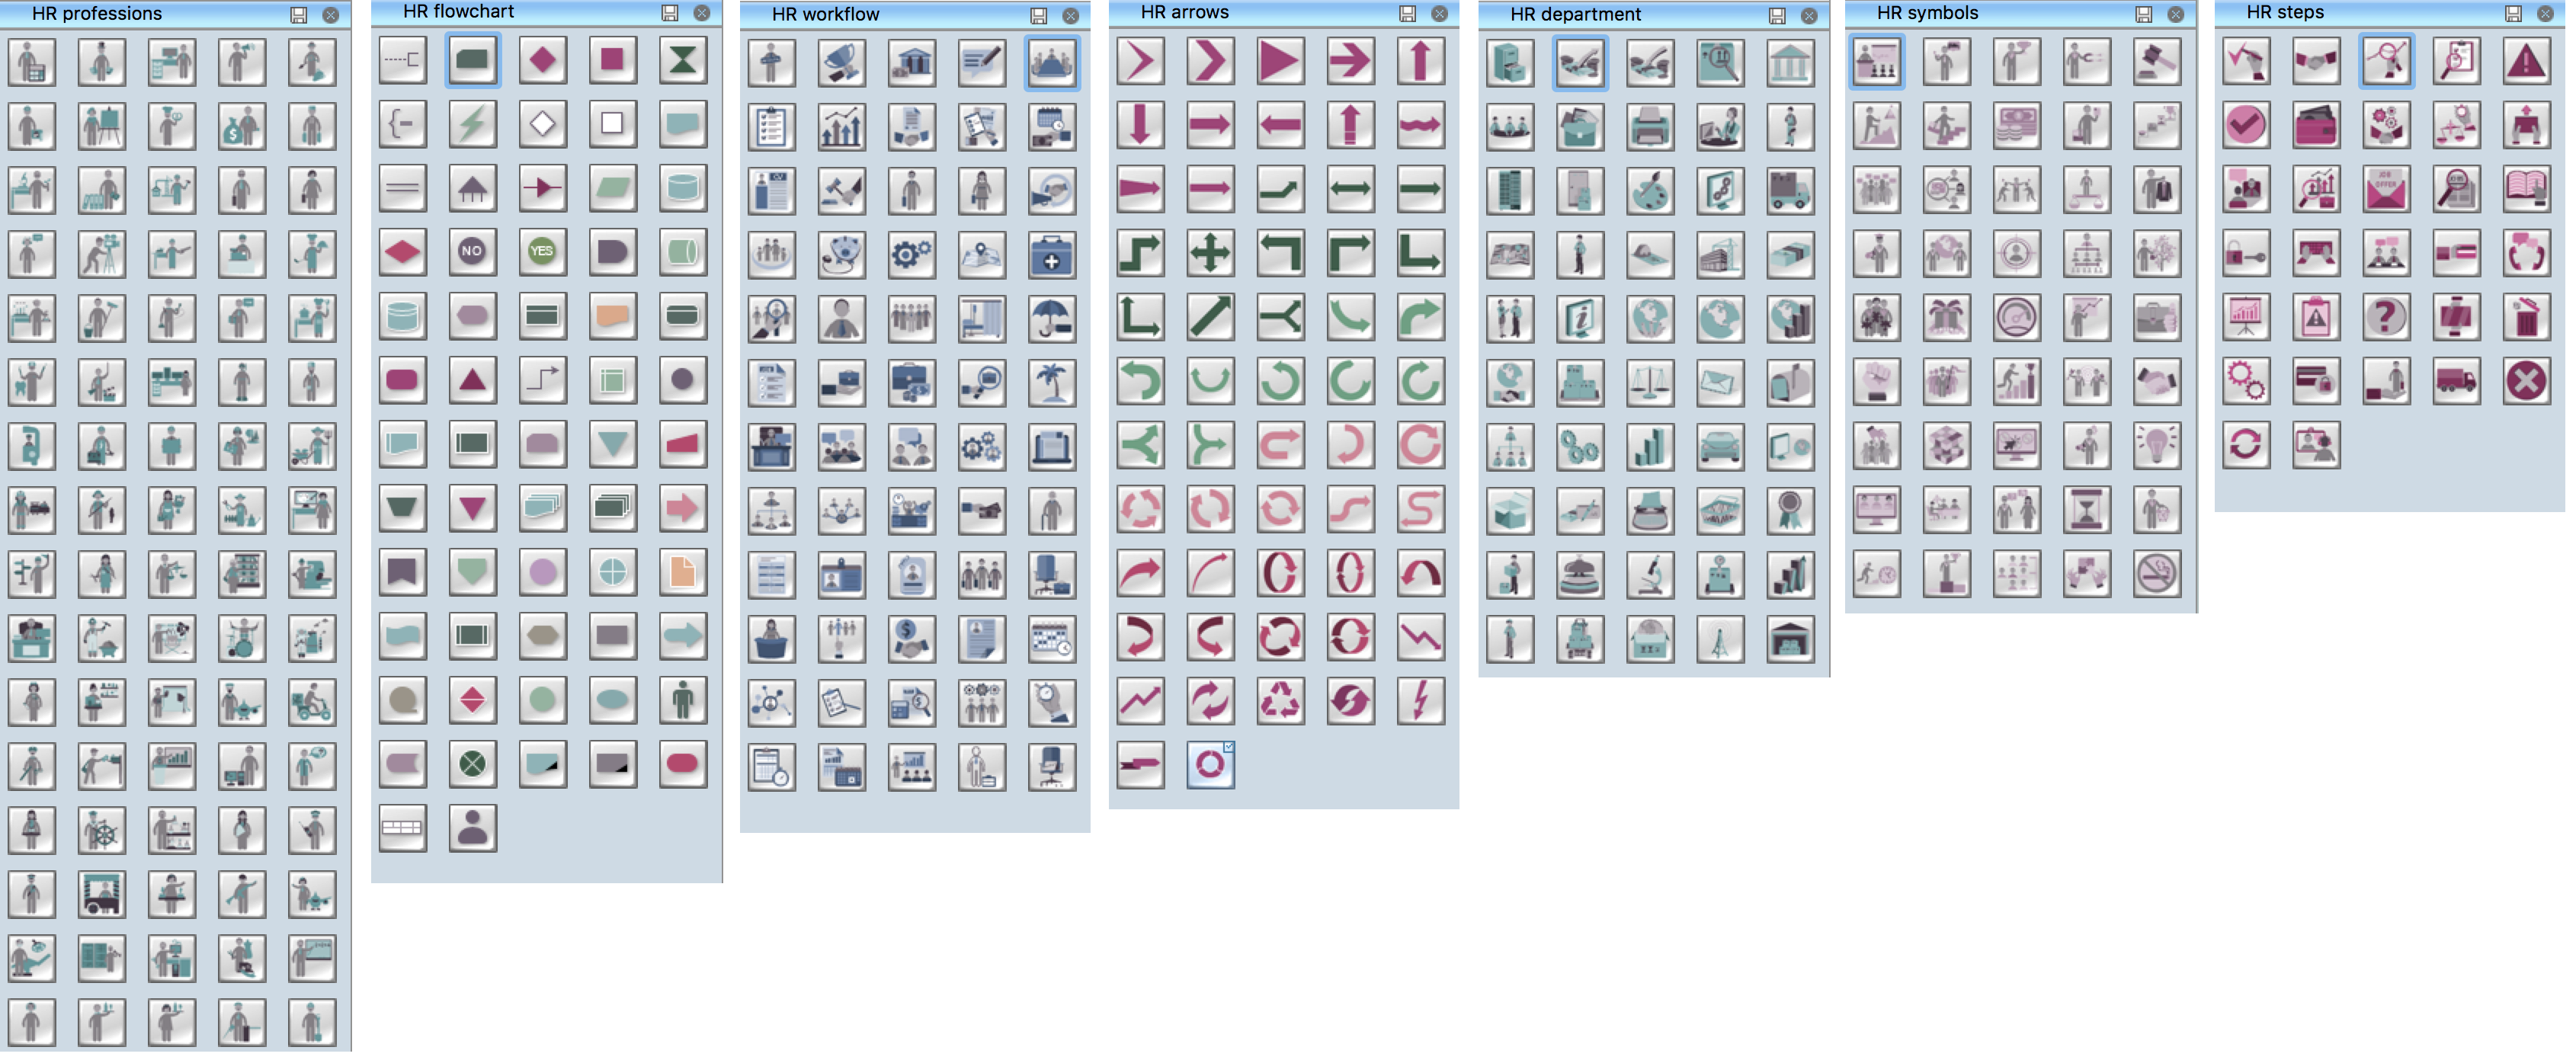
Picture: HR Flowchart Symbols
Related Solution:
Drawing the diagrams we try to find in help the powerful software and now we have the ConceptDraw DIAGRAM. The ability easily create the SDL diagrams is made possible thanks to unique Specification and Description Language (SDL) Solution from the Industrial Engineering Area of ConceptDraw Solution Park. This solution extends ConceptDraw DIAGRAM 2 libraries - SDL Connectors and SDL Diagrams that contain 70 predesigned SDL flowchart symbols.
Picture: SDL Flowchart Symbols
Related Solution:
You want design the Cross Functional Diagram and need powerful software? Then ConceptDraw DIAGRAM diagramming and vector drawing software extended with Cross-Functional Flowcharts Solution is exactly what you need.
Picture: Cross Functional Diagram
Related Solution:
A flowchart is a powerful tool for examining processes. It helps improving processes a lot, as it becomes much easier to communicate between involved people, to identify potential problems and to optimize workflow. There are flowcharts of different shapes, sizes and types of flowchart vary from quite basic process flowcharts to complex program flowcharts. Nevertheless, all these diagrams use the same set of special symbols like arrows to connect blocks, parallelogram to show data receiving or rectangles for showing process steps.
Basic flowcharts are used to represent a simple process algorithm. A basic flowchart notation consists of rectangles (business processes), arrows (the flow of information, documents, etc.). The same notation is used in items such as the "decision", which allow you to do the branching. To indicate the start of the entire business process and its termination can be used the "Terminator" element. The advantages of Basic Flowchart are simplicity and clarity. With it you can quickly describe the business process steps. Creating of Basic Flowchart does not require any special knowledge, as easily understand by employees with different levels of education and IQ.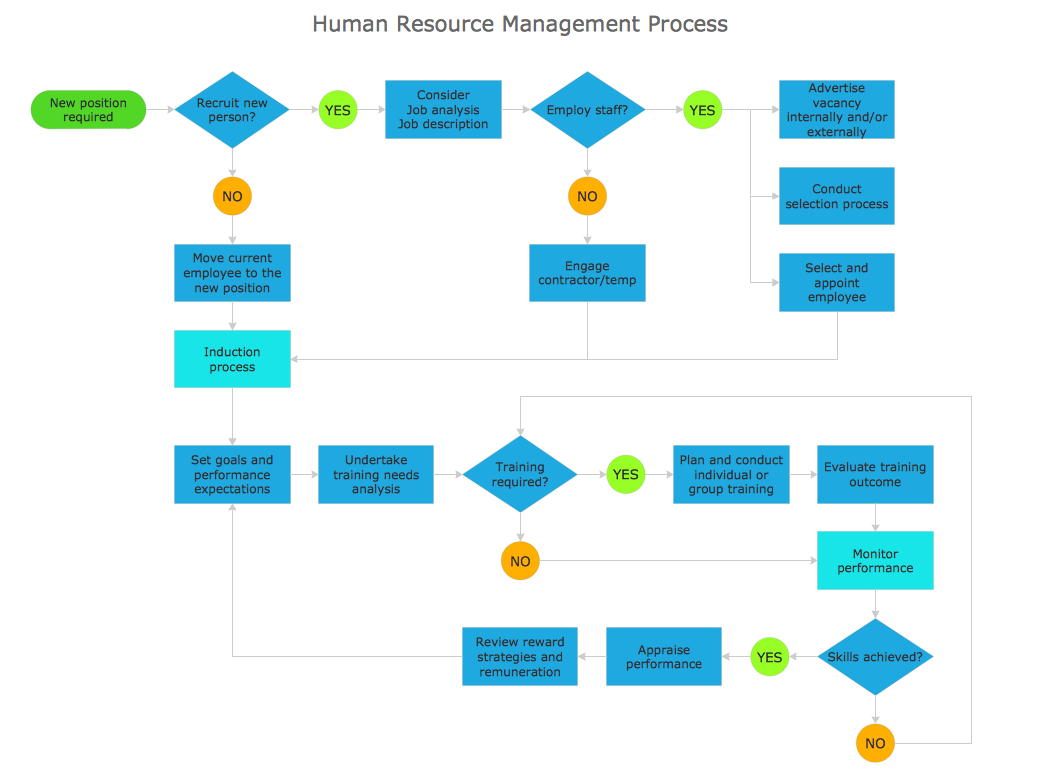
Picture: Types of Flowchart: Comprehensive Overview
Related Solution:
You need design the Functional Block Diagram and dream to find the useful tools to draw it easier, quickly and effectively? ConceptDraw DIAGRAM offers the Block Diagrams Solution from the Diagrams Area which will help you!
Picture: Functional Block Diagram
Related Solution:
ConceptDraw DIAGRAM diagramming and vector drawing software extended with Biology solution from the Science and Education area offers a set of useful tools for fast and easy drawing of various biology illustrations and drawings.
Biology solution provides 3 libraries with large quantity of vector biology symbols: Biochemistry of Metabolism Library, Carbohydrate Metabolism Library, Citric Acid Cycle (TCA Cycle) Library.
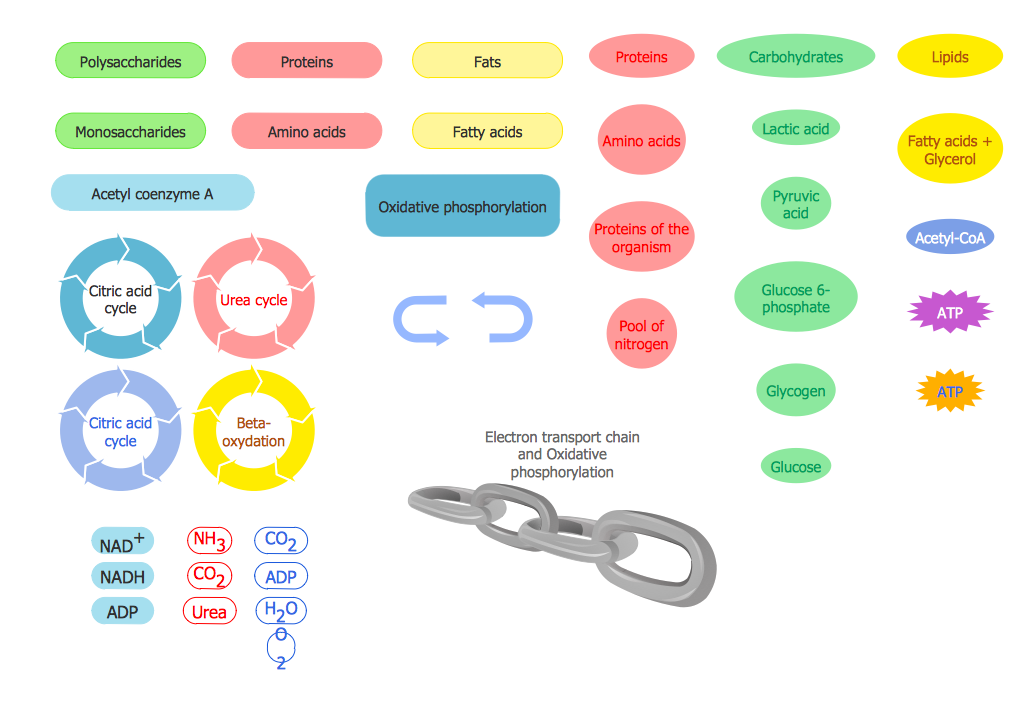
Picture: Biology Symbols
Related Solution:
You need design Cylinder Venn Diagram? Nothing could be easier with ConceptDraw DIAGRAM software.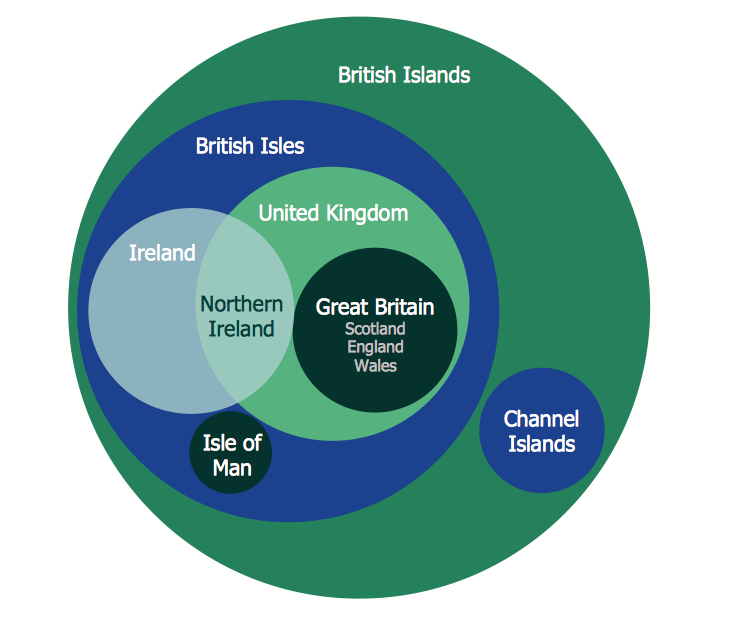
Picture: Cylinder Venn Diagram
Related Solution:
Flowcharts can be used in designing and documenting both simple and complex processes or programs and, similar to the other types of diagrams, they can help visualize what happens and so help understand some definite process, and, as a result, find flaws, bottlenecks and other features within it.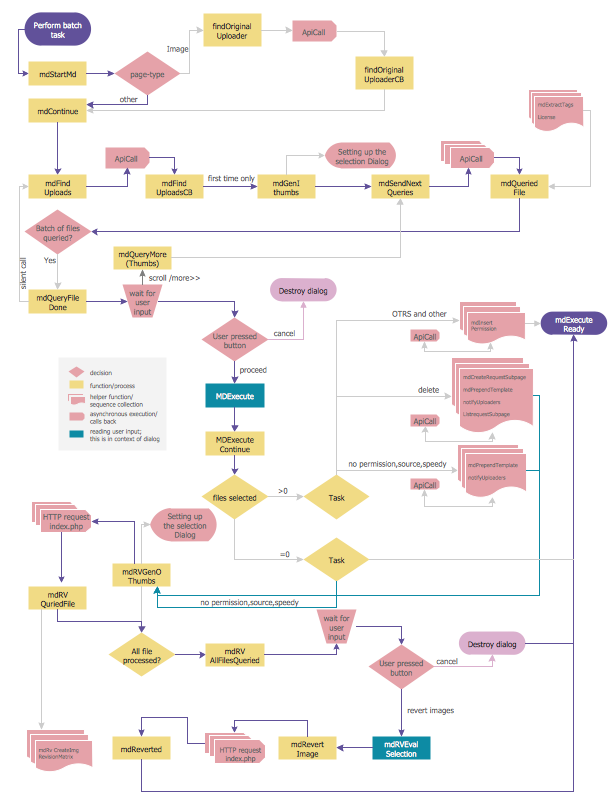
Picture: Flowchart Programming Project. Flowchart Examples
Related Solution:
ConceptDraw PROJECT delivers a rich set of built-in functionalities and optional product extensions that support your daily workflow in time-saving and creative ways. This video lesson will teach you how to work with costs in your project document.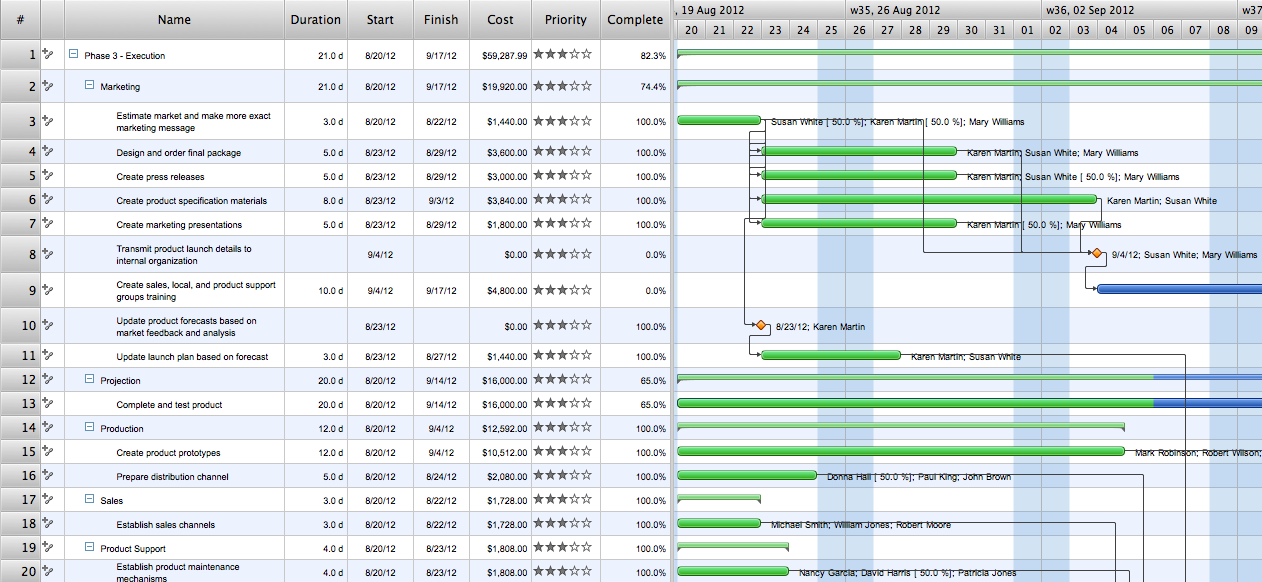
Picture: Project — Working With Costs
ConceptDraw DIAGRAM software extended with unique HR Flowcharts Solution is the best for designing various flowcharts and diagrams in the field of human resources management.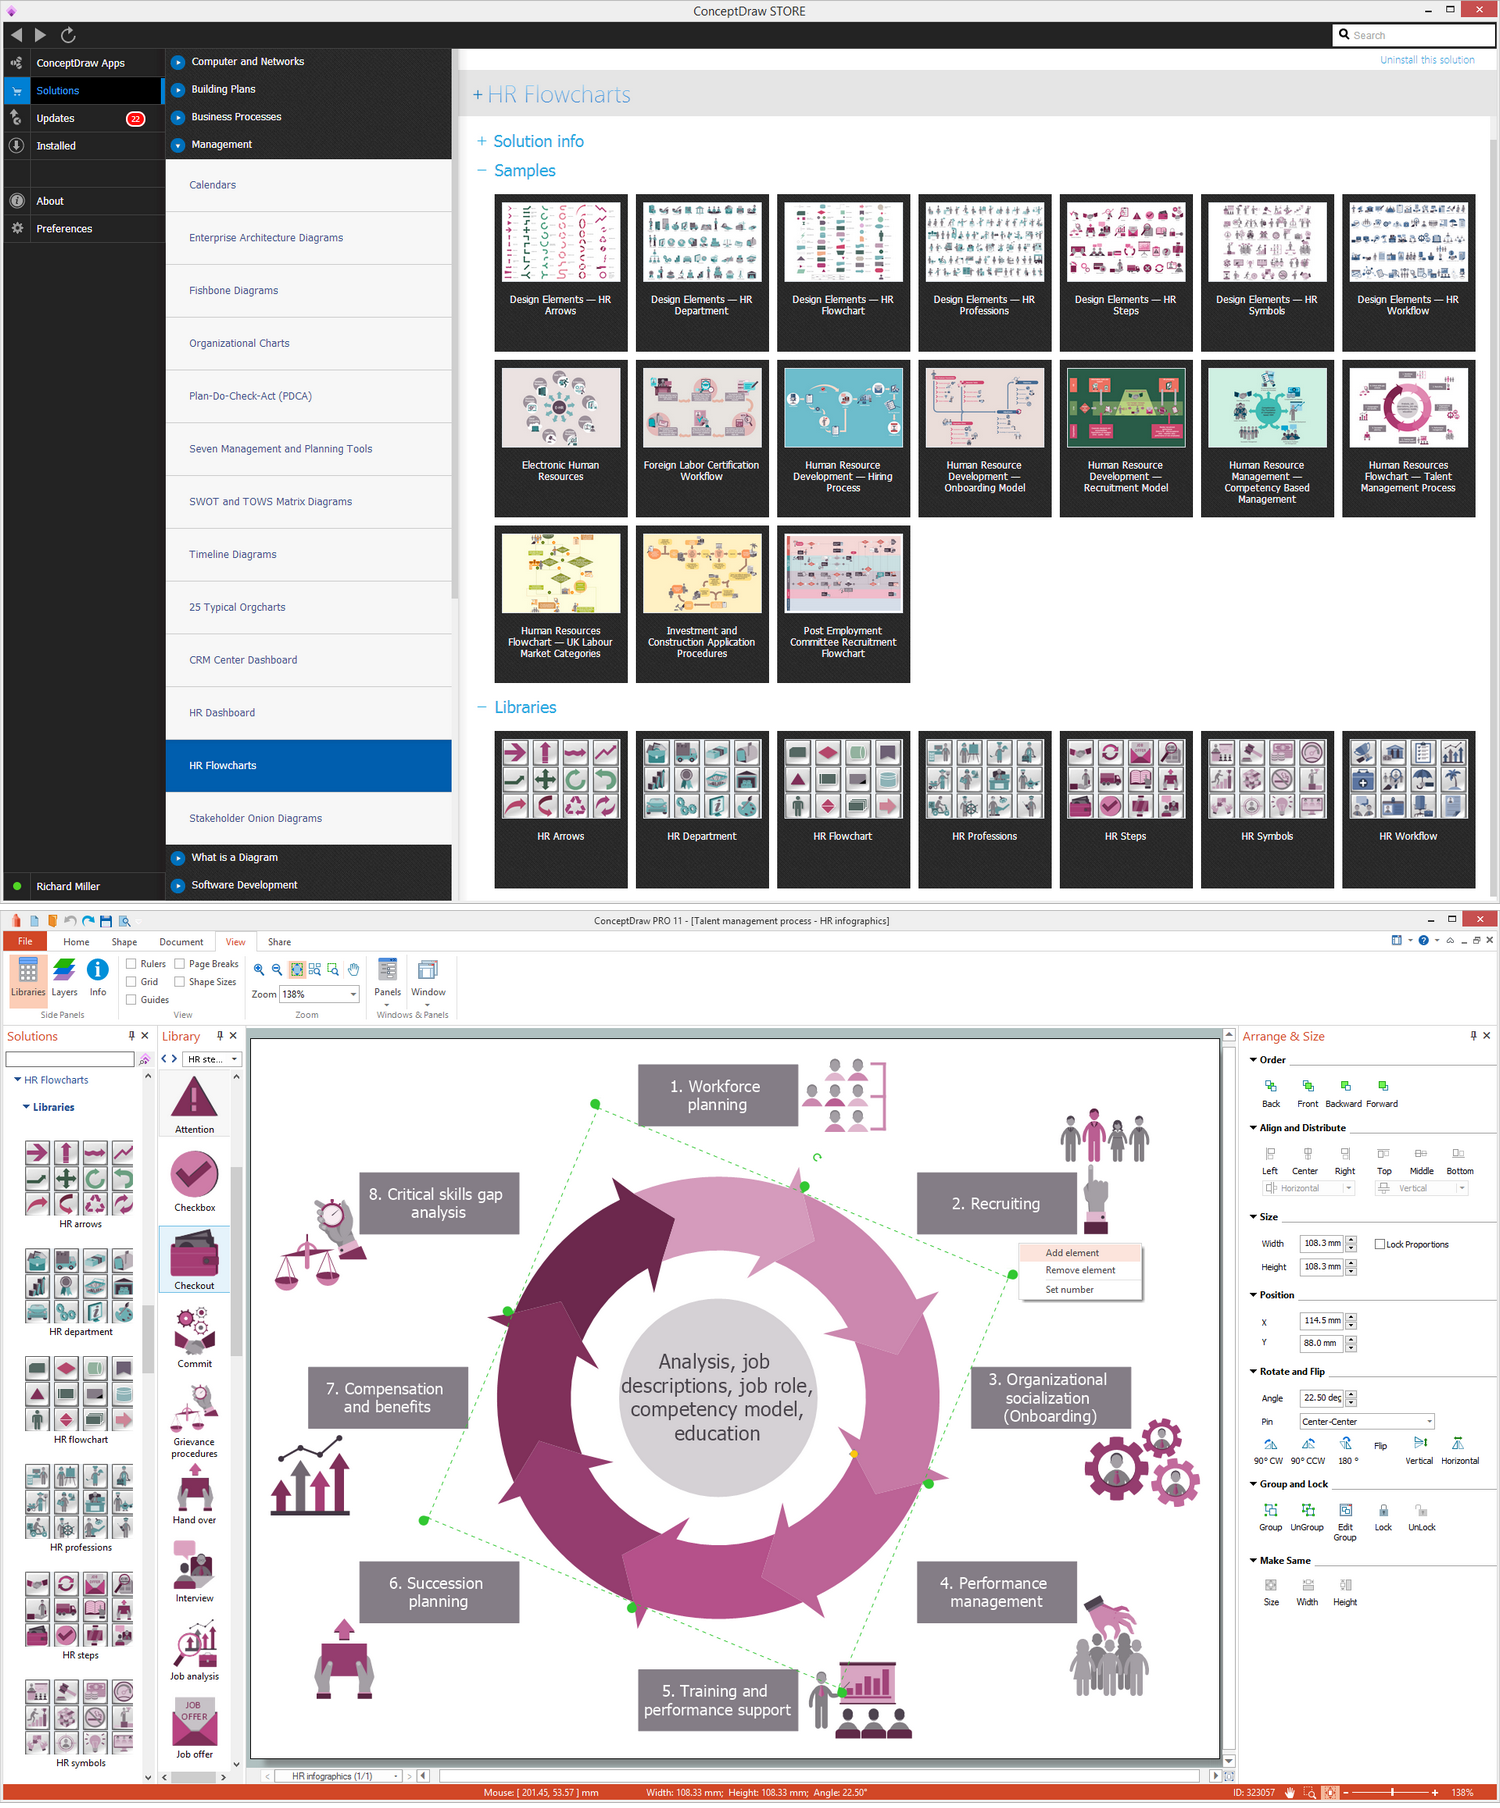
Picture: Human Resources
Related Solution:

