
Sample 1. ConceptDraw PROJECT Gantt Chart Software
ConceptDraw STORE offers you the Project Exchange Solution from the Collaboration Area that allows to get instantly the access to the ConceptDraw PROJECT

Sample 2. Project Exchange Solution in ConceptDraw STORE
Use the New Project Template from the Project Exchange Solution from ConceptDraw STORE to quickly create the new project in ConceptDraw PROJECT Easily create and organize the tasks, assign resources, track and manage any activity or event that requires planning, budgeting or tracking a variety of resources, with ConceptDraw PROJECT !

Sample 3. Gantt Chart Sample
Use ConceptDraw PROJECT and Project Exchange Solution from the Collaboration Area from ConceptDraw STORE to create and manage your single and multiple projects quick, easy and effectively.
The Benefits for ConceptDraw PROJECT Gantt Chart Software
- ConceptDraw PROJECT is an effective tool with powerful functionality which is ideal for planning, scheduling and monitoring project development, allocation of budget and resources.
- ConceptDraw PROJECT enables you to manage single and multi-projects, create visual project dashboards and diagrams, generate various kinds of reports with one click.
- ConceptDraw PROJECT provides wide capabilities of importing and exporting in various formats: Microsoft Project, ConceptDraw MINDMAP, Mindjet MindManager, PDF file.
TEN RELATED HOW TO's:
ConceptDraw DIAGRAM is a flowchart creating software. This software includes over 20 vector stencils in libraries. These objects allow you to create well-designed flowcharts.
Put an initial object from library to a page and use RapidDraw technology clicking on direction arrows to add new objects to the flowchart. This way you can make flowchart quickly.
Picture: How To Create a Flow Chart in ConceptDraw
Related Solution:
ConceptDraw DIAGRAM diagramming and vector drawing software offers the Timeline Diagrams solution from the Management area which is rich for the timeline examples, samples, templates and ready-to-use vector shapes.
Picture: Timeline Examples
Related Solution:
Building plans are usually very complicated and a hard work to do. It would be nice to use a proper drawing software to facilitate the task. Design a site plan quick and easily with all the stencils and samples from ConceptDraw libraries.
This drawing shows content of the ConceptDraw vector libraries related to the site planning and arrangement of the living environment. ConceptDraw delivers about 50 libraries containing near one and a half thousands vector objects that will help you to design territory arrangement plans and make the Site plan sketches. You can use the Parking and Roads library for designing a parking space, or drawing transport management schemes. The Site Accessories library provides a number of objects, that allow you to depict various equipment of vehicle access control, street lamps, benches, trash cans and other items of the street environment.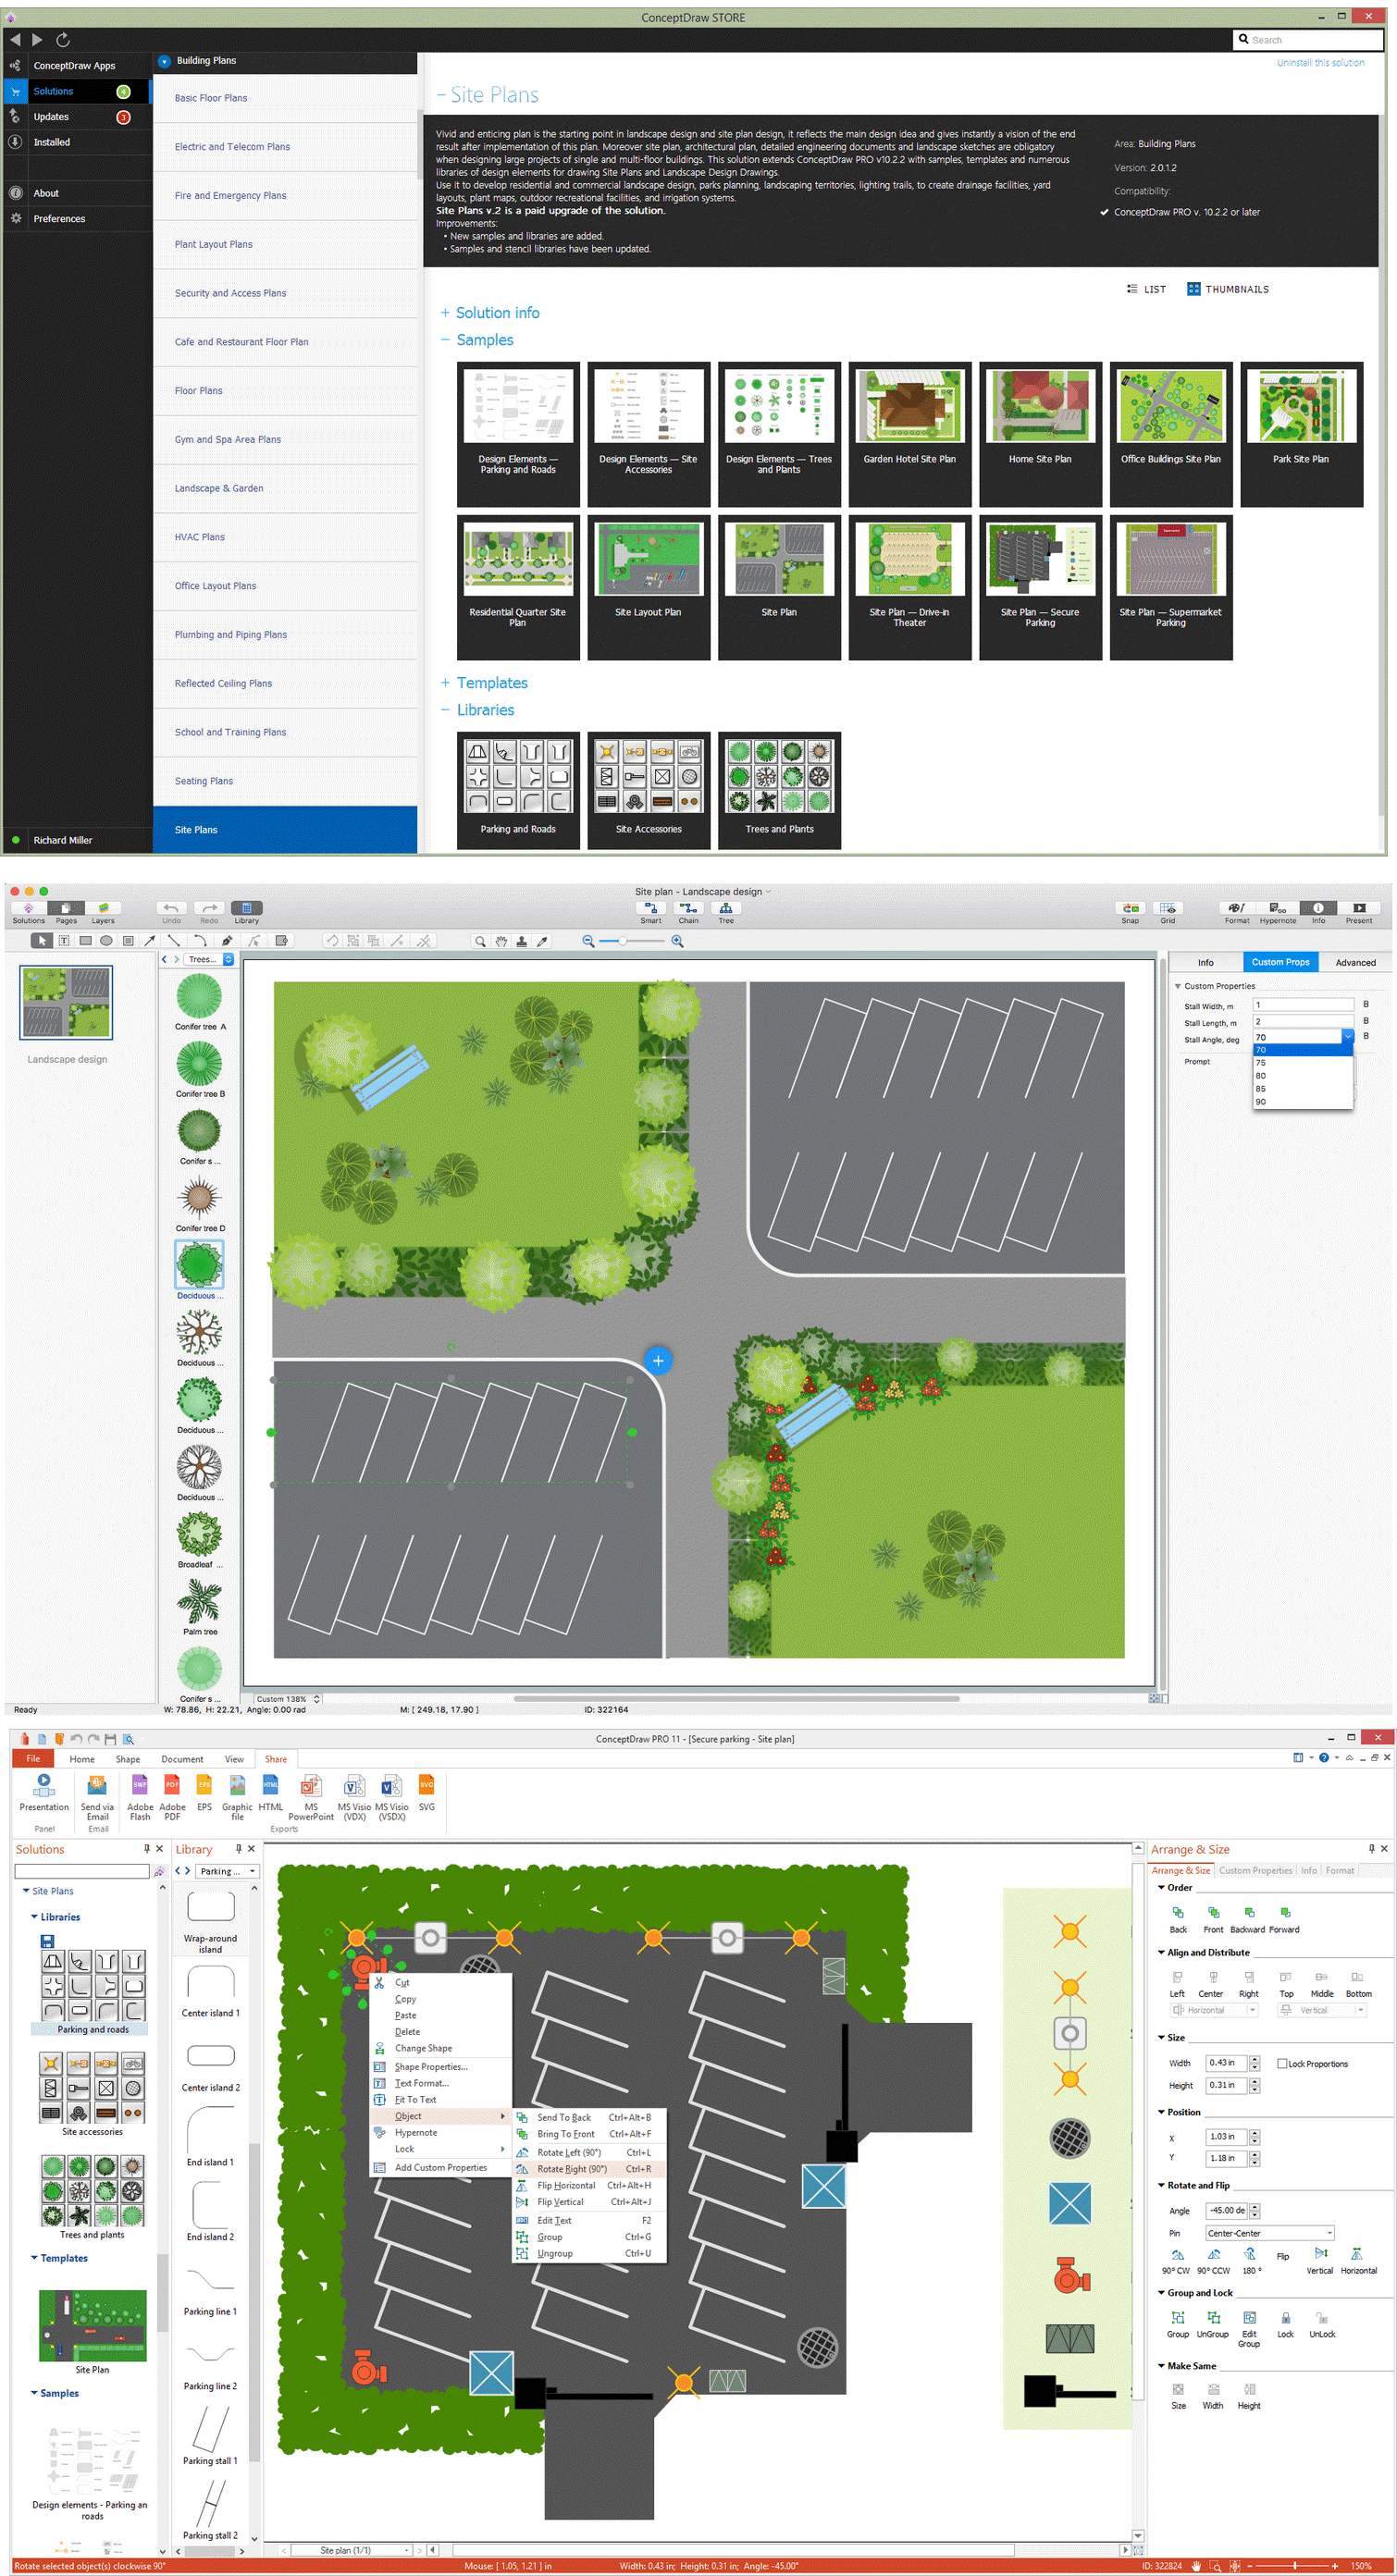
Picture: Building Drawing Software for Design Site Plan
Related Solution:
Large crowds need a lot of planning for; keep areas and events organized by creating a seating plan. Be the first to know when it is standing room only!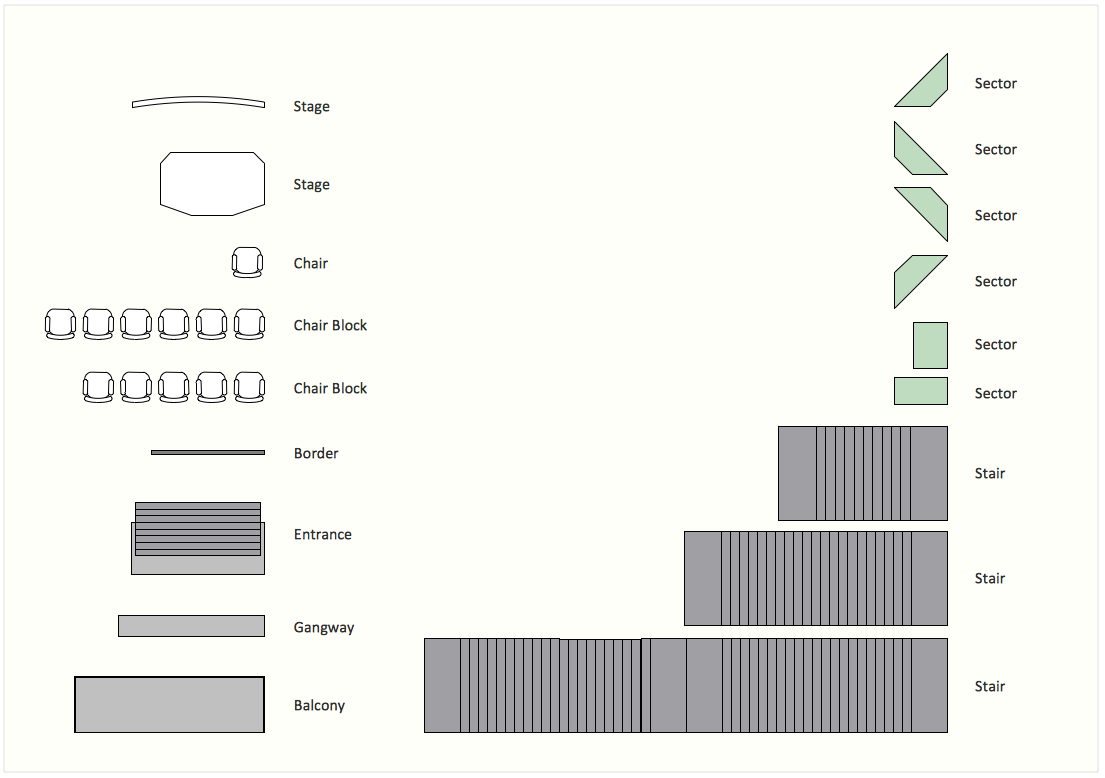
Picture: Interior Design. Seating Plan — Design Elements
Related Solution:
PM Made Easy allows you to plan and execute projects using mind mapping techniques, implement planning using mind mapping, and track tasks using ConceptDraw Project.
Picture: Gantt Chart Diagram
Related Solution:
PERT Chart Software - Activity Network and Project Evaluation and Review Technique, or PERT, charts are a way of documenting and analyzing the tasks in a project.
ConceptDraw DIAGRAM is a powerful diagramming and vector drawing software for designing professional looking PERT Charts quick and easy.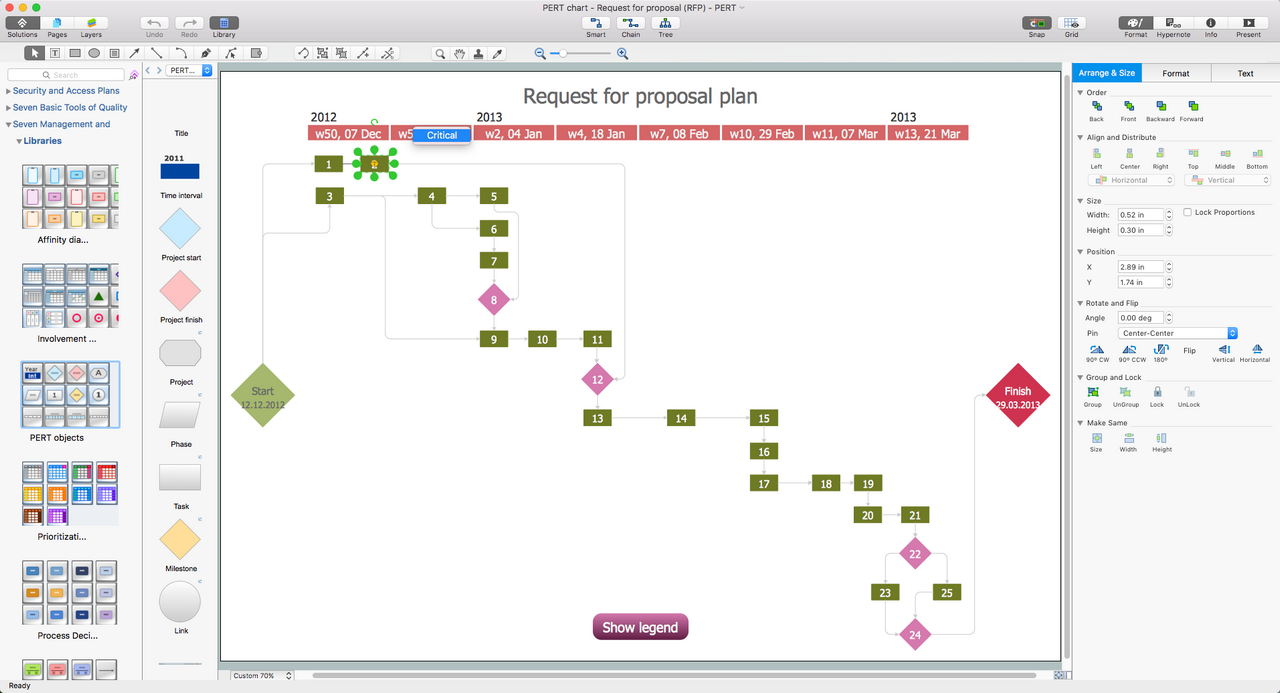
Picture: PERT Chart Software
Related Solution:
How to do Skype Presentation. Solution for ConceptDraw Mindmap
Picture: Skype Presentation
Related Solution:
Use ConceptDraw DIAGRAM diagramming and business graphics software to draw your own flowcharts of computer algorithms.
Picture: Process Flow app for macOS
Related Solution:
ConceptDraw - Organigram software allows quickly create Organigrams and much more. ConceptDraw DIAGRAM is an ideal tool for Administrative staff to clearly demonstrate the company orgchart professional.
Picture: Organigrams with ConceptDraw DIAGRAM
Related Solution:
UML Communication diagramming software with rich examples and template. ConceptDraw is ideal for software designers and software developers who need to draw UML Communication Diagrams.
Picture: Communication Diagram UML2.0 / Collaboration UML1.x
