
Example 1. Pyramid Charts Software
Pyramid Chart library objects:
Pyramid Diagrams library from the Pyramid Diagrams solution includes 28 vector pyramid objects of various types that will help you design your Pyramid Charts in minutes.

Example 2. Pyramid Diagrams Library Design Elements
Example for the Pyramid Diagram

Example 3. Pyramid Charts - Market Value Pyramid
This market value pyramid diagram has 5 levels:
- Essence (Who we are),
- Competitive positioning (Where we play),
- Customer benefits (Value proposition),
- Product / Service features (Value delivery),
- Internal capabilitiea (Value requirements),
and can be successfully used to develop your marketing strategy.
Free Download Pyramid Chart Software and View All Examples

Example 4. Pyramid Charts - Graham's Hierarchy of Disagreement
This sample was created in ConceptDraw DIAGRAM using the Pyramid Diagrams Solution and shows the Graham's hierarchy of disagreement. An experienced user spent 5 minutes creating every of this sample. You can find this sample in ConceptDraw STORE.
Use the Pyramid Diagrams solution to illustrate your documents, infographics, presentations and websites with pyramid charts, triangle charts and triangular diagrams using ConceptDraw DIAGRAM diagramming and vector drawing software.
The Pyramid Diagrams and Charts produced with ConceptDraw DIAGRAM drawing tools are vector graphic documents and are available for reviewing, modifying, and converting to a variety of formats (image, HTML, PDF file, MS PowerPoint Presentation, Adobe Flash or MS Visio).
TEN RELATED HOW TO's:
You are landscape designer and dream about powerful drawing software to quickly represent your design ideas on the screen and on the paper? Each time you ask yourself a question How to design a garden fast and easy?. You want to automate creating of landscape and garden plans? ConceptDraw DIAGRAM diagramming and vector drawing software extended with Landscape & Garden Solution from the Building Plans Area will help you!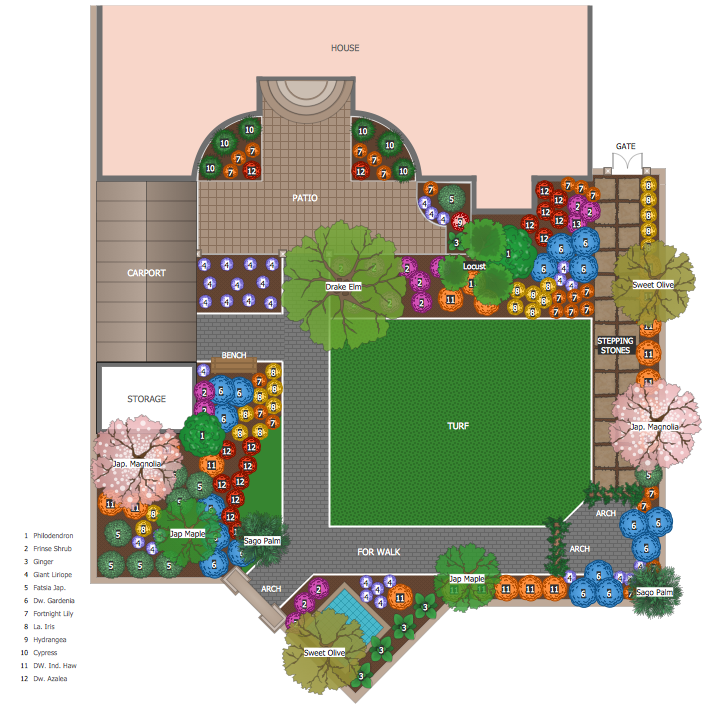
Picture: How to Design a Garden
Related Solution:
It can be tough to get straight into business papers and processes.Otherwise, you can learn how to create flowcharts for an accounting information system and visualize these documents. Accounting diagrams are clear and easy to understand for all the participants of the process.
There are symbols used for creating accounting flowcharts using ConceptDraw DIAGRAM and its Accounting Flowcharts solution. Accounting flow charts are a special kind of flow charts. Actually a variety of flowcharts are often used to facilitate many aspects of a workflow of accounting department. Accounting flowcharts are utilized to support creating accounting documentation, to depict positions responsible for fulfillment of each phase of accounting workflow.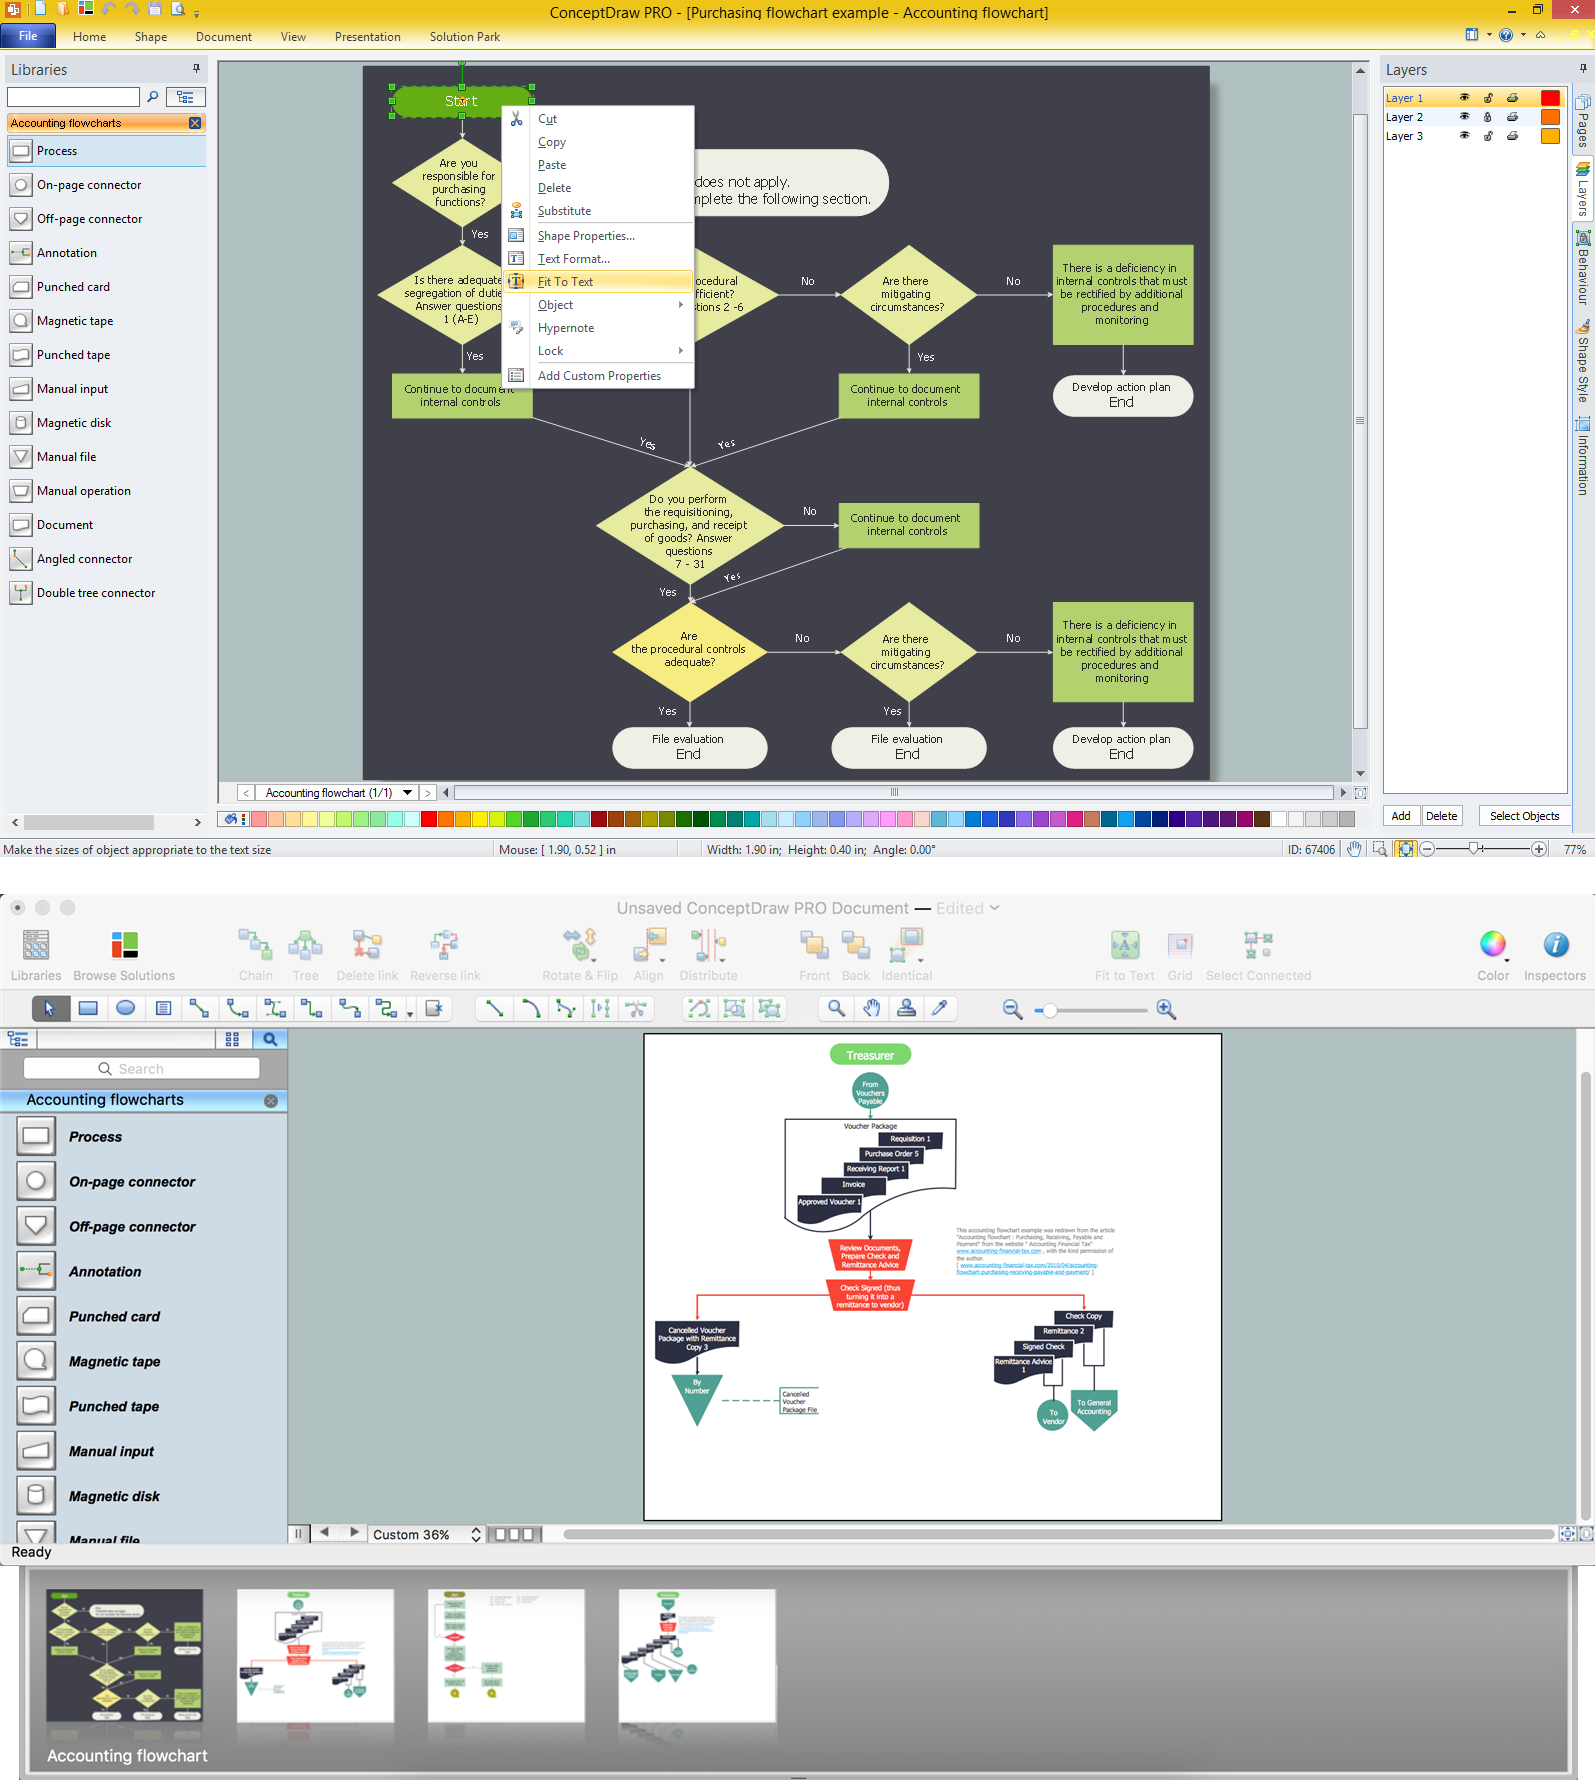
Picture:
How to Create Flowcharts for an
Accounting Information System
Related Solution:
Network infrastructure planning is a very important process in the network construction, and the share of time allocated to this within the scope of the entire project may reach 60-80%. A competent and thorough approach to planning contributes to the quick investment return, and also increases the reliability and flexibility of the final system, reducing the probability of additional costs related to the incorrect implementation.
Any planning begins with an analysis of the business requirements to the final system. Basic network parameters, which should be assessed are the scalability, accessibility, cost, speed and safety.
Speed and cost are often mistaken for the most important parameters, and the rest of the parameters aren't even remembered. This is not entirely correct. Initially, it is necessary to assess the business plans for the future, because sometimes it is more profitable to invest more money in the beginning. If the business is to develop, then, consequently, demands on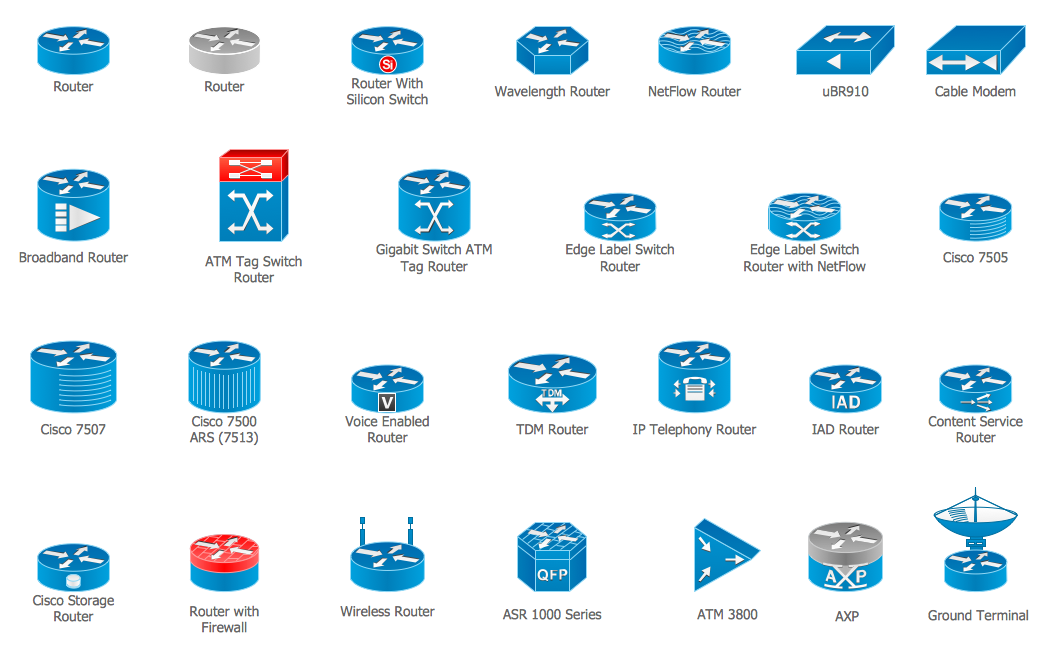
Picture: Cisco Routers. Cisco icons, shapes, stencils and symbols
Related Solution:
This sample was created in ConceptDraw DIAGRAM diagramming and vector drawing software using the Bubble Diagrams Solution from the Diagrams area of ConceptDraw Solution Park.
This sample clearly shows the Four Dimensions Bubble Diagram of the distribution of chlorine contaminant in the water source. This Bubble Diagram is very useful in the chemistry, hydrology, and ecology.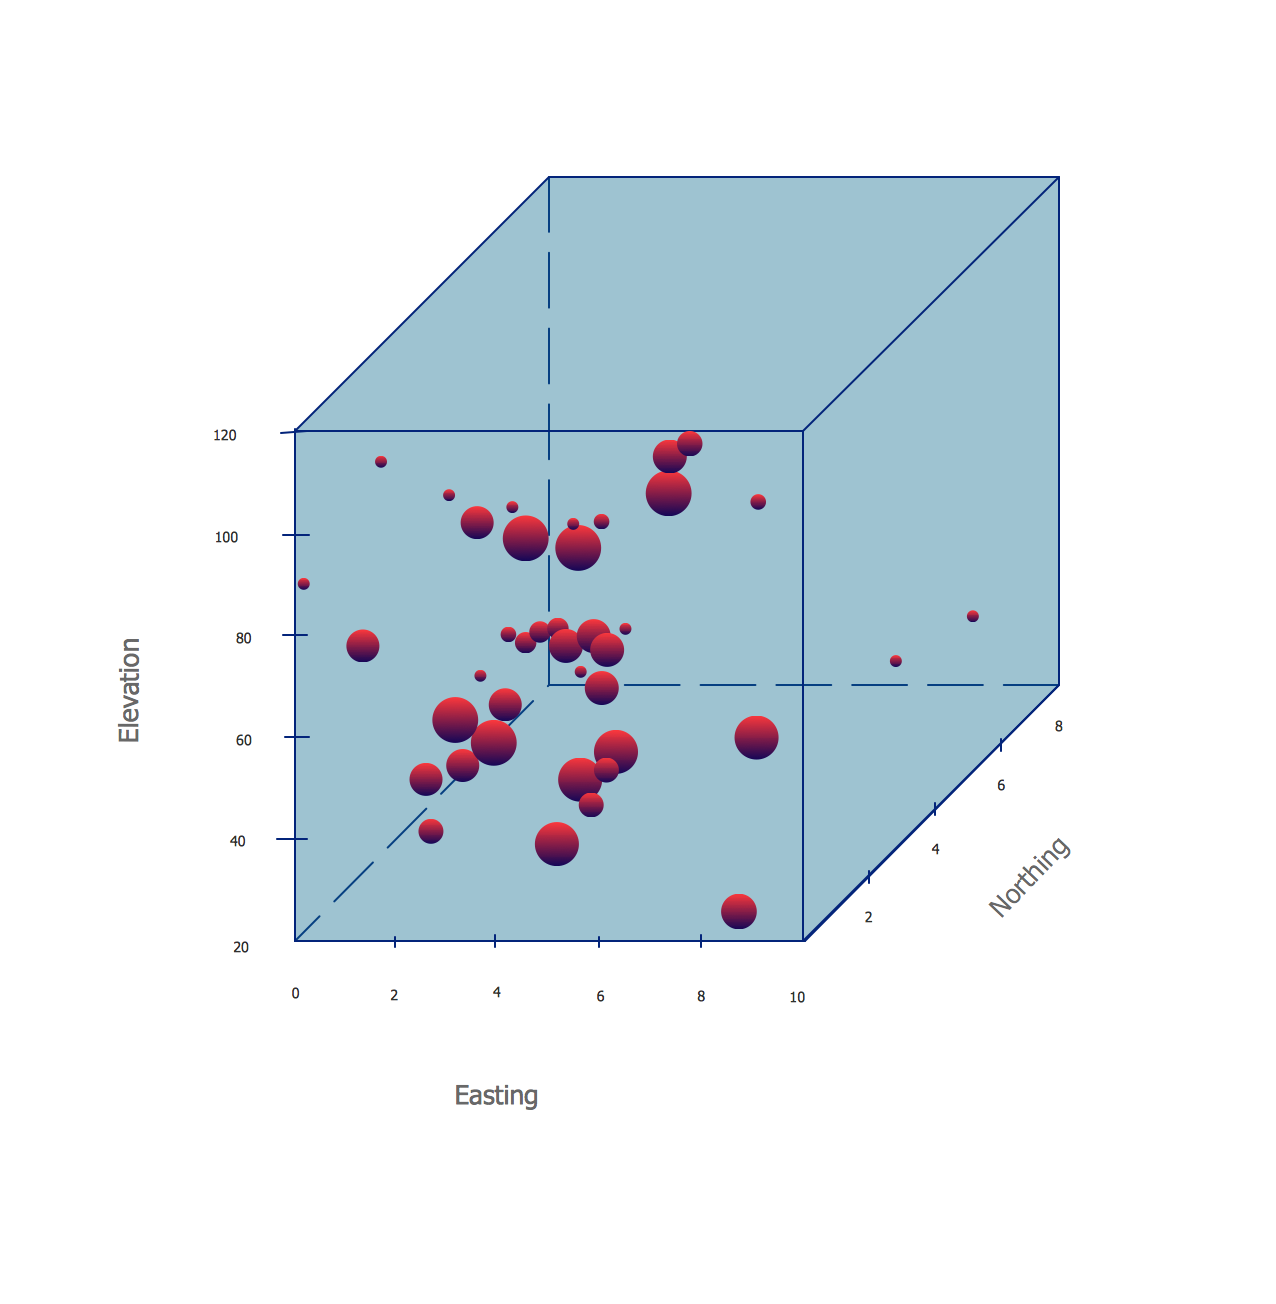
Picture: Four Dimensions Bubble Plot
Related Solution:
This sample was created in ConceptDraw DIAGRAM diagramming and vector drawing software using the Line Graphs Solution from Graphs and Charts area of ConceptDraw Solution Park.
This sample shows the Line Chart of annual percentage change. The Line Chart allows you to clearly see the changes of data over the time.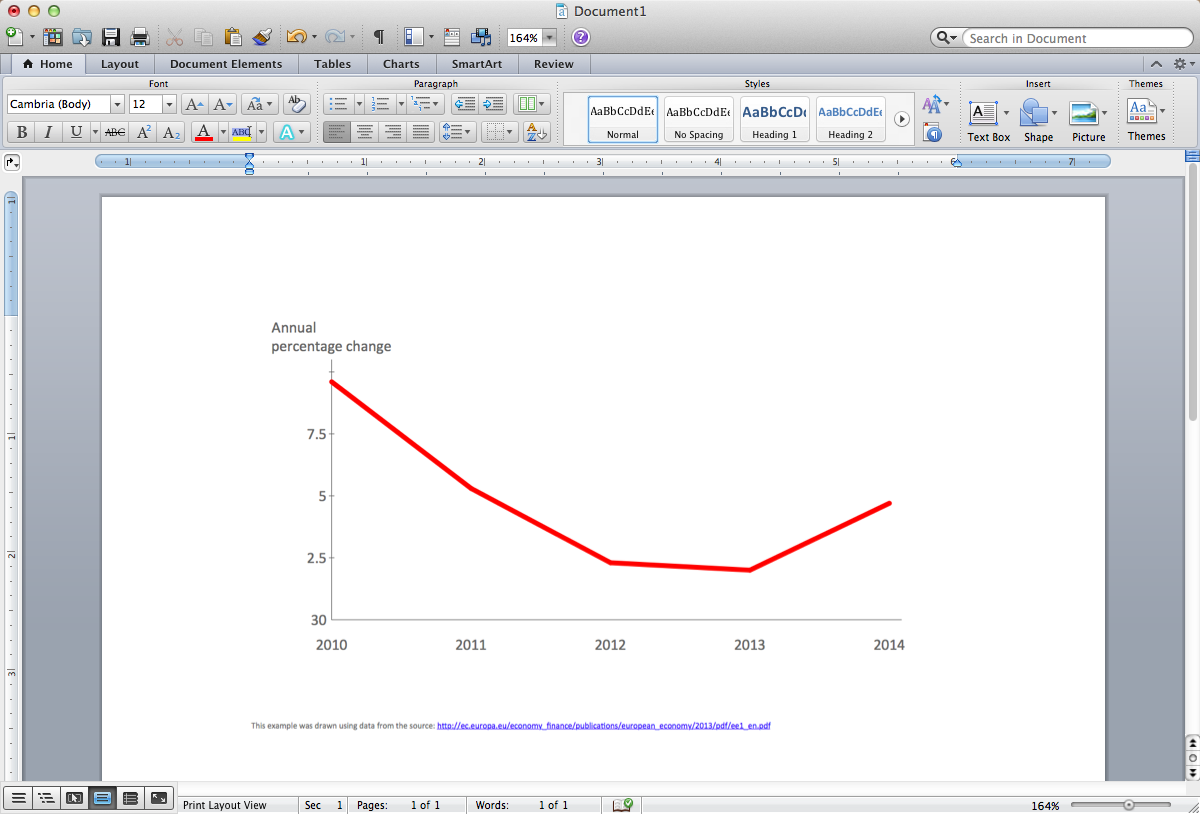
Picture: Line Chart Template for Word
Related Solution:
Download ConceptDraw diagram software for easy drawing.
Picture: The Best Choice for Creating Diagram
Related Solution:
There are plenty of diagramming tools, the question is to choose the most suitable for your needs. For example, you can choose ConceptDraw DIAGRAM as organizational chart software and get fascinating results in a few minutes. An orgchart is useful for any corporation.
This is an example of a hierarchical organization scheme of the company. It has tree-like structure. Each middle manager is subordinated to a few employees, and he is accountable to one of the top managers. Every type of organizational composition of businesses may be presented in the view of an organizational chart that is supported by ConceptDraw Organisational Charts solution. There are number of ways of building a structure of business organization, establishing how it should function.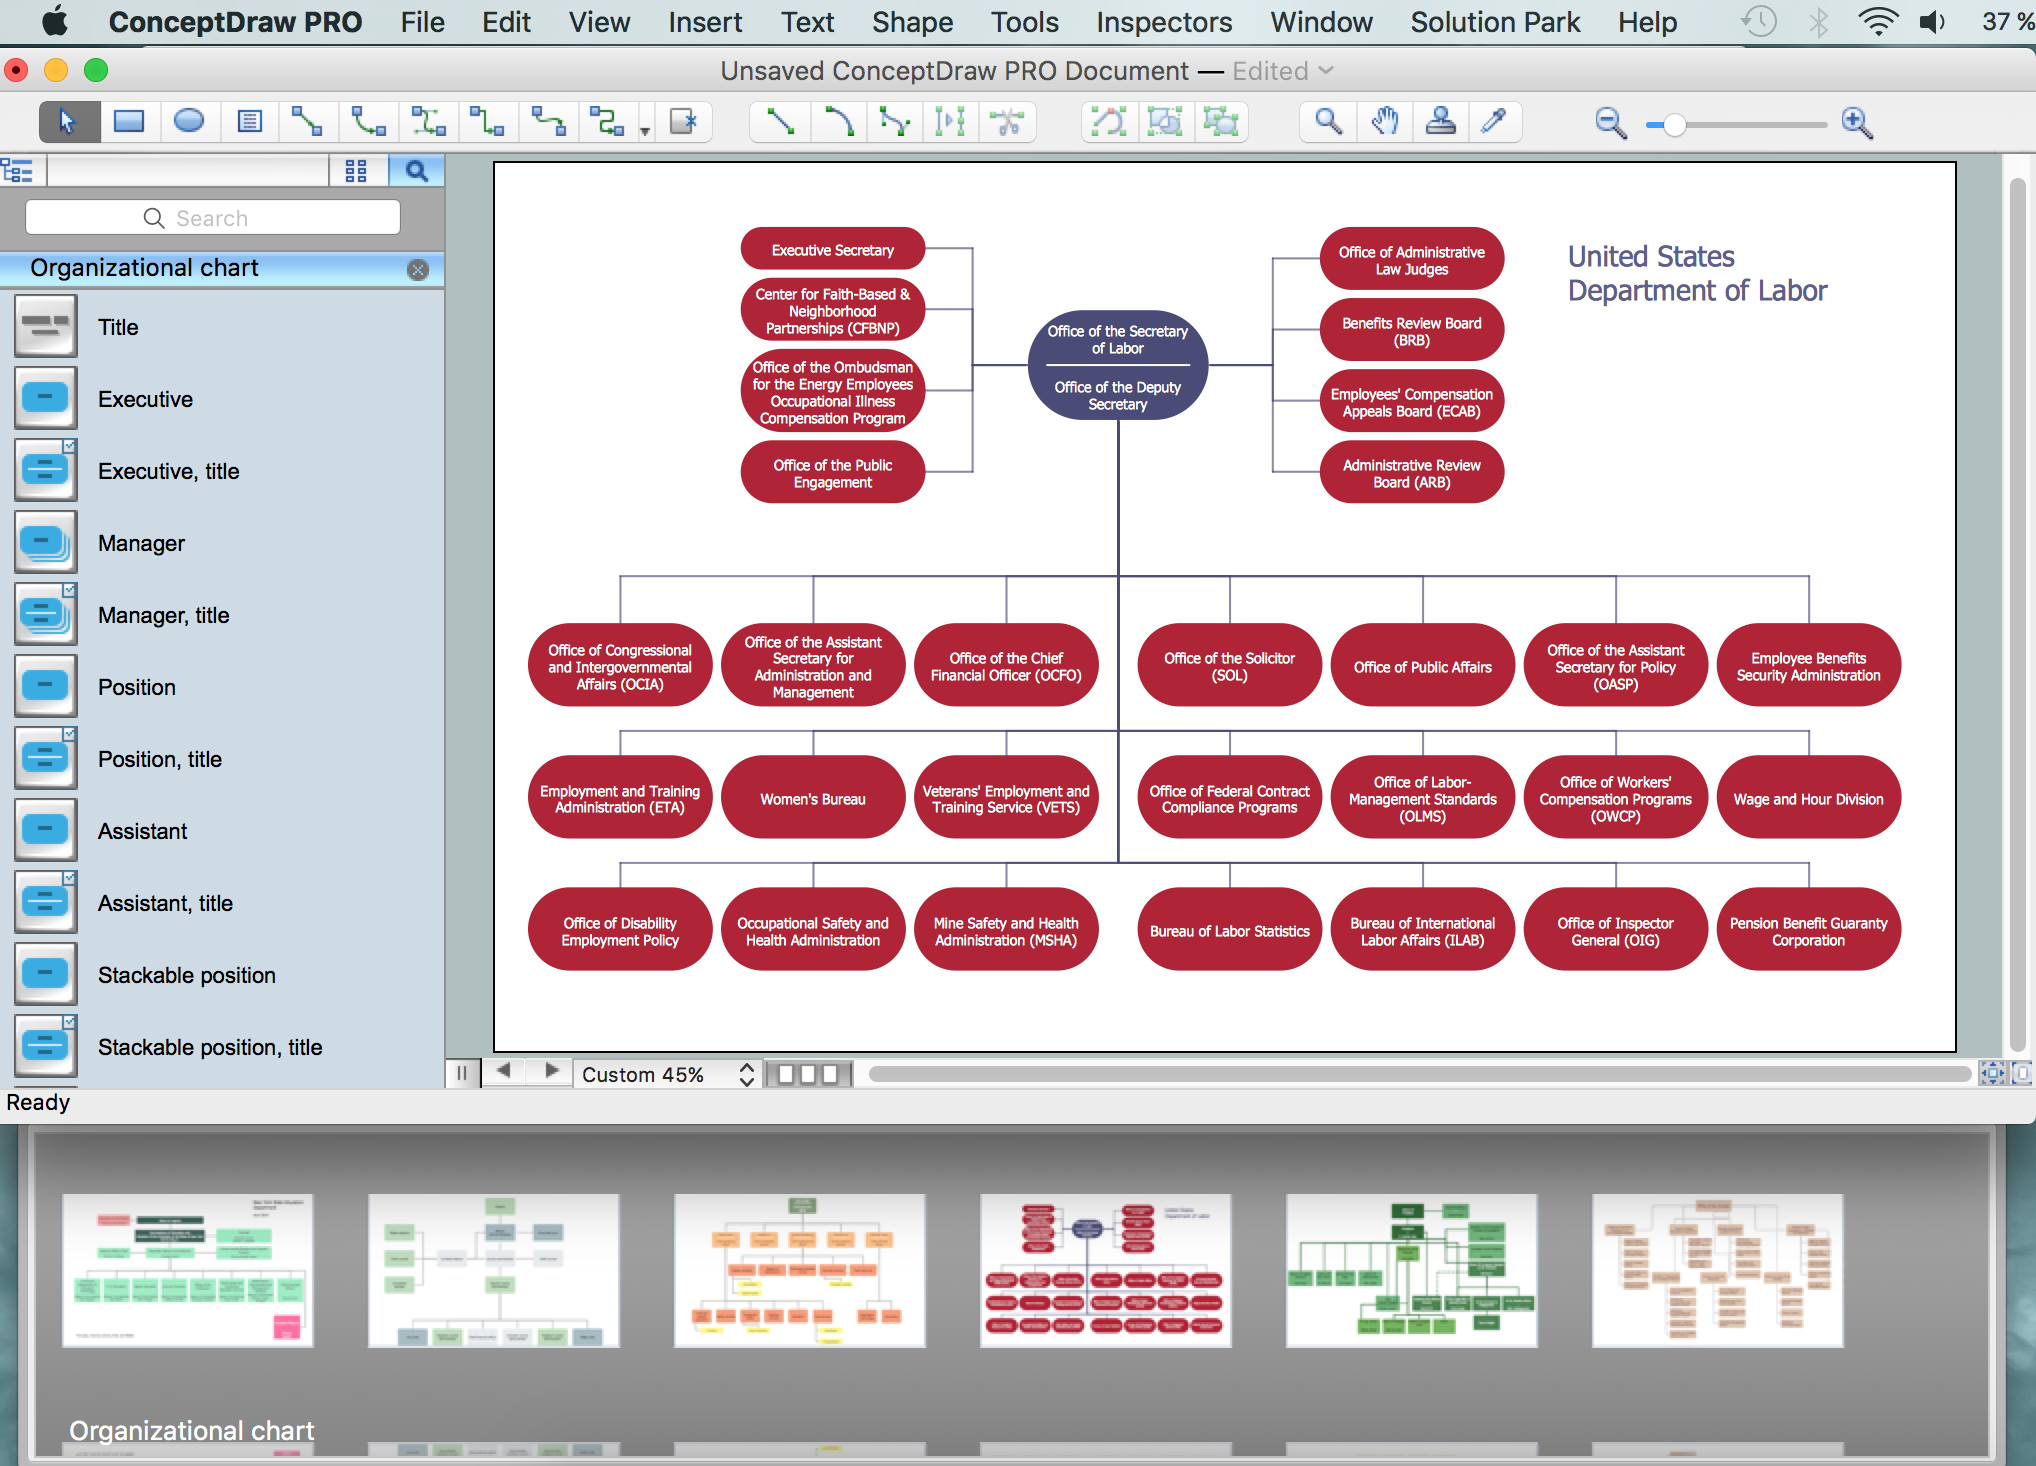
Picture: ConceptDraw DIAGRAM - Organizational chart software
Related Solution:
Have you ever wanted to start your own cafe? To imagine any possible options, try Cafe Floor Plan Design Software now for free 21 day trial. This will allow you to use all the ConceptDraw DIAGRAM main features.
Here is an example of a multi-page document consisting from the various options of interior design and plans for arranging a cafe. This document can be used as a basis for the development of a professional designer portfolio. It was drawn using ConceptDraw Cafe and Restaurant Plans solution. The solution supplies vector libraries, templates and samples that are released to assist amateurs and professionals to draw the i designs of interior and furniture layouts of the cafe hall and lobby.
Picture: How to create Cafe Floor Plan Design
Related Solution:
Professional Mind Mapping. ConceptDraw MINDMAP professional software to create documents. Mac and PC compatible. MS Office Exchange Solutions. Skype Collaboration. Presentation Tools.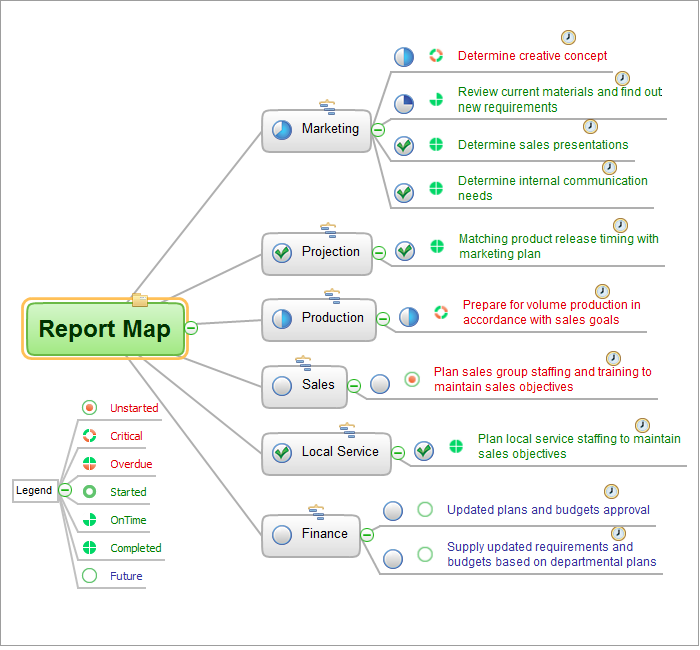
Picture: One formula of professional mind mapping :input data + output data + make great presentation
Related Solution:
There are many ways to describe a database structure. One of the most usual is to draw an entity relationship diagram (ERD) using a Crow’s Foot notation to represent database elements. If you don’t want to draw it on paper, you should use an appropriate software.
An entity-relationship (ER) diagram is used to show the structure of a business database. ERD represents data as objects (entities) that are connected with standard relationships symbols which Illustrate an association between entities. ERD, there is a wide range of ERD notations used by data bases architects for reflecting the relationships between the data entities. According to the crow’s foot notation relationships are drawn as single labeled lines designating a certain kinds of relationship. Crow foot notation is a most frequently used ERD standard, because of improved readability of diagrams, with a more accurate use of space on the page._Win_Mac.png)
Picture: Entity Relationship Diagram - ERD - Software for Design Crows Foot ER Diagrams
Related Solution:


