Today almost everyone has been subjected to the sales process, however professional selling involves a series of distinct steps. One shortcut to success in any industry is to follow footsteps of those who earned success before you.
In this lesson, you'll learn about important steps in sales process and will be provided with examples.
ConceptDraw DIAGRAM diagramming and vector drawing software supplied with unique Sales Flowcharts solution from the Marketing area of ConceptDraw Solution Park allows fast and easy visualize all sales steps of the sales process on a sales process Map or sales process flowchart, and then realize them easily.
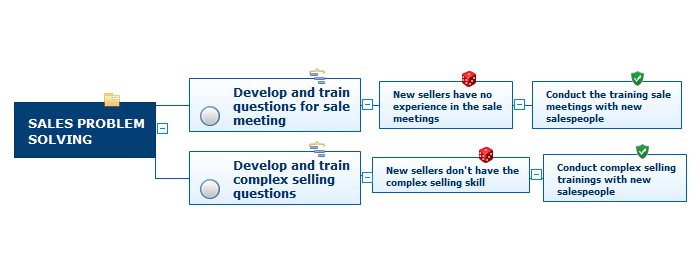
Example 1. Sales Steps
Outlining the sales process - what can be easy? Thanks to the 6 libraries of the Sales Flowcharts Solution it is a very simple process:
Sales Arrows
Sales Department
Sales Flowchart
Sales Steps
Sales Symbols
Sales Workflows
These libraries contain all vector shapes and symbols needed for representing the sales steps and displaying the sales results.
Steps to Creating a Sales Process Flow Chart
Helps to create professionally looking and detailed sales flowcharts with all sales steps visually represented on them.
Create new document
Add needed objects to the page
Place objects in needed position
Open Sales arrows library, drag and drop Circular motion arrows object
Add needed quantity of segments using object menu
Select a segment from the group, select a group-figure for that (Circular motion arrows), one more click and inside figure will be selected
In this case, it will be one of the arrows
Open Object Filling Inspector from Ribbon
Change arrows color
Note: You may use standard pallet or use a custom one
Open line inspector, switch off the Stroke
Add International division and Nurturing objects
Align these objects
Group all objects for convenient usage
Add more objects
Arrange and change sizes
Turn on size boxes
Note: Size will be shown for selected object in units of document
Add a Textbox, just double click on the page space
Note: Font and color will be same as the last added object from the library
Open Inspectors - Text
Set the needed font, size and color. All the next textboxes will have these atributes
Fill the needed text
Use Ellipse tool located on ribbon
Draw a circle on top of all objects
Note: to draw a proper circle, hold a Shift button
Change color of circle
Add names to top objects
Add more objects
Flip horizontally one of the figures
Open Instectors - Layer
Set another level as "work"
Add a rectange equal the page size using Restangle tool on the ribbon
Bring to the back this rectangle using the tool on ribbon
Change its color
Set the first level as "work"
Lock the second level from edition
Change filling for some objects
Open Inspectors - Text - Change text color
Add some pointing arrows from Sales arrows library
Select one by one and change their color
Note: to select several objects, hold the Shift button
Add few more flowchat steps
Add new objects and arrows
Open Page Inspector
Change the name of page by double click on it
Save the document
Export it to PDF
Open file in PDF reader program!
All source documents are vector graphic documents. They are available for reviewing, modifying, or converting to a variety of formats (PDF file, MS PowerPoint, MS Visio, and many other graphic formats) from the ConceptDraw STORE. The Sales Flowcharts Solution is available for all ConceptDraw DIAGRAM
Use the Sales Flowcharts Solution for ConceptDraw DIAGRAM software to create your own Sales Flowcharts of any complexity quickly, easily and effectively to use them successfully in your work activity.
Video. Steps to Creating a Sales Process Flow Chart (2min 05sec)
Competitor analysis is a first and obligatory step in elaboration the proper corporate marketing strategy and creating sustainable competitive advantage. Use powerful opportunities of numerous solutions from ConceptDraw Solution Park for designing illustrative diagrams, charts, matrices which are necessary for effective competitor analysis.
What are the favorite educational technology tools and techniques for teachers? Of course these are pictures, images and education infographics! ConceptDraw DIAGRAM software supplied with Education Infographics Solution from the Business Infographics Area provides powerful drawing tools to help design the education infographics of any complexity.
Process Decision Program Chart (PDPC) is a commonly used technique that was designed in order to help prepare the contingency plans. The emphasis of the PDPC is identifying the consequential impact of failure on activity plans as well as creating the appropriate contingency plans in terms of limiting the risks. Planning to make the tree diagrams and/or the process diagrams can be extended by a couple of levels when the PDPC can be applied to the bottom level tasks on those diagrams.
Picture: Risk Diagram (Process Decision Program Chart)
ConceptDraw DIAGRAM is a powerful diagramming and vector drawing software. Supplied with Enterprise Architecture Diagrams Solution from the Management Area, ConceptDraw DIAGRAM is ideal for construction the Business Architecture Diagrams.
You want design the Cross Functional Diagram and need powerful software? Then ConceptDraw DIAGRAM diagramming and vector drawing software extended with Cross-Functional Flowcharts Solution is exactly what you need.
To draw SysML diagrams use the ConceptDraw DIAGRAM software extended with the Rapid UML solution from the Software Development area of ConceptDraw Solution Park.
If you ever wanted to try any diagramming tools except of Visio, but were afraid to lose existing documents, there’s good news for you. One of the most striking features of ConceptDraw DIAGRAM is it’s perfect compatibility with MS Visio, which guarantees that you won’t depend on operating system anymore, because another ConceptDraw DIAGRAM feature is that it’s cross-platform tool. Don’t waste your time looking for other options, you’ve found the solution already!
Business professionals often utilize the MS Visio as a common tool for making various issues on business visualization. MS Visio is a strong software with good capacity to maintain complex business solutions. But there is no MS Visio for Apple OS X. This is a large invocation, and one would be pleased to recognize that ConceptDraw DIAGRAM is the ideal alternative to MS Visio. Primarily, because this software works natively on both Windows and Apple OS X platforms. if you have migrated from Windows to Mac, or need to communicate in a cross-platform conditions, you’ll search for MS Visio replacer. ConceptDraw DIAGRAM is the exclusive professional business diagramming application that runs on both Windows and Apple OS X. The opportunity exchange files between PC and Mac, as well as between ConceptDraw DIAGRAM and Visio is the significant advantage that permits you to display and to collaborate business information in effortless and cost-effective way.
Picture: ConceptDraw DIAGRAM Compatibility with MS Visio
Baden-Württemberg is one of the German states that is located in the southwest forming the border with France. It is Germany’s third largest state due to its population and size: its area is 35,751 square kilometers and there are altogether 10.8 million inhabitants. Stuttgart is known to be both this state’s capital and its largest city. The sobriquet Ländle can sometimes be used as a synonym for Baden-Württemberg.
You need create a Sales Process Map? Use the ConceptDraw DIAGRAM software which is ideal for the sales process management, marketing and engineering thanks to the powerful Sales Flowcharts solution from the Marketing area of ConceptDraw Solution Park.