Sequence Diagram Tool
The definition of the Unified Modelling Language can be found in other articles on this site, but to remind about it, we can mention that it is basically one of the developmental, general-purpose as well as modelling languages widely used in software engineering for providing a standard way for visualizing the design of a system, being originally developed for standardizing the disparate notational systems as well as approaches to software design in 1994. It was better developed by its “inventors” through 1996 and already in 1997 it was adopted as a standard by the so called “Object Management Group”, being managed by this organization ever since.
In 2005 UML was also published by the well-known “ISO” (“International Organization for Standardization”) as an approved ISO standard, after what it was revised to cover the latest revisions. Unified Modelling Language (or simply “UML”) provides an opportunity to visualize a system's architectural blueprints in a diagram. The elements of such diagram can be individual components of the system, activities or simply “jobs”, external user interface, with help of which it’s not a problem to represent the process of their interaction with other software components and follow the way the system can run as well as to see how the mentioned entities can interact with other components and interfaces.
The mentioned “UML” was extended to a larger set of design documentation, becoming very useful in many contexts, such as in software development, being designed to become compatible with the leading object-oriented software development methods, such as “Booch method”, “OMT” (object-modelling technique), so called “objectory” (or simply “object-oriented methodology”) and “RUP”, which is a Rational Unified Process — an iterative software development process framework created by the “Rational Software Corporation”.
It is important to describe the UML model correctly, opposing it to the other diagrams of a system. At the same time, a model may also contain documentation that drives the model elements and diagrams, for example the “written use cases”. All the “UML diagrams” represent two different views of a system model, which is a dynamic (also known as “behavioural”) view and a static one (known as “structural”). Thus, a dynamic view is used for showing the collaborations among different objects as well as changes to the internal states of such objects, which includes creating diagrams, such as “activity” ones, “state machine” ones and “sequence” ones. At the same time, the static view insists on the static structure of the system using attributes, objects, relationships and operations. The last view includes composite structure diagrams as well as the class diagrams.
Using the “XML Metadata Interchange” format (widely known as simply “.xmi” one), which is an object management group standard, used for exchanging any metadata information via XML means enabling the UML models to be exchanged among UML tools. “UML 2” has many different types of diagrams, divided into two categories, representing both structural information and general types of behaviour, including some, which represent different aspects of different interactions. The mentioned diagrams can be categorized as a hierarchy, including so called “interaction diagrams”, emphasizing the flow of data and control among the things in the system, which are being modelled. Thus, the “sequence diagram” shows the way objects communicate with each other, taking into consideration a sequence of messages.
The mentioned sequence diagram is basically one of the interaction diagrams, showing the way different objects operate with each another, also illustrating the order of such operation. Sequence diagram is known to be a construct of a “message sequence chart”, showing the object interactions arranged in a time sequence and depicting such objects as well as classes involved in the scenario. Within the sequence diagram, there’s a representation of the sequence of messages exchanging between the objects, which have to carry out the scenario, or, if to be clearer, its functionality.
All sequence diagrams can be associated with “use case realizations” due to the “Logical View” of any system, which is being under development. They can be also called as “event diagrams” (or “event scenarios”) and they all can be always created with the usage of ConceptDraw DIAGRAM drawing software. In order to show different objects or processes living simultaneously, you can draw the parallel vertical lines (so called “lifelines”) and to illustrate the messages exchanged between such objects, you can always draw the horizontal arrows in the needed order — the one, in which they occur, allowing the opportunity to show the specification of simple runtime scenarios in a graphical manner to appear.
If the mentioned “lifeline”, represented as the parallel vertical lines, is that of an object, then it’s known to be demonstrating a “role”. If you leave the instance name blank, then you represent unnamed and anonymous instances. Those messages, which are written with a use of horizontal arrows with the message name written just above them, display “interaction”, when solid arrow heads represent so called “synchronous calls”. The asynchronous messages are represented in a way of using the open arrow heads and the reply messages are represented simple by the dashed lines.
In case a caller sends a synchronous message, then it must wait until this message is done, but if he sends an asynchronous message, then it can continue processing and there’s no need to wait for any response. Asynchronous calls can be presented in the multi-threaded applications as well as in so called “message-oriented middleware”. Method-call boxes (also known as “activation boxes) are illustrated as the opaque rectangles, which are drawn on top of “lifelines” in order to represent that process is being performed in response to the message.
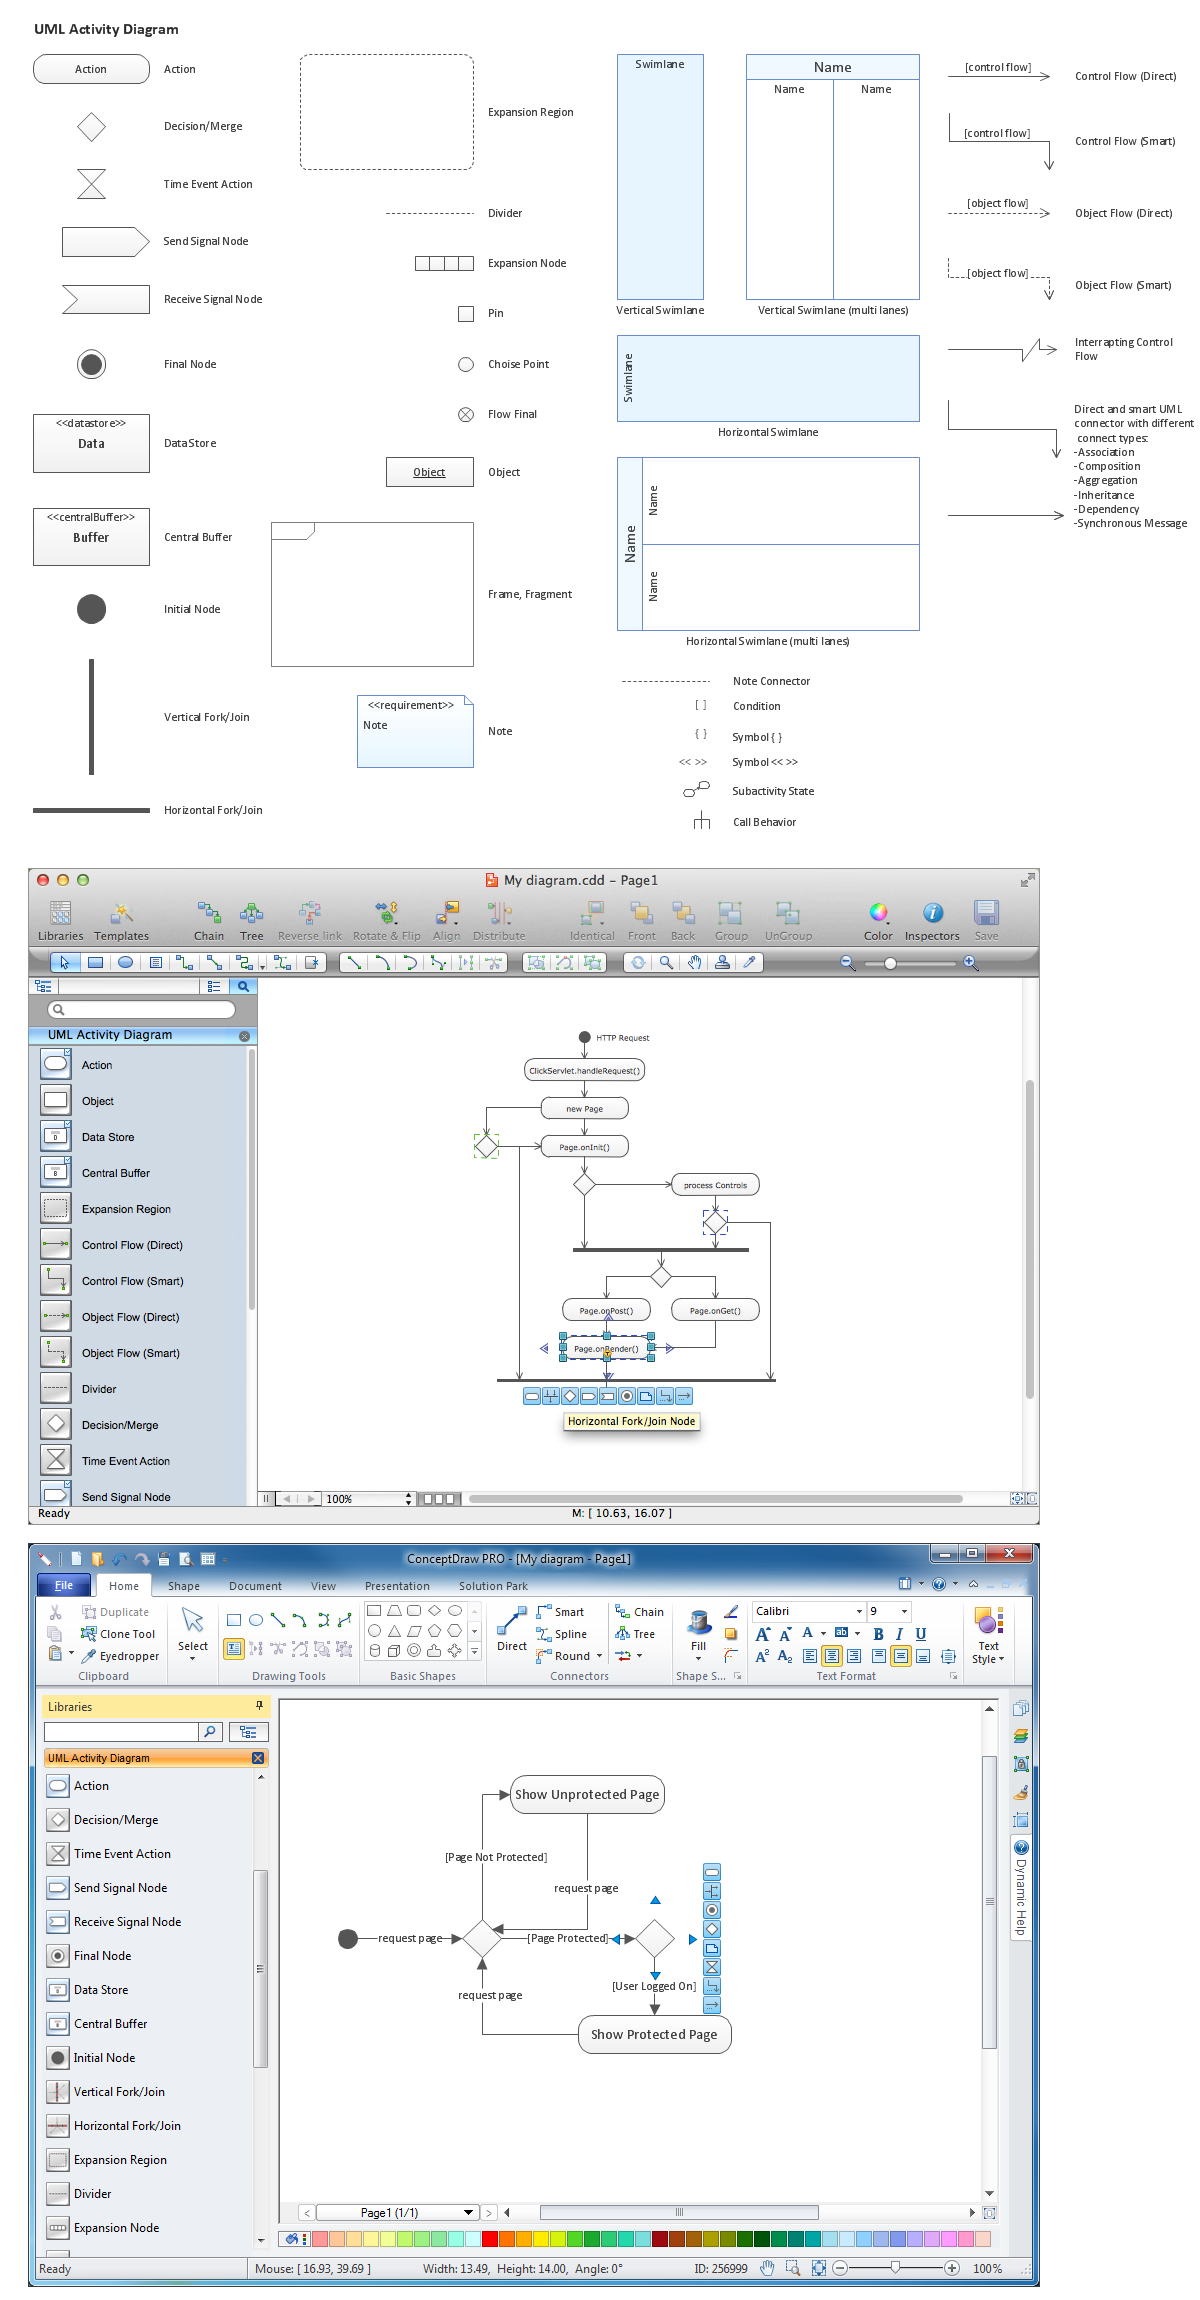
ConceptDraw DIAGRAM diagramming and vector drawing software as a sequence diagram tool provides the Rapid UML Solution from the Software Development Area that contains the UML Sequence library.

Example 1. Sequence Diagram Tool
The UML Sequence library from the Rapid UML Solution includes 50 vector objects for quick and easy designing the UML Sequence diagrams of any complexity. Simply drag the needed objects to the document and arrange them to make a desired sequence diagram.
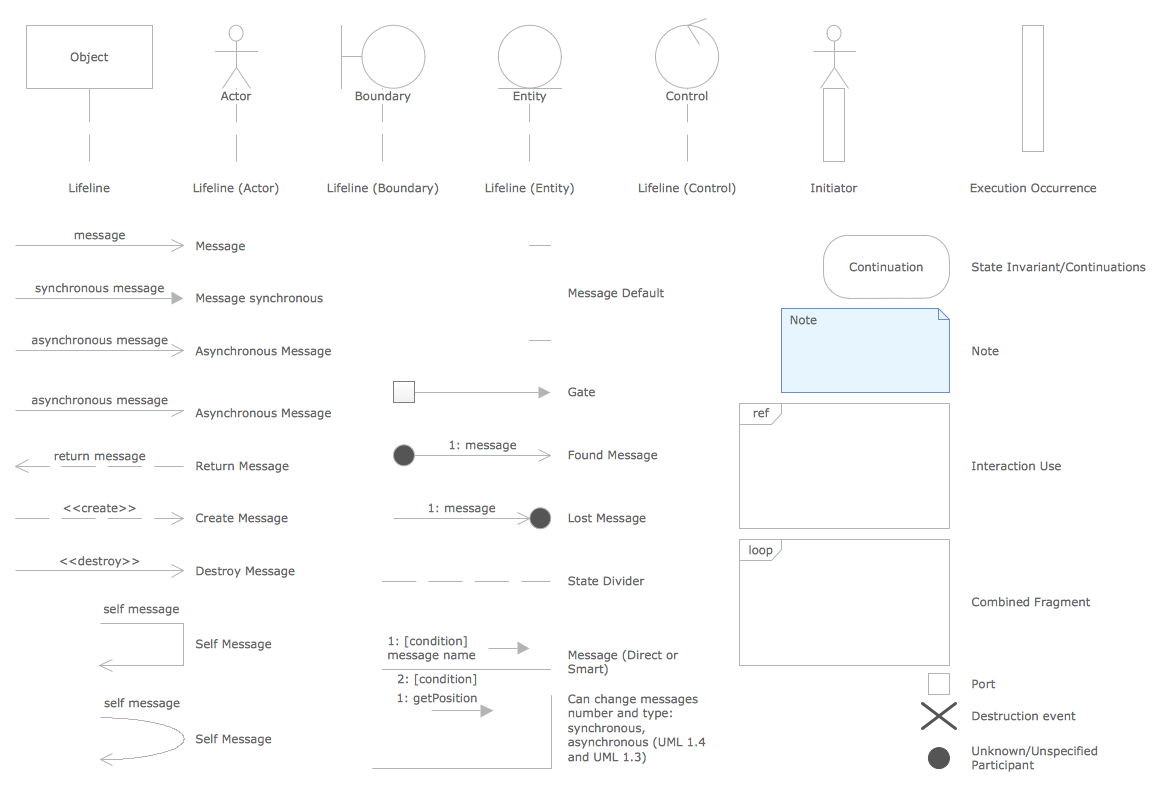
Example 2. Sequence Diagram Tool — UML Sequence Library Design Elements
Another way of your own sequence diagram creating is to use as the base already predesigned sequence diagrams included in Rapid UML solution and located in ConceptDraw STORE.
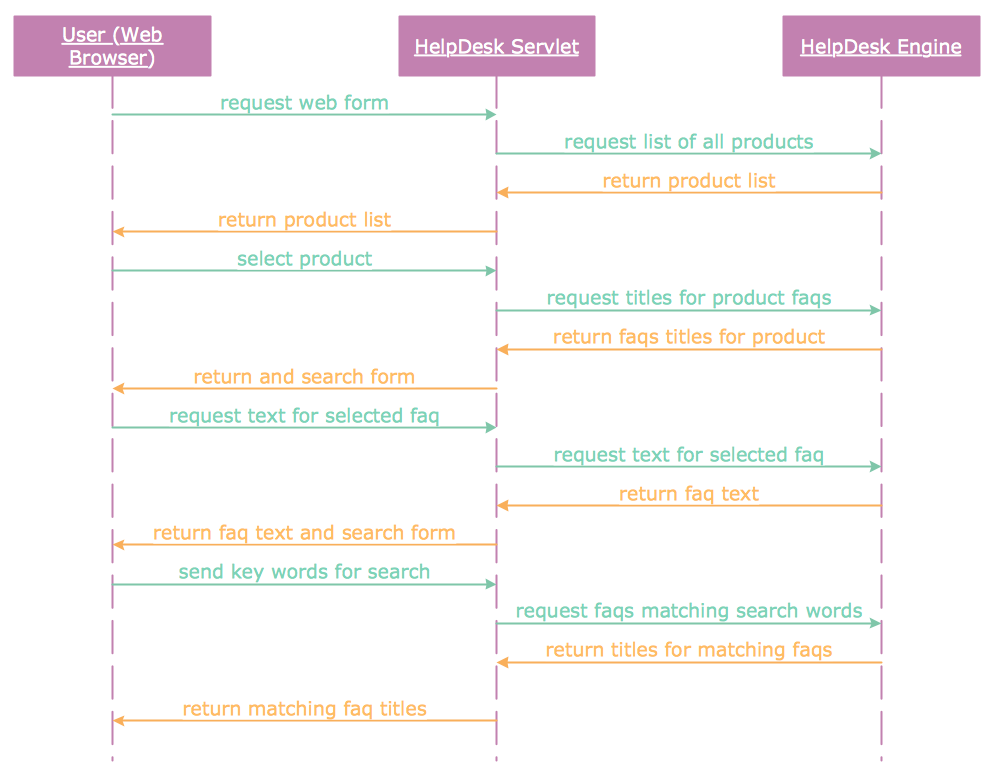
Example 3. UML Sequence Diagram — Checking Process
In the case of using the offered template or sample, you need to choose the most suitable for you from the set and change it according to your needs.
Example 4. UML Sequence Diagram — Help Desk
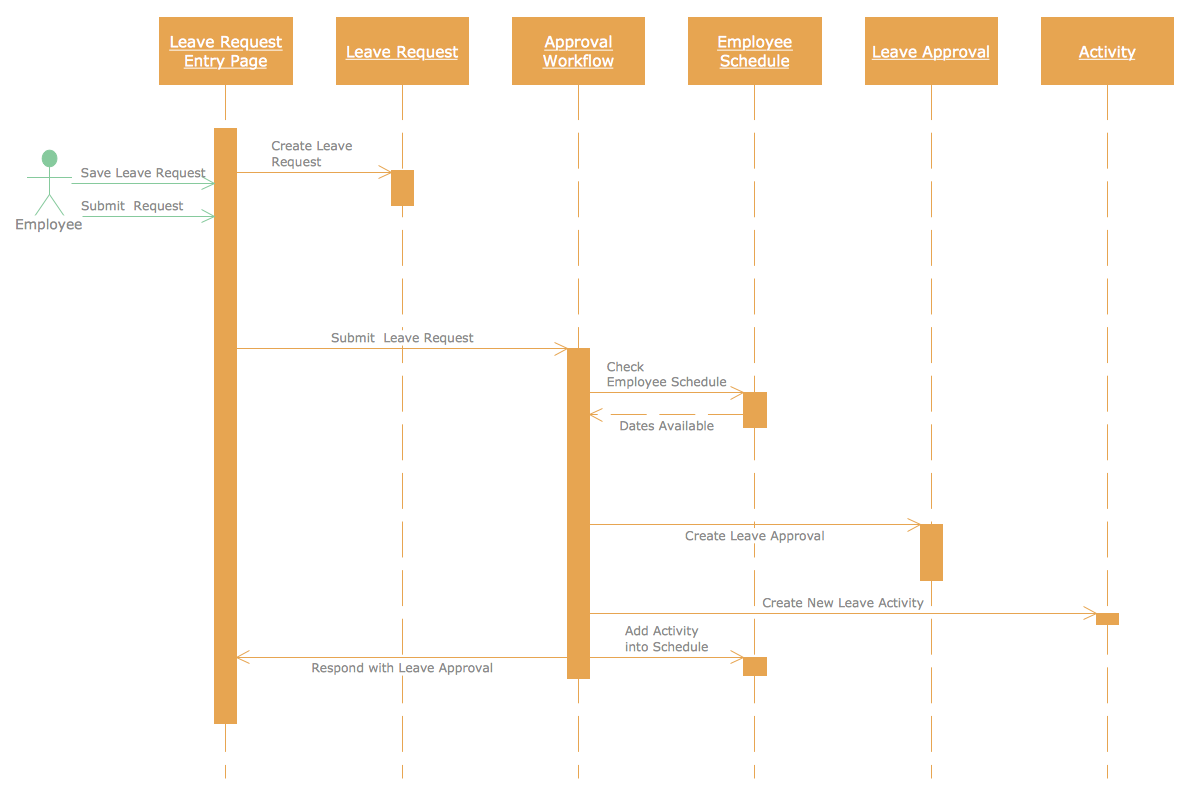
The Sequence diagrams you see on this page were created in ConceptDraw DIAGRAM using the vector objects from the UML Sequence library of Rapid UML Solution. An experienced user spent 10 minutes creating every of these samples. All these examples are available for ConceptDraw users from ConceptDraw STORE.
Use the Rapid UML solution to create your own UML diagrams of any type quick, easy and effective.
All source documents are vector graphic documents. They are available for reviewing, modifying, or converting to a variety of formats (PDF file, MS PowerPoint, MS Visio, and many other graphic formats) from the ConceptDraw STORE. The Rapid UML Solution is available for all ConceptDraw DIAGRAM or later users.