Draw Company Structure with Organization Charting Software
Company Structure Diagram gives the detailed information about the company structure and hierarchy - who execute what tasks and who is in charge at this company. This information shows the reasoning and success of business and is indispensable for investors and financial institutions.
ConceptDraw DIAGRAM is a powerful intelligent vector graphics engine that can be used for basic diagramming. Various flowcharts, block diagrams, histograms, pie charts, divided bar diagrams, line graphs, circular arrows diagrams, Venn diagrams, bubble diagrams and concept maps, and others can be generated with ease and then successfully used to visually communicate business and personal ideas and concepts, general structures and activities.
You need create Company Structure Diagram quick and easy? ConceptDraw DIAGRAM extended with Organizational Charts Solution from the Management Area has become the best Organization Charting Software that will help you effectively!
Sample 1. Organizational chart - New York State Education Department.
This sample was created in ConceptDraw DIAGRAM using the Organizational Charts Solution from the Management Area of ConceptDraw Solution Park and shows the organizational structure of New York State Education Department.
Use Organizational Charts solution for ConceptDraw DIAGRAM to create your own Company Structure Diagrams in minutes.
The Company Structure Diagrams designed with ConceptDraw DIAGRAM are vector graphic documents and are available for reviewing, modifying, converting to a variety of formats (image, HTML, PDF file, MS PowerPoint Presentation, Adobe Flash or MS Visio), printing and send via e-mail in one moment.
Creating diagrams and schemes is a pleasure with proper software. You don’t need any additional skills to create organizational chart quick and effectively with our diagramming tool. Create your ConceptDraw account today and start your diagramming experience.
This is the most regular type of organizational chart - hierarchical. It is created using the ConceptDraw Organizational Charts solution. Its composition can be displayed as a pyramid, with an only person in authority at the top, with sub-levels of management below them. According to hierarchy, an employee communicates only to his immediate head or subordinates. A hierarchical organizational structure may be choice for a businesses that work on multiform markets or any other organization that has a workflow requiring a multilevel structure of middle management.
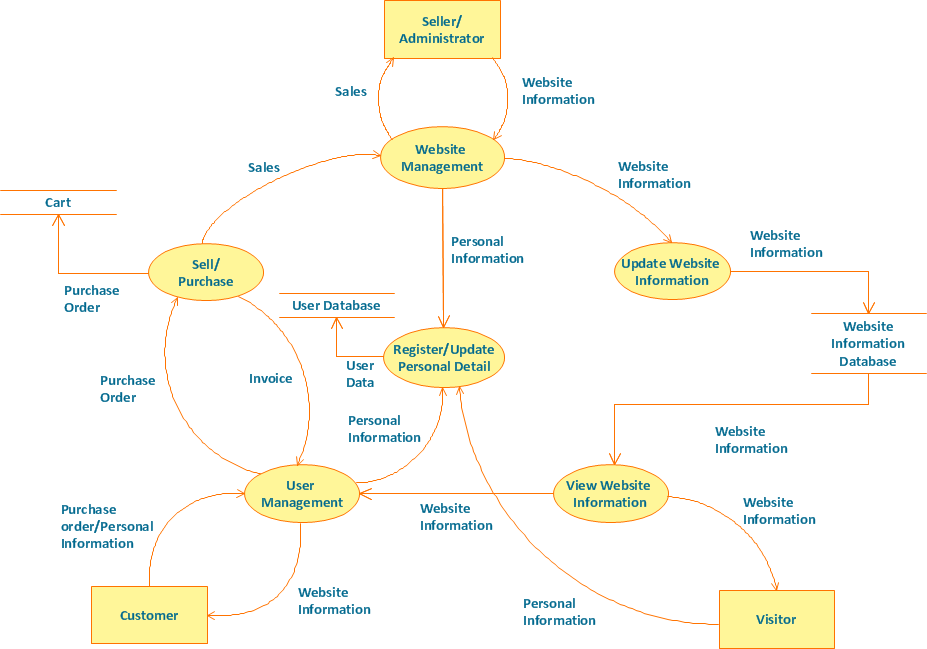
Structured-systems analysis and design method uses data flow diagrams to represent the process of data flowing through a system. Talking about this might be useless without a proper example of DFD for online store (Data Flow Diagram). This DFD example shows all the distinctness that a diagram can bring into a scattered data structure.
Data flow diagrams are used to show how data is processed within some business processes. Making DFD is a common practice for business process modeling and analysis. This diagram represents the online store business flow. It describes inputs and outputs within online selling process and depicts the interactions between its participants. This DF diagram can be used by system analysts to create an overview of a business, to study and discover its inherent strengths and weak points.
Picture: Example of DFD for Online Store (Data Flow Diagram)
ConceptDraw is your tool for driving social integration and managing change across and streamline social media processes of your organisation.This tool keeps the entire team on the same page allowing you to realize your social media strategy, improve the quality of your answers, and minimize the time it takes to respond.
Picture: Social Media Response Management DFD Charts - software tools
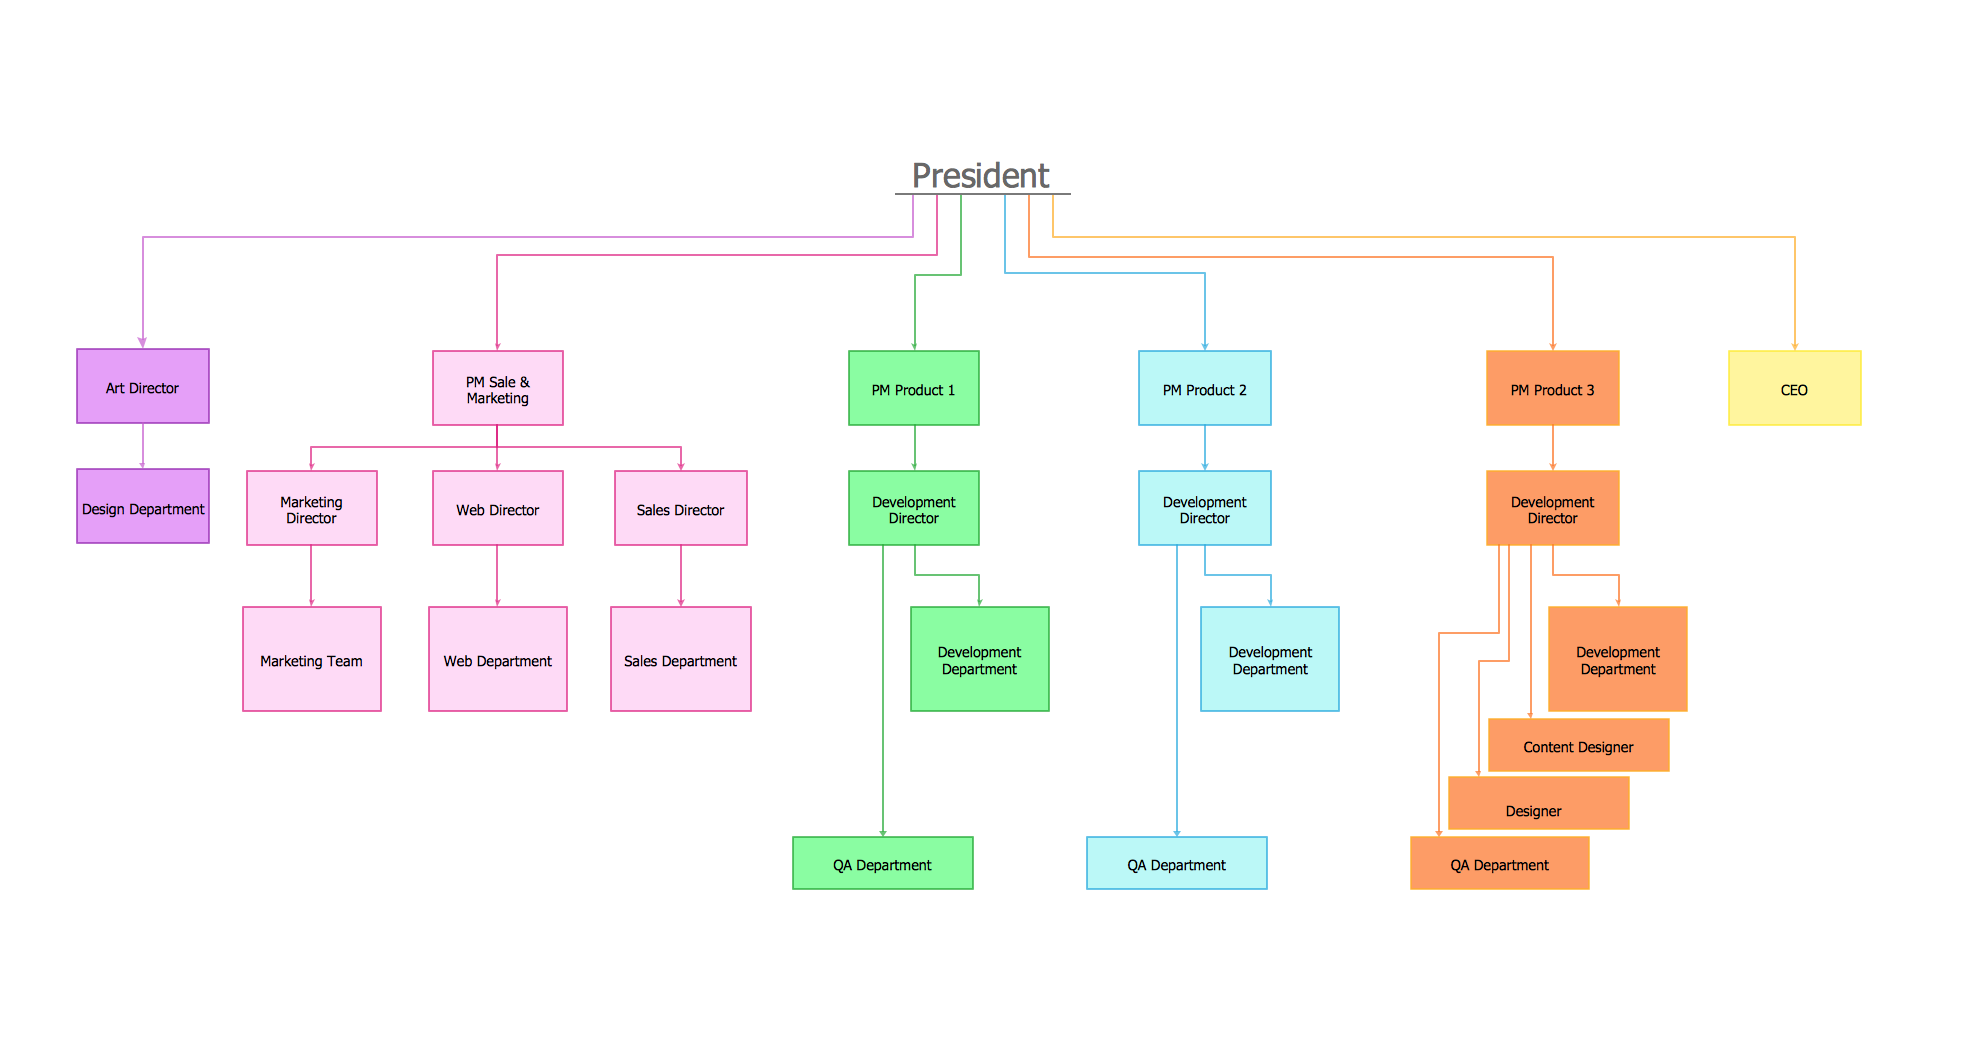
An orgchart shows how the responsibilities are divided between departments. It’s enough to have just one look on a proper organizational chart template to understand the idea and how it works. To understand how it’s made you should use a diagramming software.
This organizational diagram illustrates the possibilities of using ConceptDraw DIAGRAM to create orgcharts. This sample represents the common project management company. The chart shows the structure of devisions in the company, and the interaction between them. Communication between departments imply a certain structure affiliation and reporting. At the head of the company - President. This diagram was created using ConceptDraw solution for designing Organizational charts of any structure and complexity.
Working with information can be quite tedious, furthermore, some data can be quite difficult to perceive without any graphic representation. So, to facilitate your work, you can use business diagrams, such as simple flowcharts or Gantt charts for project management and orgcharts for clarifying your company structure. You can use a proper software, like ConceptDraw Pro, draw them on paper, or use whiteboards, but it is more convenient to use a digital tool.
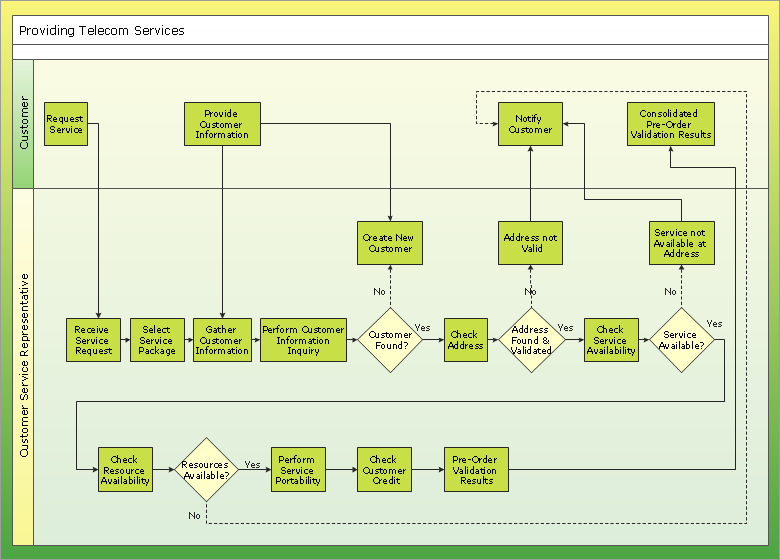
This diagram shows a cross-functional flowchart that was made fore telecom service provider. A workflow of a common telecommunication service provider has a rather branched structure. Thus, it is useful to have a flow chart to visualize the sequences and interrelations of the work flow steps. Business process flowchart contains 17 processes and 4 decision points,that are distributed through 2 lines depicting the participants involved. Also there are connectors that show the data flow within processes. This flowchart displays a detailed model of the telecom service trading process, as well as all participants in the process and how they interact with each other.
Picture: Business diagrams & Org Charts with ConceptDraw DIAGRAM
While creating flowcharts and process flow diagrams, you should use special objects to define different statements, so anyone aware of flowcharts can get your scheme right. There is a short and an extended list of basic flowchart symbols and their meaning. Basic flowchart symbols include terminator objects, rectangles for describing steps of a process, diamonds representing appearing conditions and questions and parallelograms to show incoming data.
This diagram gives a general review of the standard symbols that are used when creating flowcharts and process flow diagrams. The practice of using a set of standard flowchart symbols was admitted in order to make flowcharts and other process flow diagrams created by any person properly understandable by other people. The flowchart symbols depict different kinds of actions and phases in a process. The sequence of the actions, and the relationships between them are shown by special lines and arrows. There are a large number of flowchart symbols. Which of them can be used in the particular diagram depends on its type. For instance, some symbols used in data flow diagrams usually are not used in the process flowcharts. Business process system use exactly these flowchart symbols.
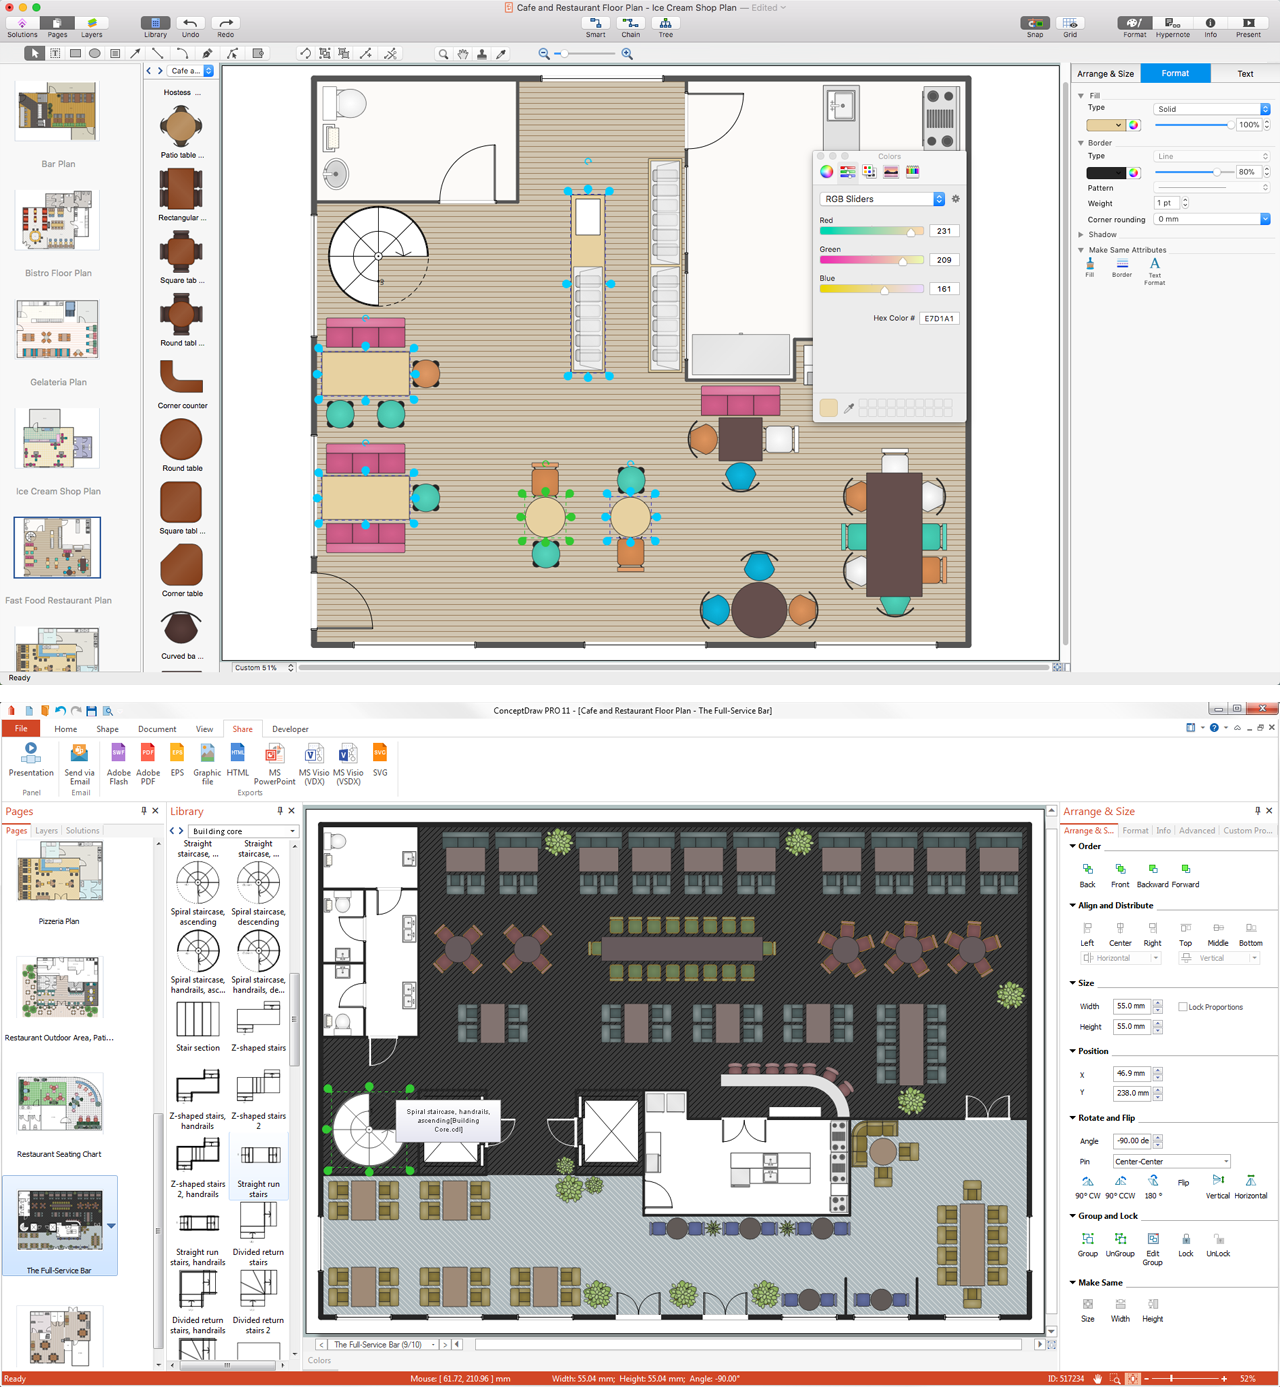
A family evening in a restaurant can be just charming, the problem is to find a one. If you spend an extra day to create a good restaurant floor plan, that will surely brings more clients. By the time your restaurant gets more popular, don’t forget about the quality of service.
The restaurant floor plan you see on this page was made with ConceptDraw DIAGRAM in accompanied with Cafe and Restaurant Plans solution. It introduces facilities of the solution and demonstrates the results, you can obtain if you deploy ConceptDraw tools for generating floor plans and interior designs for cafe, restaurants or other catering establishments. A little less than three hundred vector objects, and a set of built-in templates and a set of examples will maintain your creativeness.
UML Component for Bank - This sample was created in ConceptDraw DIAGRAM diagramming and vector drawing software using the UML Component Diagram library of the Rapid UML Solution from the Software Development area of ConceptDraw Solution Park