What is Spatial Analysis? Definition and Examples
“Spatial analysis or spatial statistics includes any of the formal techniques which study entities using their topological, geometric, or geographic properties. Spatial analysis includes a variety of techniques, many still in their early development, using different analytic approaches and applied in fields as diverse as astronomy, with its studies of the placement of galaxies in the cosmos, to chip fabrication engineering, with its use of 'place and route' algorithms to build complex wiring structures. In a more restricted sense, spatial analysis is the techniques applied to structures at the human scale, most notably in the analysis of geographic data.”[from Wikipedia]
ConceptDraw DIAGRAM drawing software extended with Pictorial Infographics Solution from the “Infographics” Area is the best for Spatial Data Analysis. You have a perfect possibility to make sure this right now.
Example 1. Spatial Data Analysis
It is impossible to imagine the Spatial Data Analysis without useful and effective tools. It's excellent news that ConceptDraw DIAGRAM software includes the Spatial Infographics Solution with large collection of libraries and variety of predesigned samples and templates to be filled in.
.png "Design Elements Continental Map")
.png "Design Elements Location Map")
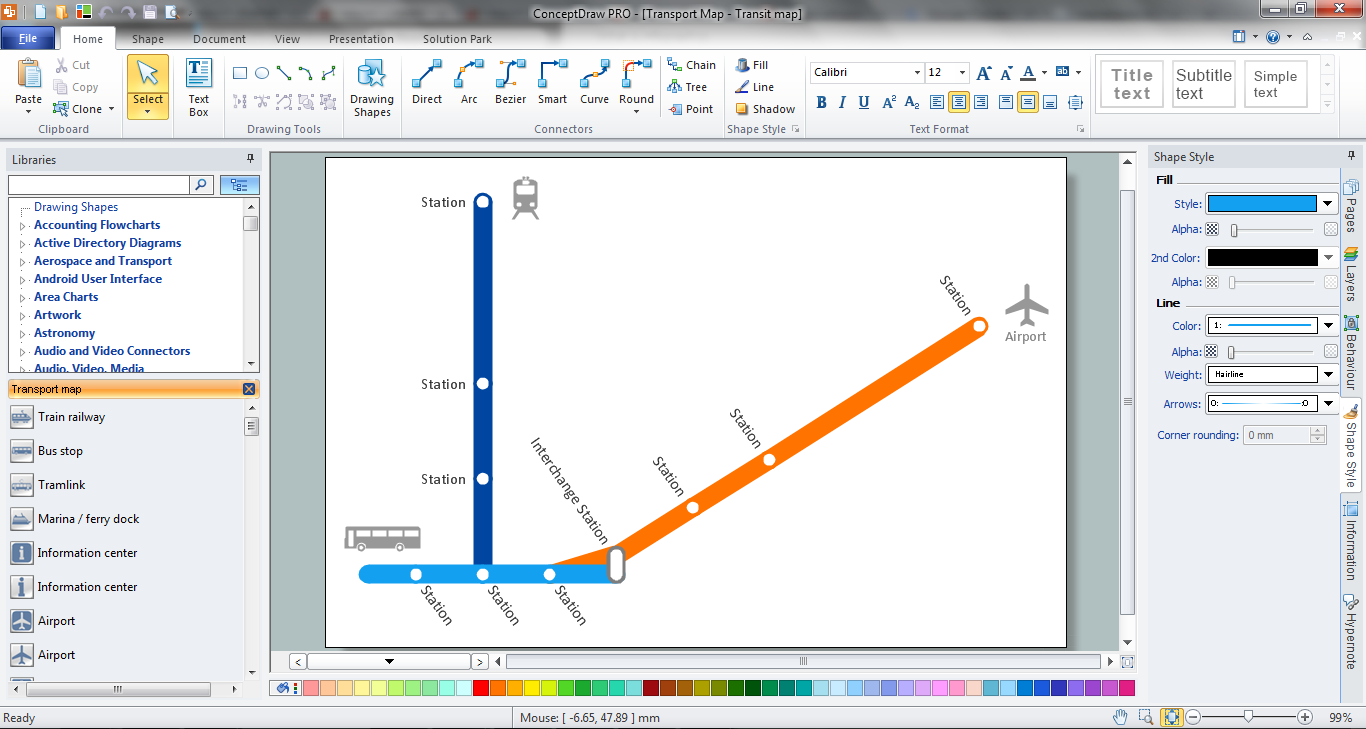
.png "Design Elements Transport Map")
9 libraries from the Spatial Infographics Solution include 387 vector stencils for drawing spatial infographics in minutes.

Example 2. Spatial Infographics Solution in ConceptDraw STORE
You can create your Spatial Infographics from the beginning using the shapes from the libraries of Spatial Infographics Solution, or use one the predesigned templates and samples offered in ConceptDraw STORE.

Example 3. Spatial Infographics - The 100th Tour De France
The Spatial Infographics samples you see on this page were created in ConceptDraw DIAGRAM software using the tools of the Spatial Infographics Solution from the “Infographics” Area. They successfully demonstrate solution's capabilities and professional results you can achieve using it.
Use the Spatial Infographics Solution for ConceptDraw DIAGRAM Solution Park for effective spatial data analysis.
All source documents are vector graphic documents. They are available for reviewing, modifying, or converting to a variety of formats (PDF file, MS PowerPoint, MS Visio, and many other graphic formats) from the ConceptDraw STORE. The Spatial Infographics Solution is available for all ConceptDraw DIAGRAM or later users.