Steps of Accounting Cycle
The accounting cycle is a complex process that consists of a set of steps occurred in the accounting period. It is called a cycle because the accounting workflow is circular: after execution one accounting period consisting of a sequence of steps of accounting cycle, starts the next accounting period.
The steps of accounting cycle include the processes of identifying, collecting, analyzing documents, recording transactions, classifying, summarizing, posting, and preparing trial balance, making journal entries, closing the books and final reporting financial information of an organization.

Sample 1. Steps of Accounting Cycle
The execution of the eight basic steps of accounting cycle leads to success work of your organization.
ConceptDraw DIAGRAM diagramming and vector drawing software extended with Accounting Flowcharts Solution provides the Accounting Flowcharts library with predesigned vector shapes, variety of templates and samples to help you easily show the steps of accounting cycle and quickly design the accounting flowcharts.
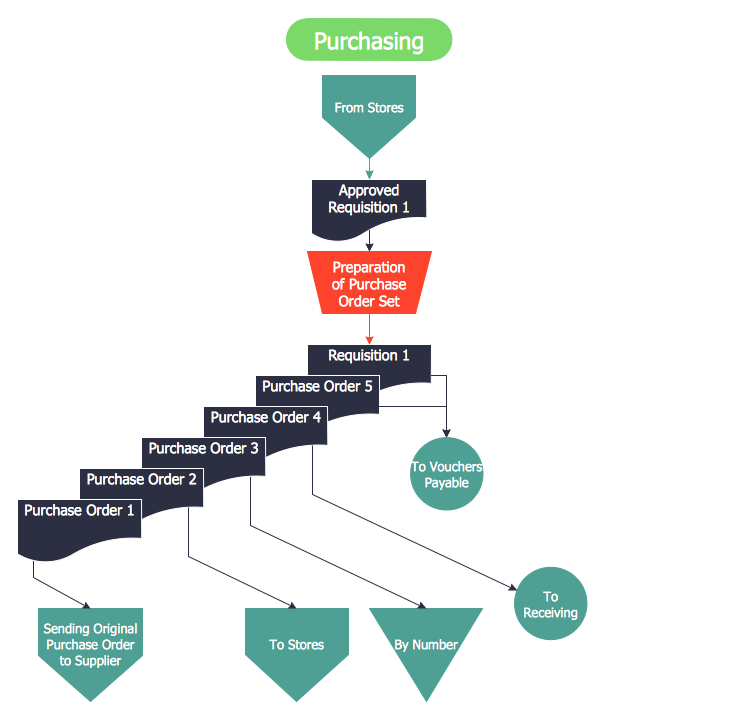
Sample 2. Accounting Flowcharts – Purchasing Flowchart
This sample was created in ConceptDraw DIAGRAM using the Accounting Flowcharts library from the Accounting Flowcharts Solution and shows the purchasing process flow. An experienced user spent 10 minutes creating this sample.
Use the ConceptDraw DIAGRAM with Accounting Flowcharts Solution to create your own professional Accounting Flowcharts of any complexity quick and easy.
The Accounting Flowcharts produced with ConceptDraw DIAGRAM are vector graphic documents and are available for reviewing, modifying, and converting to a variety of formats (image, HTML, PDF file, MS PowerPoint Presentation, Adobe Flash or MS Visio).
NINE RELATED HOW TO's:
Create flowcharts, org charts, shipping flowcharts, floor plans, business diagrams and more with ConceptDraw. Includes 1000s of professional-looking business templates that you can modify and make your own.
Picture: Basic Diagramming
Related Solution:
Create professional business process diagrams using ConceptDraw Activities library with 34 objects from BPMN.
Picture: Business Process Model and Notation Elements: Activities
When we start to speak about databases, we must always mention database structure visualization. One of the most common ways to do it is to create an entity relationship diagram, and to put appropriate symbols on it. It is important either for database projecting and for its' future maintenance.
Entity Relationship Diagram describes data elements and their relationships within a database. There are a set of special symbols that depict each element of an entity relationship diagram. Entities - represents some stable components such as supplier, employee, invoice, client, etc. Relation symbols show how the entities interact. Attributes define characteristics of the relationships. Attributes can be one-to-one or many-to-many. Physical symbols is used in the physical models. They represent items such as fields, tables, types and keys. ERD physical symbols are the building material for the database. Notation lines are used to illustrate the relationships. The most common method is Crow’s Feet notation. You can use ConceptDraw Entity-Relationship Diagram (ERD) solution to represent a database using the Entity-Relationship model.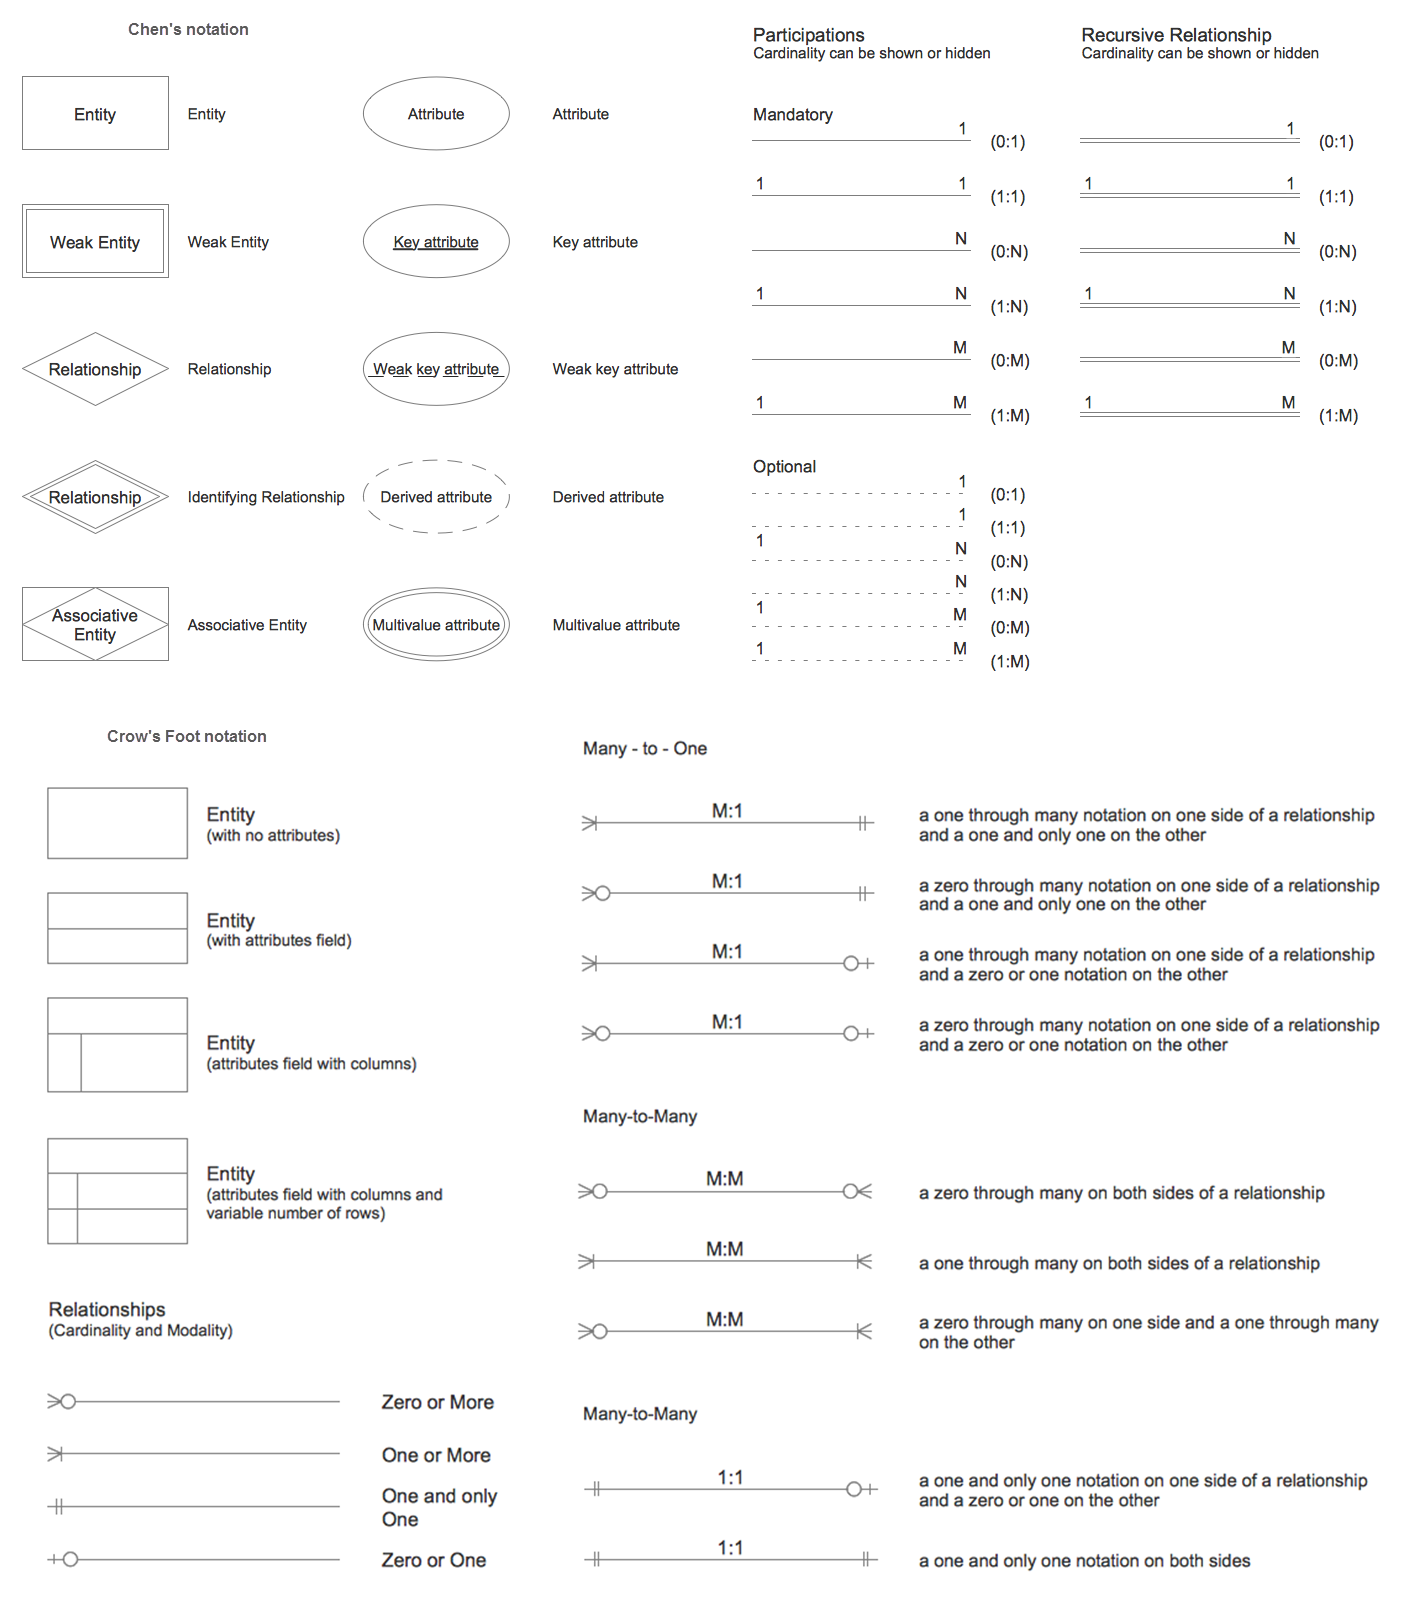
Picture: Entity Relationship Diagram Symbols
Related Solution:
Flow chart is a diagrammatic representation of an algorithm and essential part of planning the system. Flow charts are widely used in technical analysis and programming for easy writing programs and explaining them to others. So, one of the most popular type of flow charts is Technical Flow Chart.
Technical Flow Chart can be drawn by pencil on the paper, but it will be easier to use for designing a special software. ConceptDraw DIAGRAM diagramming and vector drawing software extended with Flowcharts Solution from the Diagrams Area of ConceptDraw Solution Park will be useful for this goal.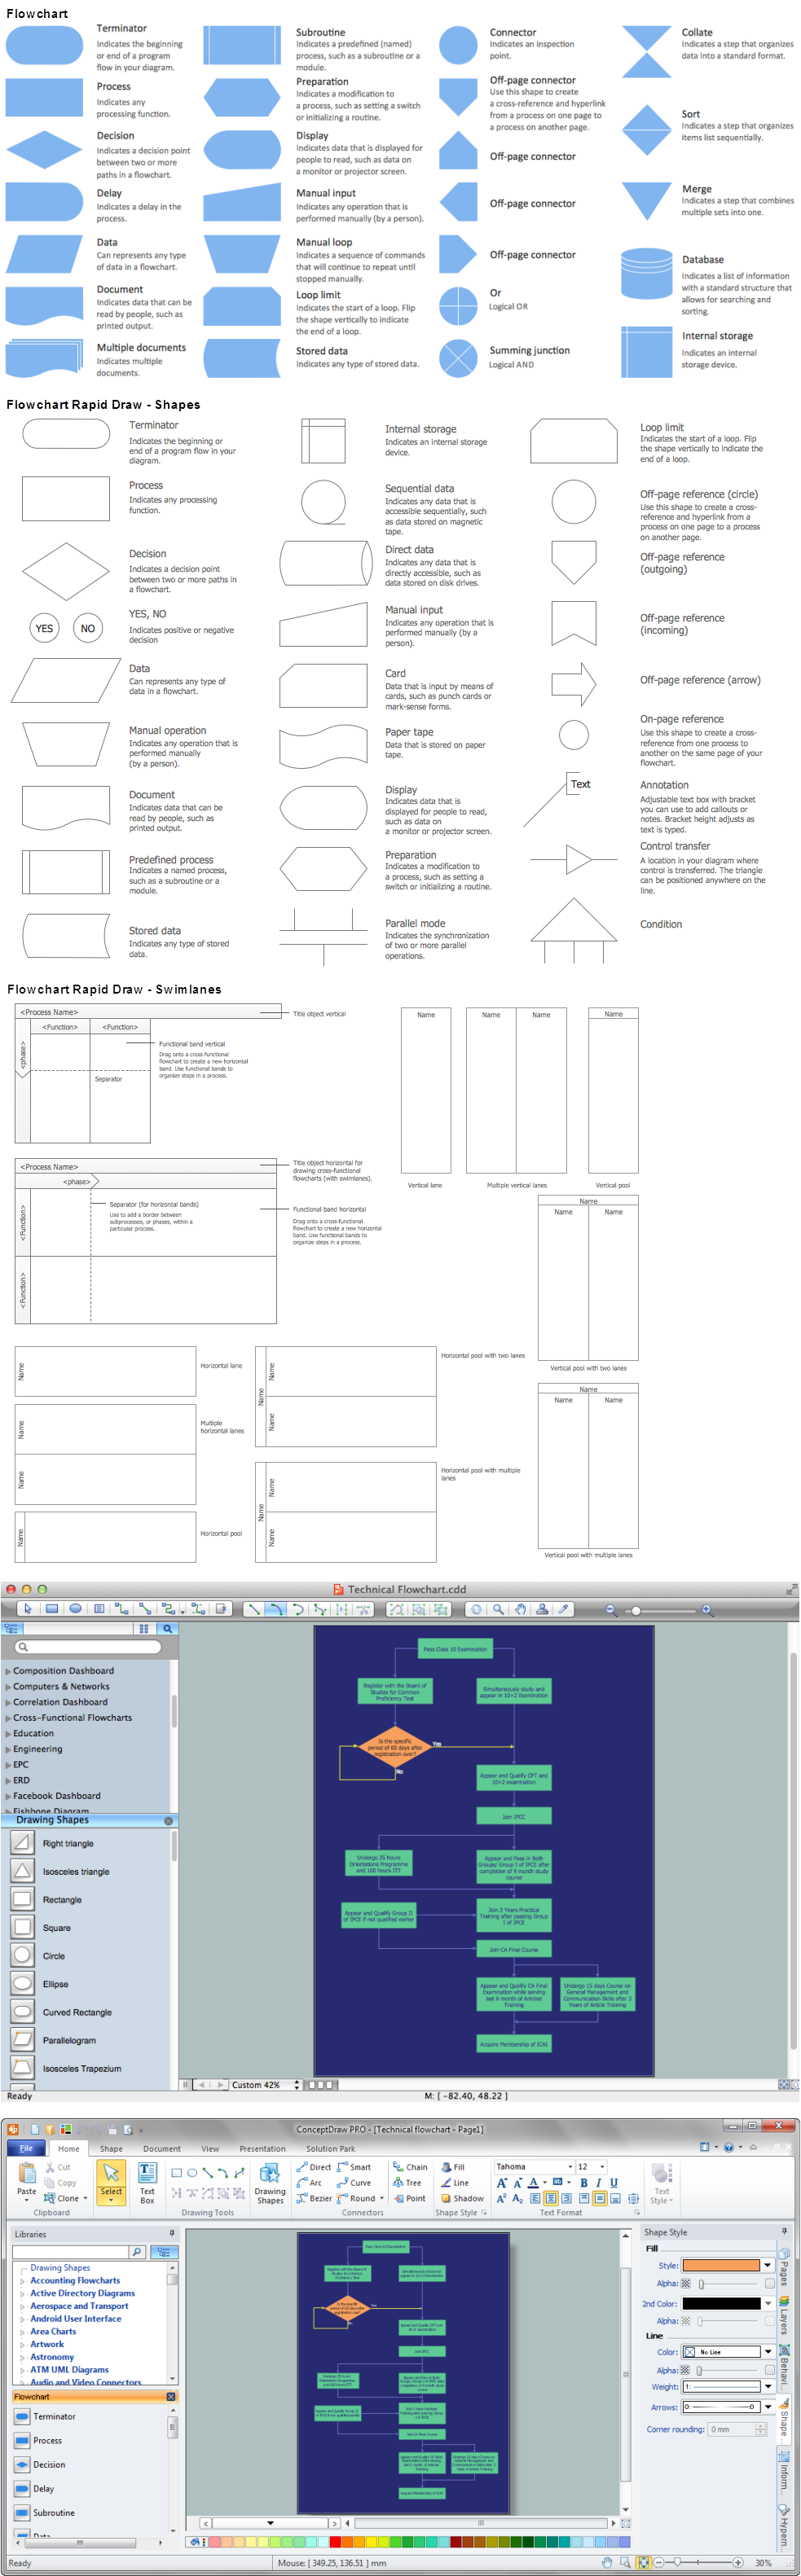
Picture: Technical Flow Chart
Related Solution:
Internal auditing is an independent, objective assurance and consulting activity designed to add value and improve an organization's operations.
ConceptDraw DIAGRAM diagramming and vector drawing software extended with Audit Flowcharts solution from the Finance and Accounting area perfectly suits for the Internal Audit Process. You can make sure this right now!
Picture: Internal Audit Process
Related Solution:
This sample shows the Flowchart that displays the layout and work flow of the cloud marketing platform. This diagram has a style of the marketing brochure. This style displays the central product that is related to the other issues.
Using the ready-to-use predesigned objects, samples and templates from the Flowcharts Solution for ConceptDraw DIAGRAM you can create your own professional looking Flowchart Diagrams quick and easy.
Picture: Flowchart Marketing Process. Flowchart Examples
Related Solution:
ConceptDraw Pyramid Diagram software allows drawing column charts using predesigned objects or drawing tools. In ConceptDraw Pyramid Diagram software you can find a complete set of column chart tools and objects.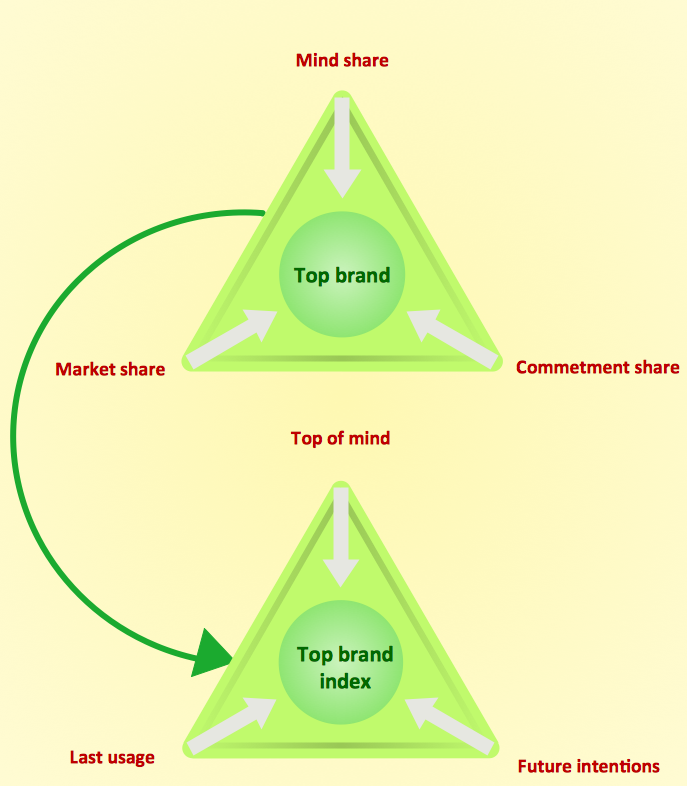
Picture: How to Create a Pyramid Diagram
Related Solutions:
Definition, examples, layout options, best practices, and common mistakes for cross functional flowcharts (swimlane diagrams).
Picture: Cross Functional Flowchart (Swimlane Diagram): Definition, Structure, Examples, and How to Create
Related Solution:
ConceptDraw Mind maps can be used to depict a quality process.
Picture: Helpful in all stages of quality management
Related Solution:
