Total Quality Management Business Diagram
In case it is needed for you to create a total quality management business diagram, then you can always do it using ConceptDraw DIAGRAM software, as well as the Fishbone Diagram Solution from ConceptDraw STORE application.
Total quality management is the one consisting of the organization-wide efforts in order to install and to make permanent a climate in which an organization may get the chance to continuously improve its ability to deliver the high-quality services and products to its customers. Such efforts are one of the part of the developed techniques and tools of the quality control. The quality control itself is a process by which the entities review the quality of all the factors which are involved in production, being a part of the quality management focused on fulfilling different quality requirements in order to fit them and so to satisfy the clients of some particular organization.
The approach of the quality control focuses on the three well-known aspects, which are elements (job management, controls, defined and well managed processes, identification of records and performance and integrity criteria), competence (knowledge, experience, qualifications and skills) and soft elements (integrity, personnel, confidence, motivation, organizational culture, quality relationships and team spirit).
Controls may include the process of product inspection, in which every product can be examined in a visual way. The inspectors are known to be usually provided with descriptions and lists of the unacceptable product defects such as surface blemishes or cracks. In case any of the mentioned three aspects is deficient in any way, then the quality of the outputs may be put at a risk.
To be able to track if all the aspects are taken into consideration, it is important to mention all the needed information in a way of a drawing, such as a diagram, for example. Having a good looking as well as smart looking diagram with help of which it is possible to illustrate the total quality management business processes, you can always make the needed changes on time, such as to pay more attention to some particular aspects. The way the total quality management business diagram may look like can be the way of Ishikawa diagram is.
“Ishikawa” diagrams are known to be the causal diagrams, which were invented by Kaoru Ishikawa used to show the causes of some specific event and since then (since 1968) they have been very popular in quality defect prevention as well as the product designing. They can be used for identifying the potential factors causing some unexpected overall effect, when each of the causes for imperfection is a source of variation. The causes are usually grouped into the bigger categories to simplify their identification and classification of the sources of variation.
The “effect” within the “cause-and-effect” diagram is shown in a way of a fish's head, which usually faces to the right. At the same time, the “causes” all extend to the left in a way of this “fish’s bones”. The ribs branch off the backbone for the main causes, having the sub-branches for root-causes to the levels you can always mention on your diagram for as many as you want them to be there. The quality management processes can be easily simplified with the use of the “fishbone” diagrams, which are also widely used in the modern management. A “fish skeleton” is one of the structures to be used for a purpose of representing the needed data. Such diagrams can be also used in the “root-cause analysis”, which use’s intended to reveal the key relationships among different variables.
The causes within the mentioned analysis can provide another insight in the process behaviour. This behaviour can be simply illustrated within one diagram — “fishbone” one. On this diagram, you can group the needed causes into categories on the main branches off the “fishbone”. Within the “root-cause analysis” the categories for the “Ishikawa diagram” can be used to identify the crucial attributes, which are used for planning in such sphere of the business activity, such as “product marketing”. The elements used within one of the fishbone diagrams can be “product” (“service”), “promotion”, “price”, “place”, “process”, “physical evidence”, “performance” or “people”.
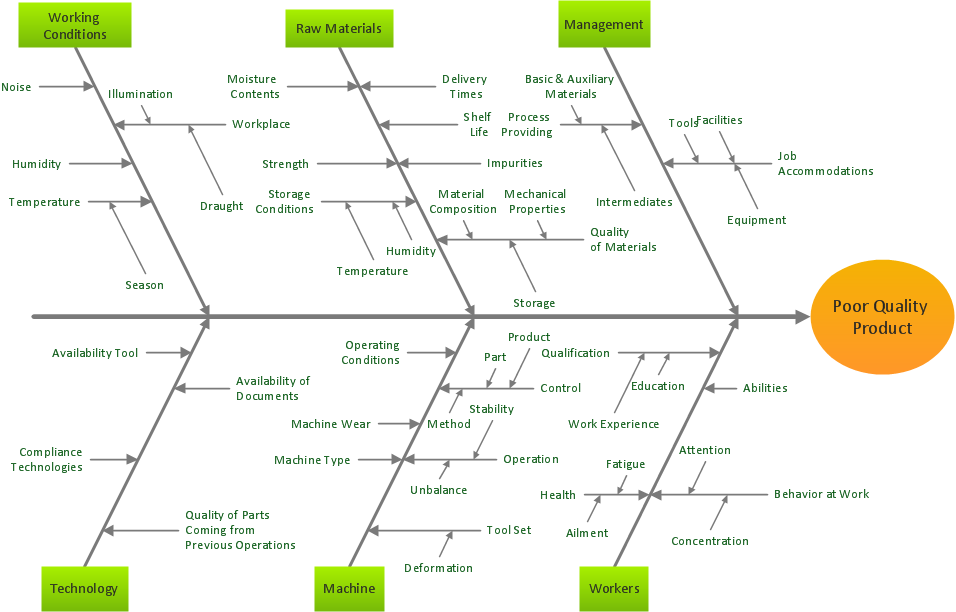
Pic.1 Fishbone diagram — Total Quality Management Business Diagram
The four existing categories of possible cause are “surroundings”, “systems”, “skills” and “suppliers”, all of which can be illustrated within one diagram — fishbone one. Using ConceptDraw DIAGRAM software and the Fishbone diagram solution can simplify your work of designing the needed diagram, including the mentioned “fishbone” one, as well as the other ones, included in the quality control activity. There was a new application developed especially for all ConceptDraw DIAGRAM users to simplify their work with drawing the needed schematics — the ConceptDraw STORE.
This new product of CS Odessa can be very useful for those who want to save their time (not to waste on making the diagrams from a scratch) and so money (not to pay to the professional designers to do such job for them). Getting the needed solutions almost guarantees the result to be professionally looking. Using any of the available tools from such solution, as Fishbone Diagram one, you can create the needed diagrams, including the fish-bone ones.
Providing the needed tools, such as the previously made samples of the fishbone diagrams as well as the stencil libraries full of design symbols, developed by the specialists of CS Odessa in order to simplify all the ConceptDraw DIAGRAM users’ work with creating the diagrams, CS Odessa team members do their best to make it possible for all ConceptDraw DIAGRAM users to feel as if they all were the specialists, such as the designers, in drawing the needed schematics even if they do not have as much experience at all. Trying the Fishbone Diagram solution means almost ensuring yourself in being able to create a professionally looking diagrams, such as the total quality management business one, any time you need them within a short period of time.
TEN RELATED HOW TO's:
The Ishikawa diagram, Cause and Effect diagram, Fishbone diagram — all they are the names of one and the same visual method for working with causal connections. Originally invented by Kaoru Ishikawa to control the process quality, the Ishikawa diagram is well proven in other fields of management and personal scheduling, events planning, time management. It is a chart in the form of a fish, whose head is a problem, the fins are variants for its causes.
To design easily the Fishbone diagram, you can use a special ConceptDraw DIAGRAM vector graphic and diagramming software which contains the powerful tools for Fishbone diagram problem solving offered by Fishbone Diagrams solution for the Management area of ConceptDraw Solution Park.
Picture: Fishbone Diagram Problem Solving
Related Solution:
Collaboration tool for project management enables you to give a new role to knowledge management and document sharing within your team.
Picture: How To Use Collaboration Tool in Project Management
Related Solution:
Everything about Bookkeeping: Accounting flowchart process. Which symbols to use, how to make a chart.
Picture: Introduction to bookkeeping: Accounting flowchart process
Related Solution:
Accounting is a cornerstone of any business, it’s basement. If you want to have a visual representation of your finance management, use audit flowchart symbols to document the money flow. Although some would say that accounting is boring, it is very a responsible duty.
The audit flowchart symbols is supplied with ConceptDraw Audit Flowcharts solution as a vector objects library. Together with Conceptdraw Drawing capabilities it forms the helpful tool for audit process planning and setting the steps of audit by designing audit flow charts. Audit Flow charts are used to organize fiscal information tracking process as well as in accounting, finance and investment management.
Picture: Audit Flowchart Symbols
Related Solution:
Systems Modeling Language (SysML) is a general-purpose modeling language for systems engineering applications.
ConceptDraw DIAGRAM diagramming and vector drawing software was extended with SysML Solution from the Software Development Area of ConceptDraw Solution Park specially to help systems engineers design various model systems with SysML.
Picture: SysML
Related Solution:
Use Case Diagrams technology. An effective management of changes is significantly facilitated by way of definition and documenting of business-requirements.
Picture: IDEF9 Standard
ConceptDraw - Organigram software allows quickly create Organigrams and much more. ConceptDraw DIAGRAM is an ideal tool for Administrative staff to clearly demonstrate the company orgchart professional.
Picture: Organigrams with ConceptDraw DIAGRAM
Related Solution:
A circuit diagram is sometimes also called an elementary diagram, electronic schematic or electrical diagram circuits. It is essential in construction of any electronic equipment. Among many digital drawing tools available, ConceptDraw DIAGRAM is a leading circuits and logic diagram software, affording for easy and quick creation of even the most advanced and complex diagram designs. This makes it a perfect choice for computer science and any kind of electronic engineering.
This drawing includes the graphic symbols that may be in use while creating a logic circuit diagram. The diagrams of such kind are used in the electronics industry. The logic symbol depicts a device that realizes a Boolean type functions. Practically a logic symbol means transistor, diodes, relays, and other mechanical or optical details which provide function of closing or opening "gates". Totally the logic circuits can involve millions of gates. ConceptDraw Electrical Engineering solution gives the opportunity to create a circuit diagrams both simple and difficult.
Picture: Circuits and Logic Diagram Software
Related Solution:
A flowchart is a powerful tool for examining processes. It helps improving processes a lot, as it becomes much easier to communicate between involved people, to identify potential problems and to optimize workflow. There are flowcharts of different shapes, sizes and types of flowchart vary from quite basic process flowcharts to complex program flowcharts. Nevertheless, all these diagrams use the same set of special symbols like arrows to connect blocks, parallelogram to show data receiving or rectangles for showing process steps.
Basic flowcharts are used to represent a simple process algorithm. A basic flowchart notation consists of rectangles (business processes), arrows (the flow of information, documents, etc.). The same notation is used in items such as the "decision", which allow you to do the branching. To indicate the start of the entire business process and its termination can be used the "Terminator" element. The advantages of Basic Flowchart are simplicity and clarity. With it you can quickly describe the business process steps. Creating of Basic Flowchart does not require any special knowledge, as easily understand by employees with different levels of education and IQ.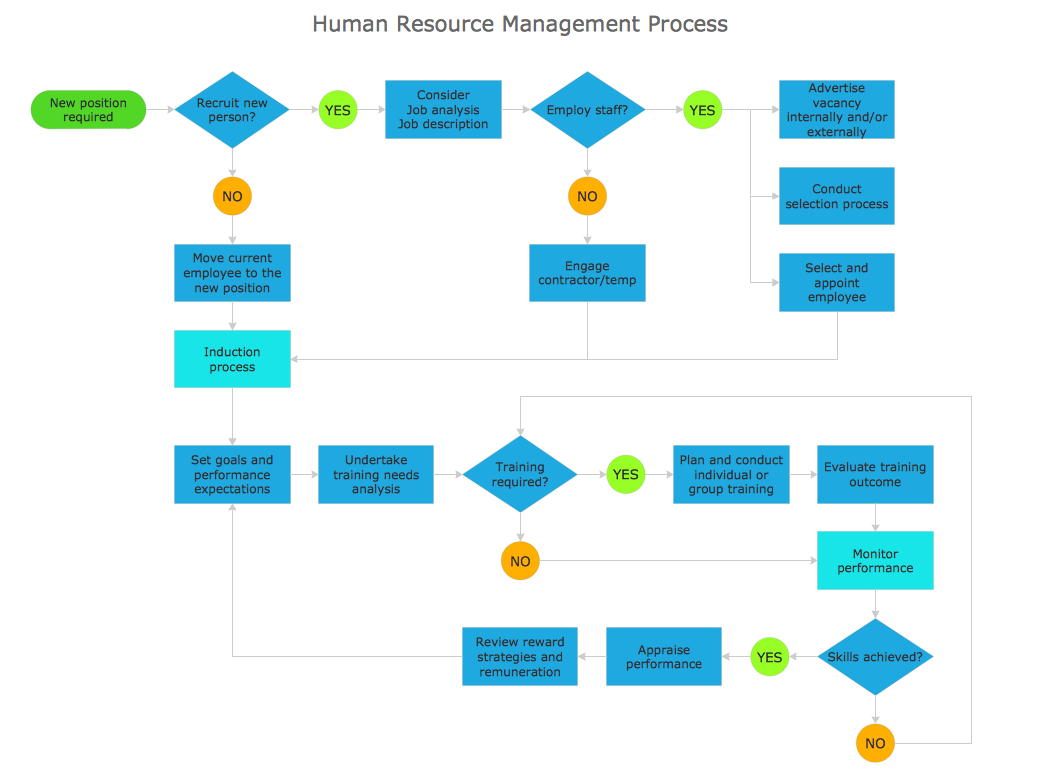
Picture: Types of Flowchart: Comprehensive Overview
Related Solution:
If you ever wanted to try any diagramming tools except of Visio, but were afraid to lose existing documents, there’s good news for you. One of the most striking features of ConceptDraw DIAGRAM is it’s perfect compatibility with MS Visio, which guarantees that you won’t depend on operating system anymore, because another ConceptDraw DIAGRAM feature is that it’s cross-platform tool. Don’t waste your time looking for other options, you’ve found the solution already!
Business professionals often utilize the MS Visio as a common tool for making various issues on business visualization. MS Visio is a strong software with good capacity to maintain complex business solutions. But there is no MS Visio for Apple OS X. This is a large invocation, and one would be pleased to recognize that ConceptDraw DIAGRAM is the ideal alternative to MS Visio. Primarily, because this software works natively on both Windows and Apple OS X platforms. if you have migrated from Windows to Mac, or need to communicate in a cross-platform conditions, you’ll search for MS Visio replacer. ConceptDraw DIAGRAM is the exclusive professional business diagramming application that runs on both Windows and Apple OS X. The opportunity exchange files between PC and Mac, as well as between ConceptDraw DIAGRAM and Visio is the significant advantage that permits you to display and to collaborate business information in effortless and cost-effective way.
Picture: ConceptDraw DIAGRAM Compatibility with MS Visio