Types of Flowchart: Comprehensive Overview
There are many different types of Flowcharts existing, as well as many applications for making these Flowcharts in almost every imaginable field from business processes to cooking recipes. In addition, there are many special software tools, using which you can design a Flow Chart simply and fast, which is a great advantage since you can spend your time more efficiently. But the one application, which is ConceptDraw DIAGRAM, is multifunctional, it helps to design Flowcharts of multifarious types and make your final result after drawing for just a couple of minutes look truly unique and smart as well as professional.
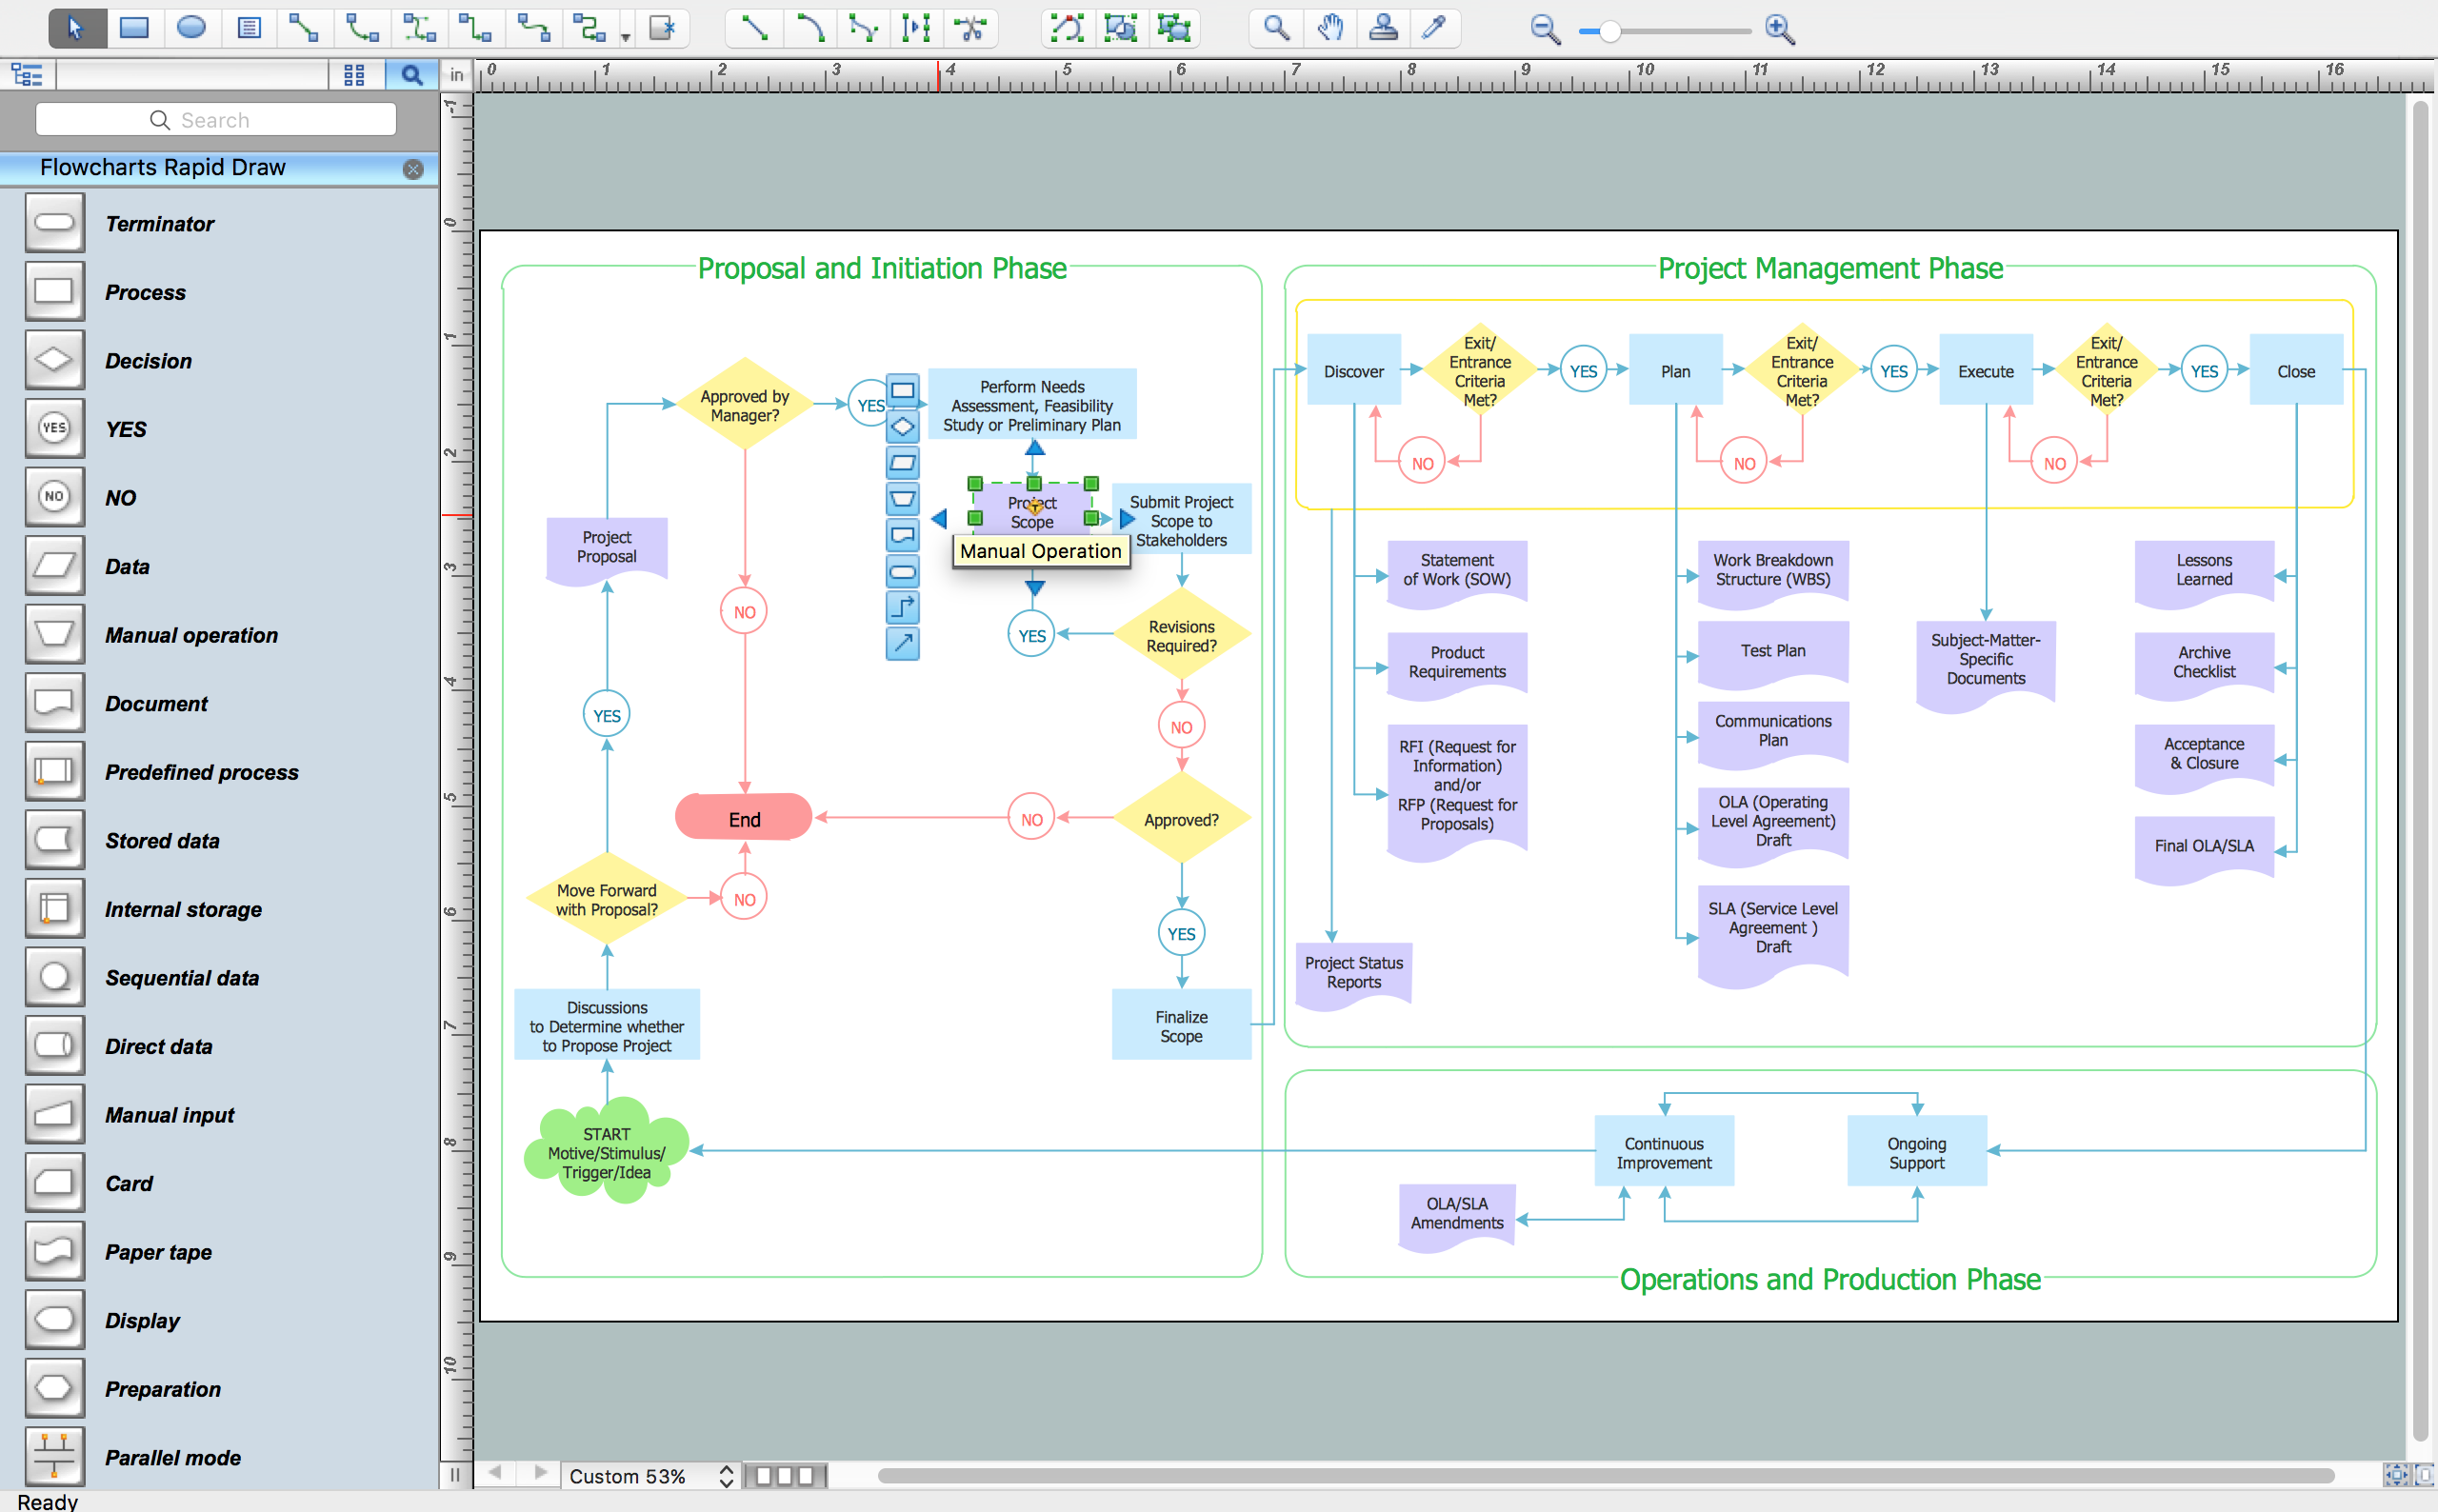
ConceptDraw DIAGRAM software defines a set of flowchart diagram types, divided into categories. Every flowchart type has specific shapes and ConceptDraw's solutions including the Flowcharts solution provide the professional tools for drawing any of them. Whether you need to show the relationship between some business process and responsible people for managing it correctly, structure the departments, or improve your productivity, ConceptDraw DIAGRAM is always available for you as it was created especially for such purposes. And nowadays, a really large number of flow diagram types can be made using this software.
Creating a flow chart nicely looking is simple with the help of pre-made examples and layouts which are an important part of the extension called Solution Park. The solutions from the ConceptDraw Solution Park offer many kinds of examples and templates for making any kind of needed Flowcharts. They also provide all necessary design symbols and elements, which you can use depending on what exactly you need to create. These include the design elements for making different flowcharts, diagrams, charts, plans, and schemes including:
- Basic Flowchart
- Process Flow Chart
- Procedure Flowchart
- Data Flow Diagram
- IDEF Flowchart
- SDL Diagram
- Sales Charts
- Workflow Diagram
- Value Stream Mapping
- Cross-Functional Flowchart
- Business Process Modeling Diagram
- System Flowchart

Flowchart Drawing: Important Tips
When describing a process or writing a manual, you should try just for once, not to write a long paragraph of complicated text, but to draw an illustrative diagram, which can be more explanative. There are a few tips, which help to create understandable Flowcharts. First, you need to keep in mind that Flowcharts have to be easy to follow, so order your shapes in a logical order and use unambiguous instructions. Choose one direction for the flow of the elements on your diagram: from left to right or from the top of the document to the bottom. If your Flowchart gets complex, use connectors to reduce the quantity of flow lines. You can also add a circular node and move a part of the Flowchart to the next page to make your diagram look more tidy.
Remember, the more neat and orderly your Flowchart is, the more users will thank you for that. To avoid a visual mess, keep three things in your mind: scale, proportion, and space. Save an equal space around the elements of your Flowcharts, so that your document would be easy to read. Keep the size of the objects proportional to the text written in them and to the rest of the objects in the Flow diagram. Be sure to use appropriate symbols for different cases to avoid mistakes and inconveniences. To have an easy start with developing Flowcharts, take a look at the examples listed below.
Should a business or government agency need to show a solution model for some purpose of their activity, a resulting diagram will take the form of a Flowchart. Flowcharts are an irreplaceable tool when charting a business process — they give you the opportunity to picture and understand the process and serve to highlight any issues or bottlenecks that might cause threats in the workflow.
Draw your own sales processes, information flow charts, business process automation or re-engineering schematics, use ConceptDraw DIAGRAM application in accounting, management, or human resources management, and feel the difference to if you made boring reports with no charts. To trace documentation movement such as payroll information or interoffice mails, to show the relation between major parts of same system or systems, to picture and understand the process of making goods or services, to describe efficiency or manage the transport logistics — Flowcharts are the best solution for that and the best software for making them is ConceptDraw DIAGRAM. Try it and you’ll be satisfied!
Basic Flowchart
is often used to define and document basic work and data flows, financial, production, and quality management processes to increase the efficiency of your business.
Business Process Modeling Diagram
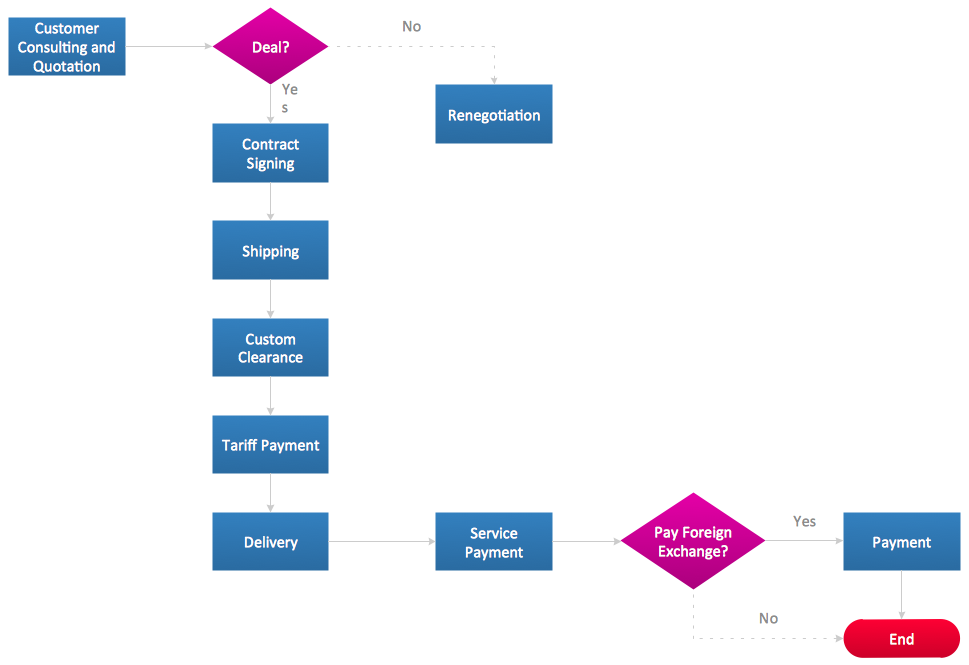
is a graphical representation for specifying business processes in a workflow.
Process Flowchart
is also known as the system flow diagram or SFD. The main reason for using a Process Flowchart is to show the relation between major parts of the system. A Process Flow Diagram may present a range of symbols that represent different appliances.
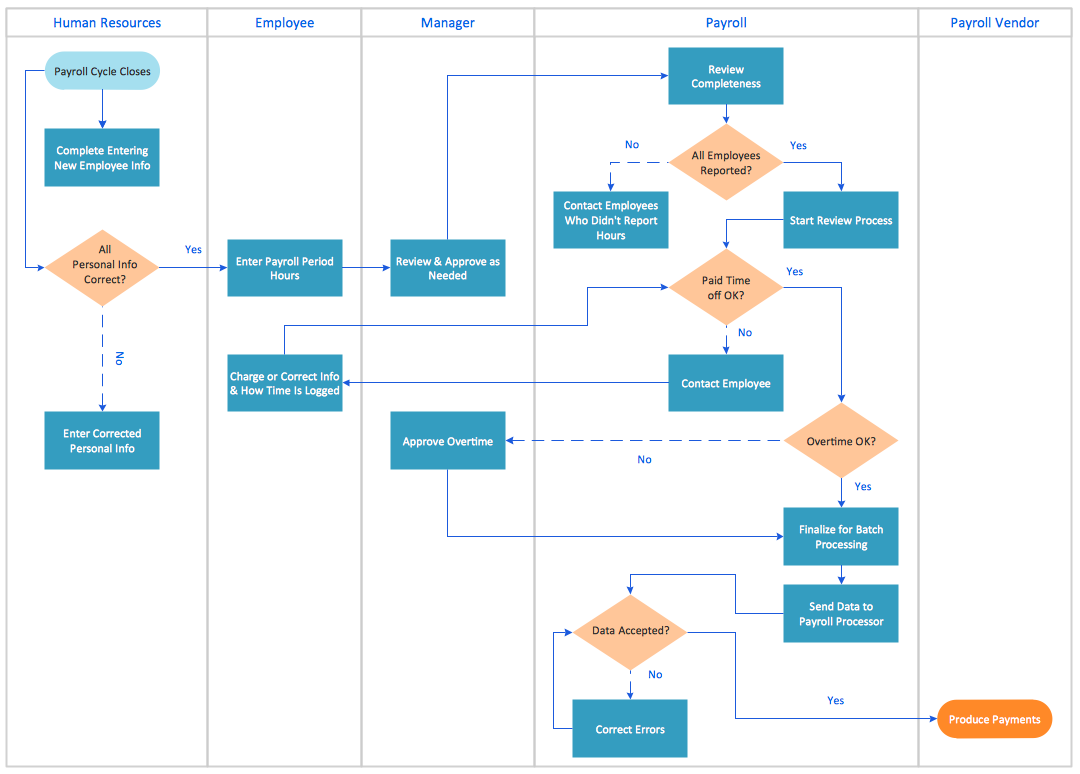
Cross Functional Flowchart
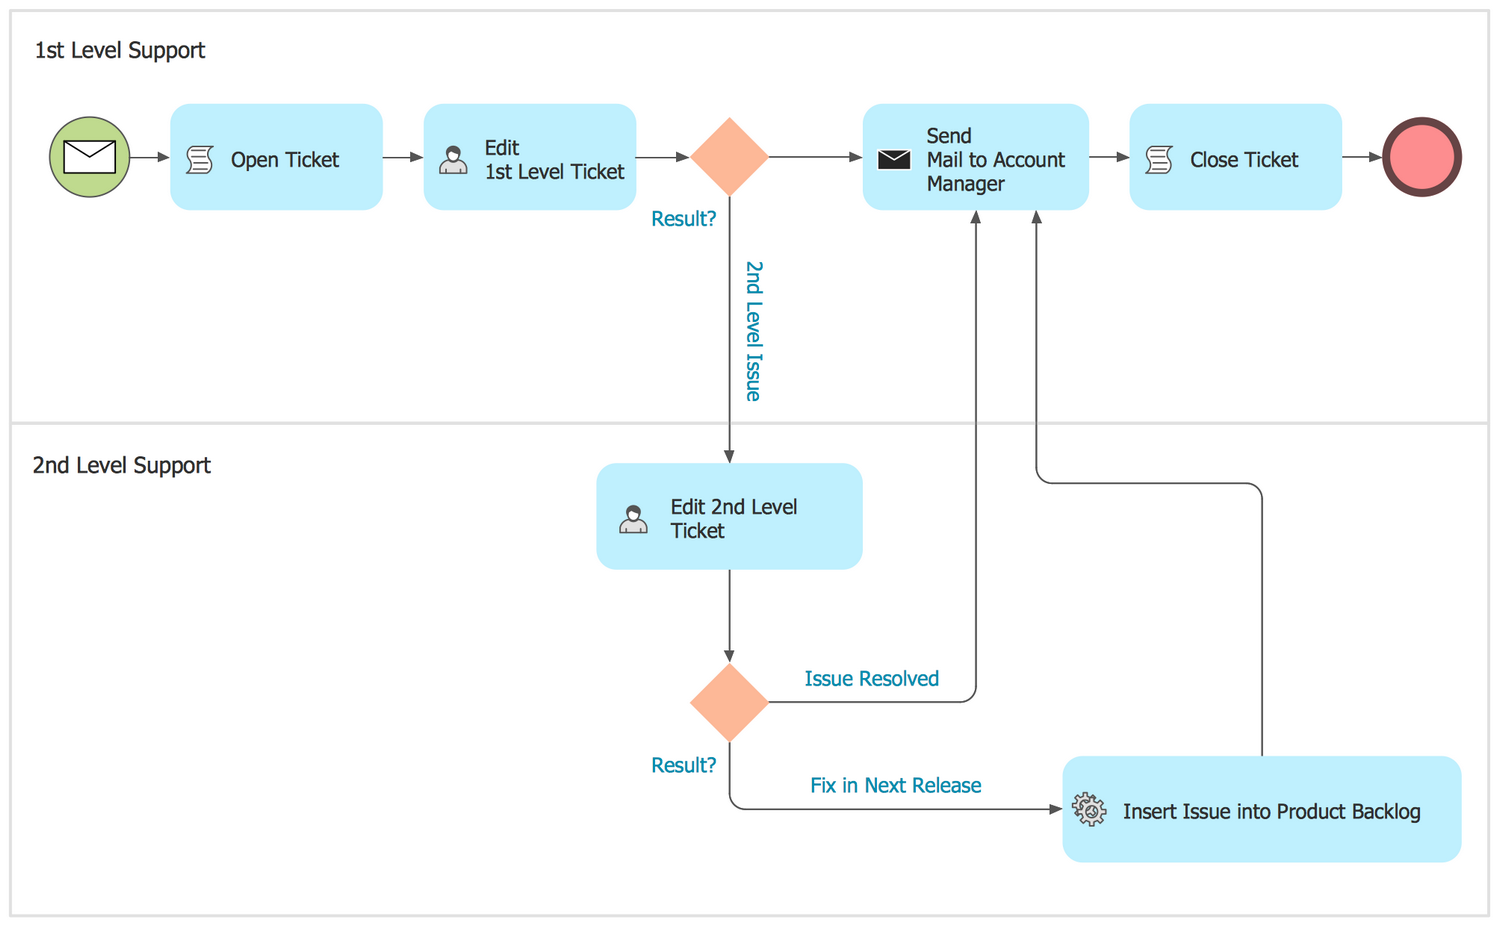
is often used to show the relationship between a business process and the functional units (such as departments) responsible for that process.
Procedure Flowchart
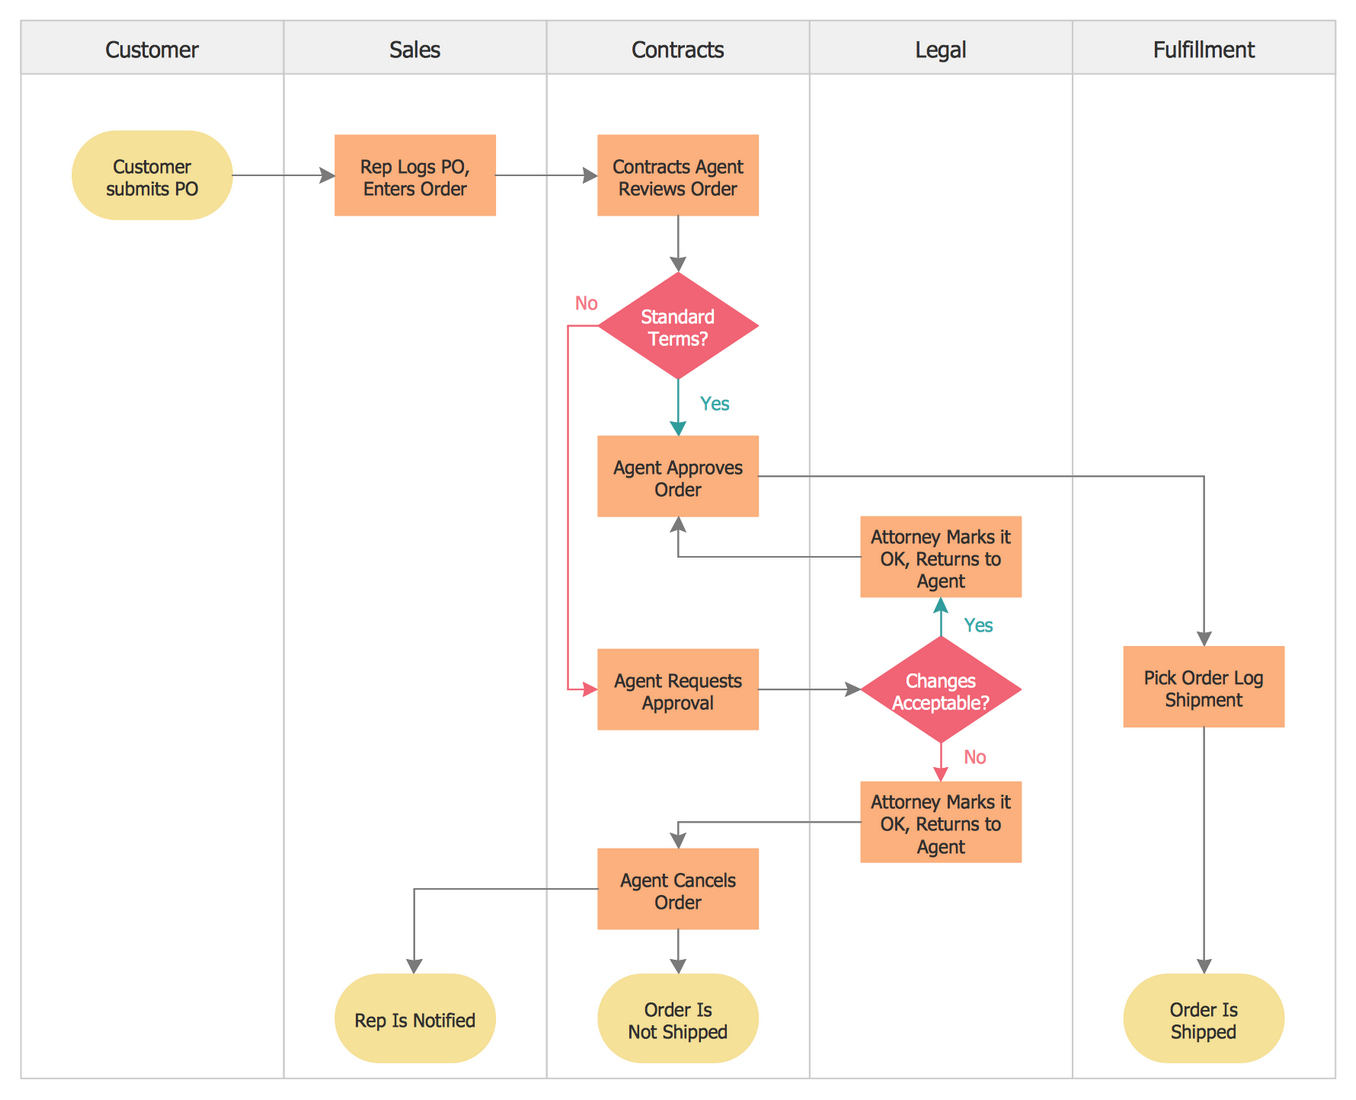
involves creating a flow chart model that illustrates and analyzes the overall flow of activities in producing a product or service.
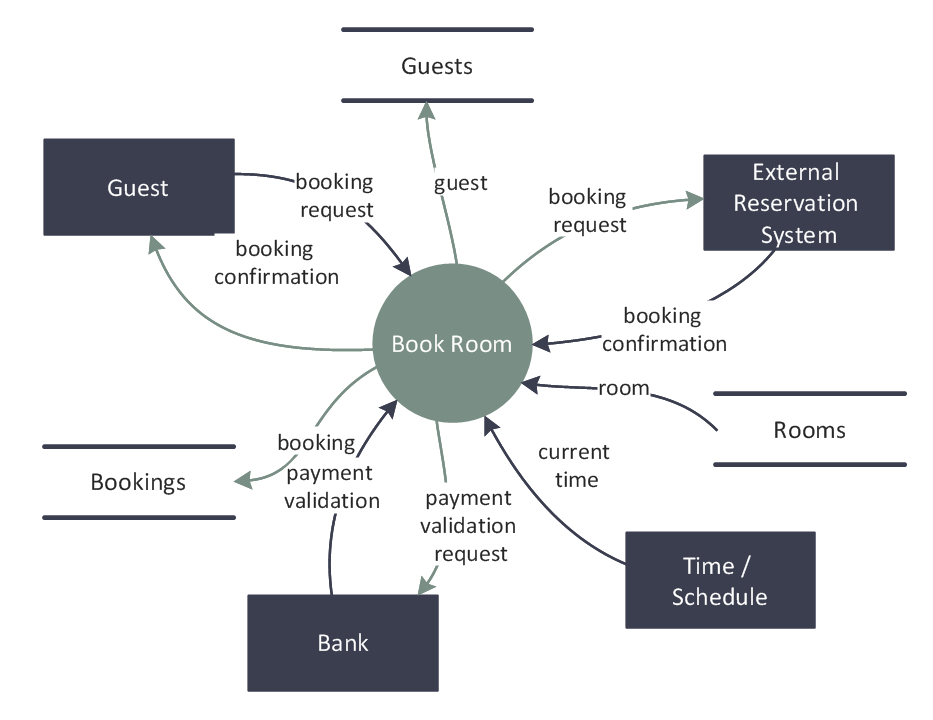
Data Flow Diagram
is a significant modeling technique for analyzing and constructing information processes.
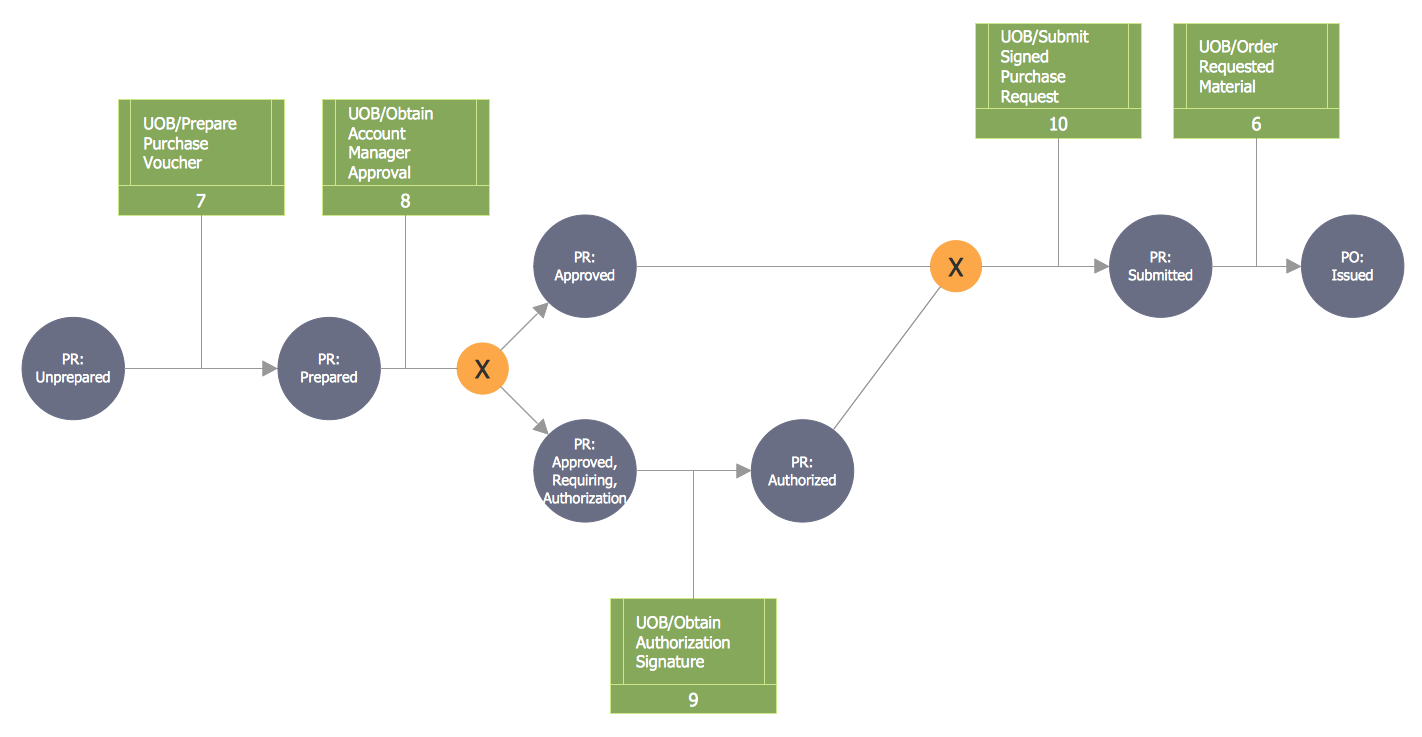
IDEF Flowchart
is used to apply structured methods to better understand how to improve manufacturing productivity.
IDEF2
is often used to represent the time-varying behavior of resources in a manufacturing system, providing a framework for specification of math model based simulations.
List
is used to draw commonly used list, block list, picture list, and table list.
Process
is used to show a progression or sequential steps in a task, process, or workflow.

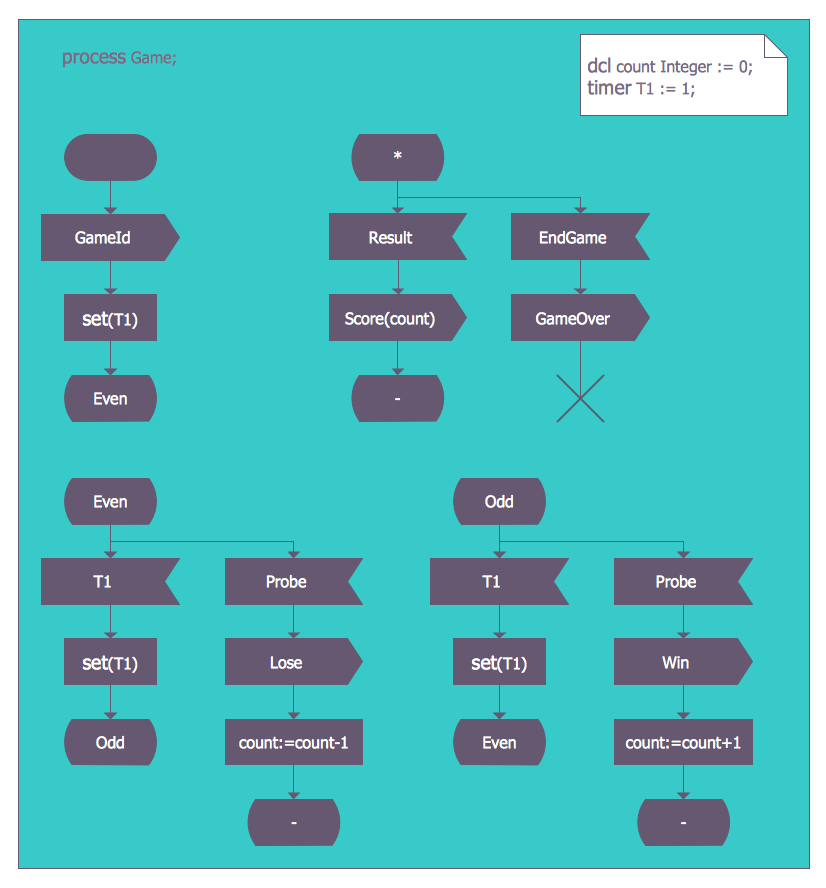
SDL Diagram
is widely used to model state machines in the telecommunications, aviation, automotive and medical industries.
Document Flowchart
is commonly used to trace the movement of documents, such as internal memos, payroll information, and interoffice mail, through a system.
Program Flowchart
is a graphic representation of an algorithm, often used in the design phase of programming to work out the logical flow of a program. It demonstrates how a program works within a system.
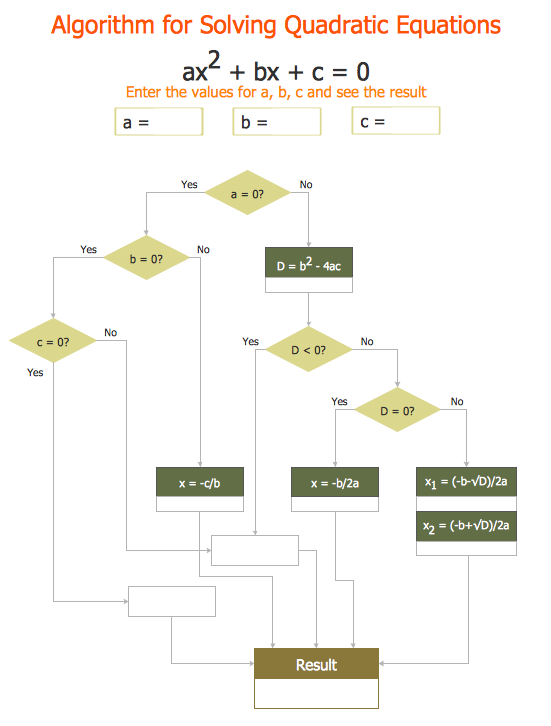
Workflow Diagram
is used to create diagrams of information flow, business process automation, business process re-engineering, accounting, management, and human resources tasks.

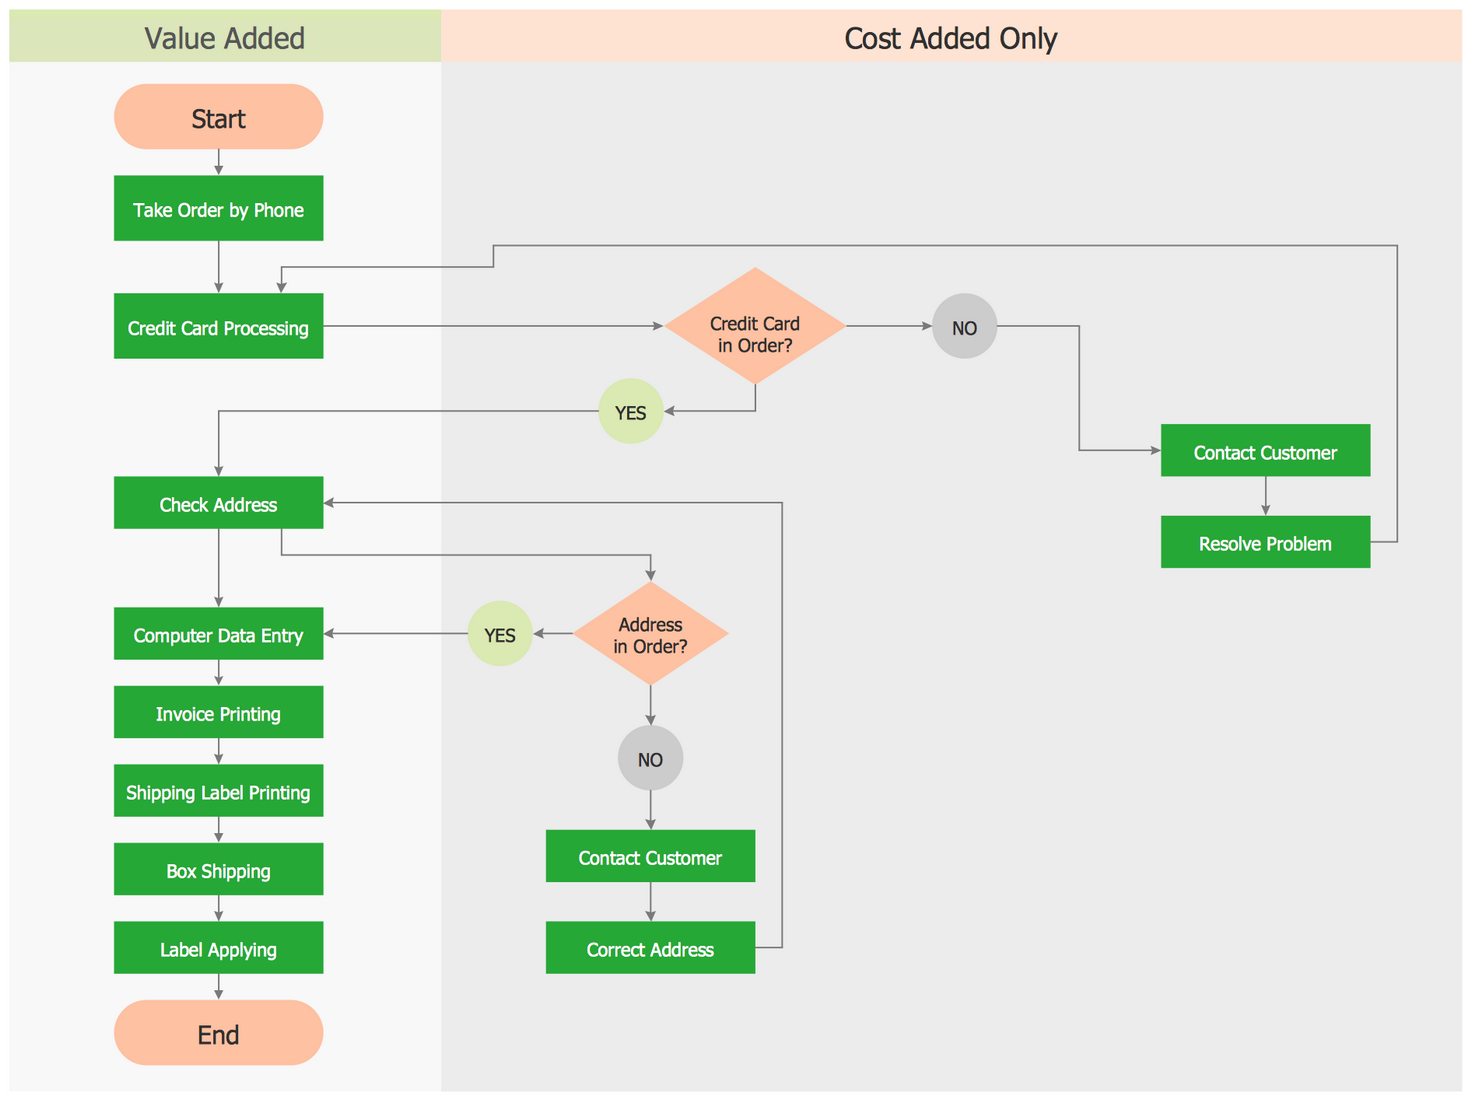
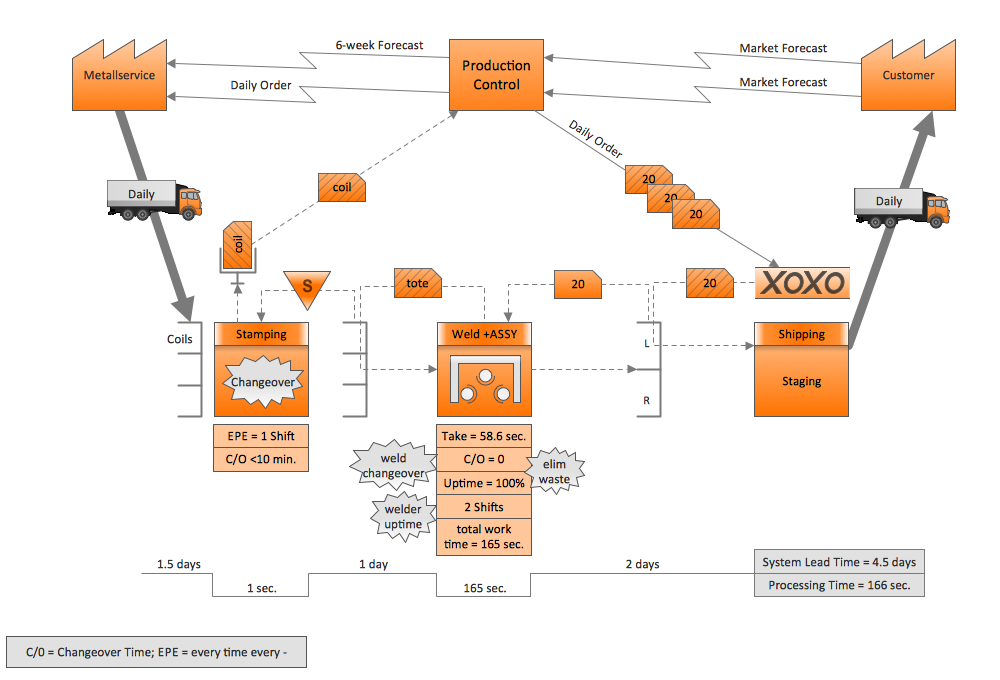
Value Stream Mapping
is a mechanism to improve cycle times and productivity by visually separating value-adding from non-value-adding activities.
System Flowchart
helps to understand how complex systems work. Systems analyzed may be anything from businesses, from biological population models to the impact of social policy, etc.
Highlight Flowchart
is used to create good-looking style Flowcharts.
Sales Flowchart
allows to draw a sales process.

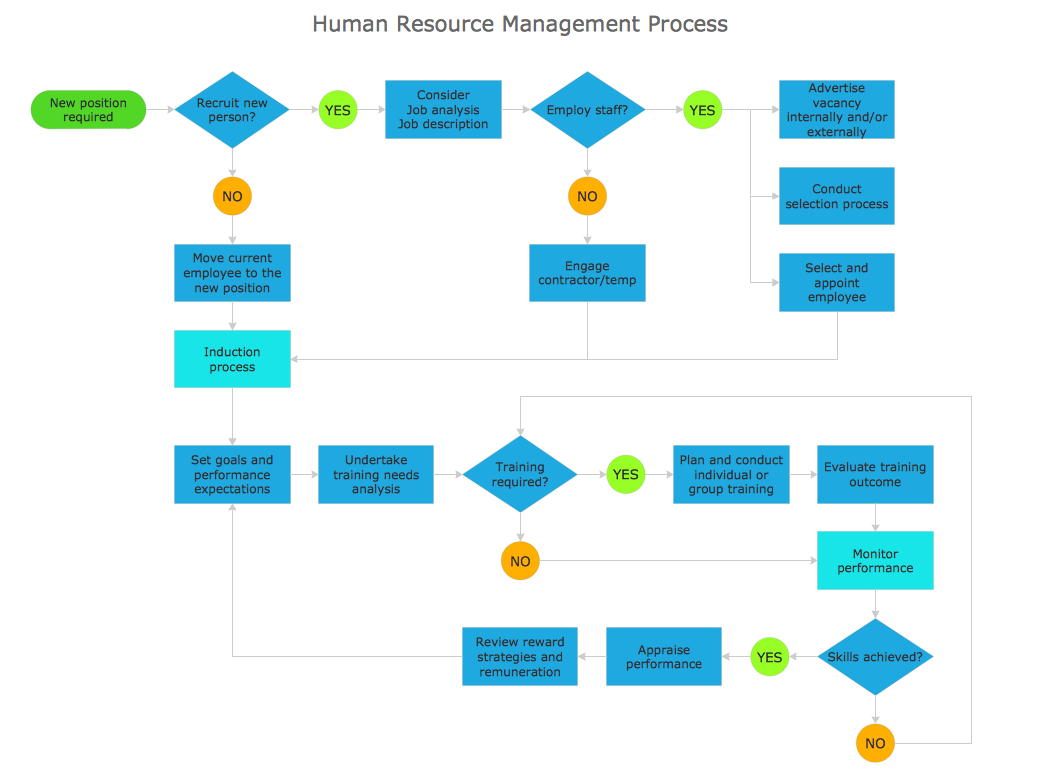
Example 1. Process flowchart. Human resource management process
Conclusion
ConceptDraw DIAGRAM is one of the professional applications which has great advantages and using which you can create different types of Flowchart fast and easily. Try to draw an illustrative and comprehensible diagram in ConceptDraw DIAGRAM flowchart software describing the processes instead of writing complex long text and make sure how it is convenient.
Basic Flowchart, Business Process Modeling Diagram, Business Process Flow Chart, Cross Functional Flowchart, Procedure Flowchart, Data Flow Diagram, IDEF Flowchart, SDL Diagram, Workflow Diagram, Document Flowchart, Program Flowchart, Value Stream Map, System Flowchart, Highlight Flowchart, Sales Flowchart are the main types of Flowcharts. Create them easily and quickly in the best flowchart software ConceptDraw DIAGRAM.