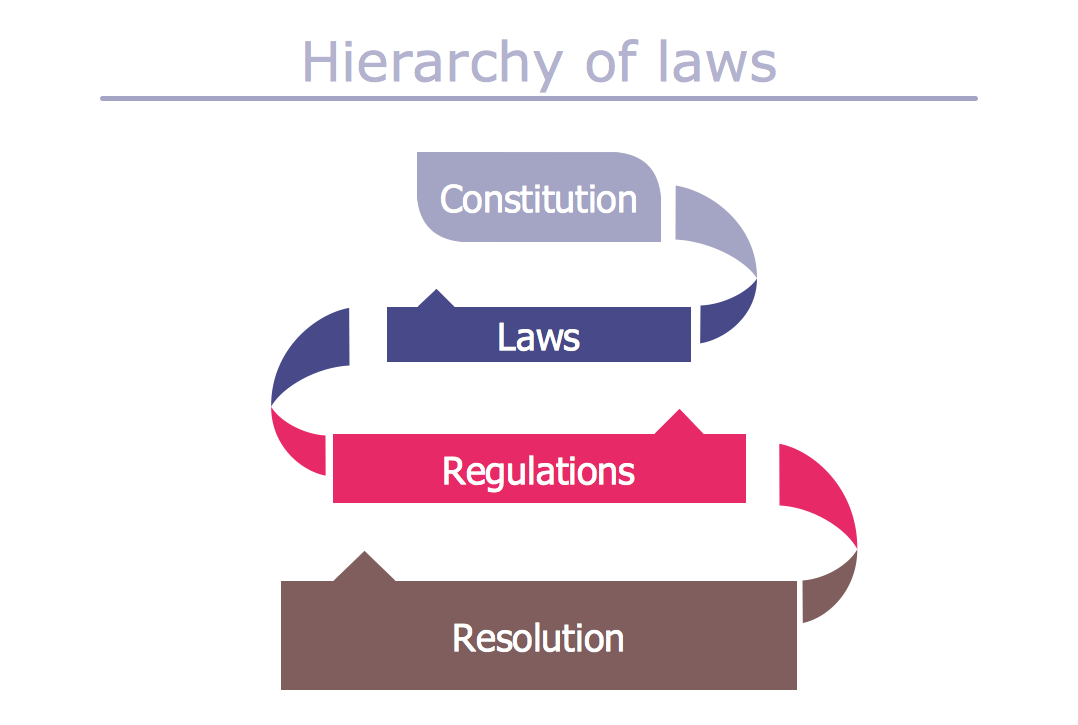
Example 2. Typography Art — Hierarchy of Laws
This sample was created in ConceptDraw DIAGRAM using the Typography Infographics Solution from the “Infographics” Area and shows the simplest typography graphic of hierarchy of laws. An experienced user spent 15 minutes creating this sample.
The samples you see on this page are the real typography art! Use the Typography Infographics Solution for ConceptDraw DIAGRAM infographic software to create your own so beautiful and professional looking Typography Infographics quick, easy and effective.
All source documents are vector graphic documents. They are available for reviewing, modifying, or converting to a variety of formats (PDF file, MS PowerPoint, MS Visio, and many other graphic formats) from the ConceptDraw STORE. The Typography Infographics Solution is available for all ConceptDraw DIAGRAM or later users.
THREE RELATED HOW TO's:
How to Create an Infographic? It’s very easy! All what you need is a powerful infographic software. Never before creation of Infographics wasn’t so easy as now with Typography Infographics Solution from the “Infographics” Area for ConceptDraw Solution Park.
Picture: How to Create an Infographic
Related Solution:
ConceptDraw DIAGRAM supplied with Typography Infographics Solution from the “Infographics” Area is a powerful typography infographic software that provides a set of useful typography infographics tools.
Use the Typography Infographics Solution for ConceptDraw DIAGRAM typography infographic software to create your own professional looking Typography Infographics of any complexity quick, easy and effective, and then successfully use them in various fields.
Picture: Typography Infographic Software
Related Solution:
There are many ways to describe a database structure. One of the most usual is to draw an entity relationship diagram (ERD) using a Crow’s Foot notation to represent database elements. If you don’t want to draw it on paper, you should use an appropriate software.
An entity-relationship (ER) diagram is used to show the structure of a business database. ERD represents data as objects (entities) that are connected with standard relationships symbols which Illustrate an association between entities. ERD, there is a wide range of ERD notations used by data bases architects for reflecting the relationships between the data entities. According to the crow’s foot notation relationships are drawn as single labeled lines designating a certain kinds of relationship. Crow foot notation is a most frequently used ERD standard, because of improved readability of diagrams, with a more accurate use of space on the page._Win_Mac.png)
Picture: Entity Relationship Diagram - ERD - Software for Design Crows Foot ER Diagrams
Related Solution:

 Arrowed Text Blocks Library
 Bulleted and Numbered Lists Library


