UML Sequence Diagram. Design Elements
UML Sequence Diagram is a type of Interaction Diagrams that describes the interactions between objects and classes that are involved in the scenario and the sequence of messages exchanged between them.
UML Sequence Diagram represents the processes and objects that occur at the same time as lifelines (parallel vertical lines), and the messages exchanged between them as horizontal arrows.
Sequence Diagrams are very popular in dynamic modeling.
The Rapid UML Solution for ConceptDraw DIAGRAM contains 13 vector stencils libraries with 393 interactive shapes that you can use to design your UML diagrams.
To design a Sequence Diagram use the UML Sequence Diagram library.
UML Sequence Diagram library contains 51 shapes:
- Lifeline (entity)
- Lifeline (control)
- Lifeline (boundary)
- Lifeline
- Return message
- Asynchronous message
- Synchronous message
- Execution occurrence
- Destroy message
- Create message
- Symbol { }
- Self message
- Symbol << >>
- Port
- State divider
- Stop symbol
- Found message
- State invariant/continuations
- Lost message
- Gate Sequence
- Note
- Message default
- Interaction use
- Combined fragment
- Lifeline (actor)
- Self message
- Initiator
- Message
- Unknown/unspecified participant
- Message
- Message synchronous
- Creation message
- Message inverse
- Synchronous
- Creation

Pic.1. UML Sequence Diagram Library

Pic.2. UML Sequence Diagram Library Elements
ConceptDraw Rapid UML solution provides UML Sequence Diagram library of vector stencils for UML sequence diagram elements like lifelines and message arrows.
Use the UML Sequence Diagram library to draw your own UML sequence diagrams that show process interactions as messages exchange arranged in time sequences during runtime scenarios.


All libraries for creating UML diagrams are available inside the ConceptDraw DIAGRAM Templates and samples are located in the Rapid UML section of ConceptDraw STORE.

TEN RELATED HOW TO's:
The Pie Chart visualizes the data as the proportional parts of a whole and looks like a disk divided into sectors. The pie chart is type of graph, pie chart looks as circle devided into sectors. Pie Charts are widely used in the business, statistics, analytics, mass media. It’s very effective way of displaying relative sizes of parts, the proportion of the whole thing.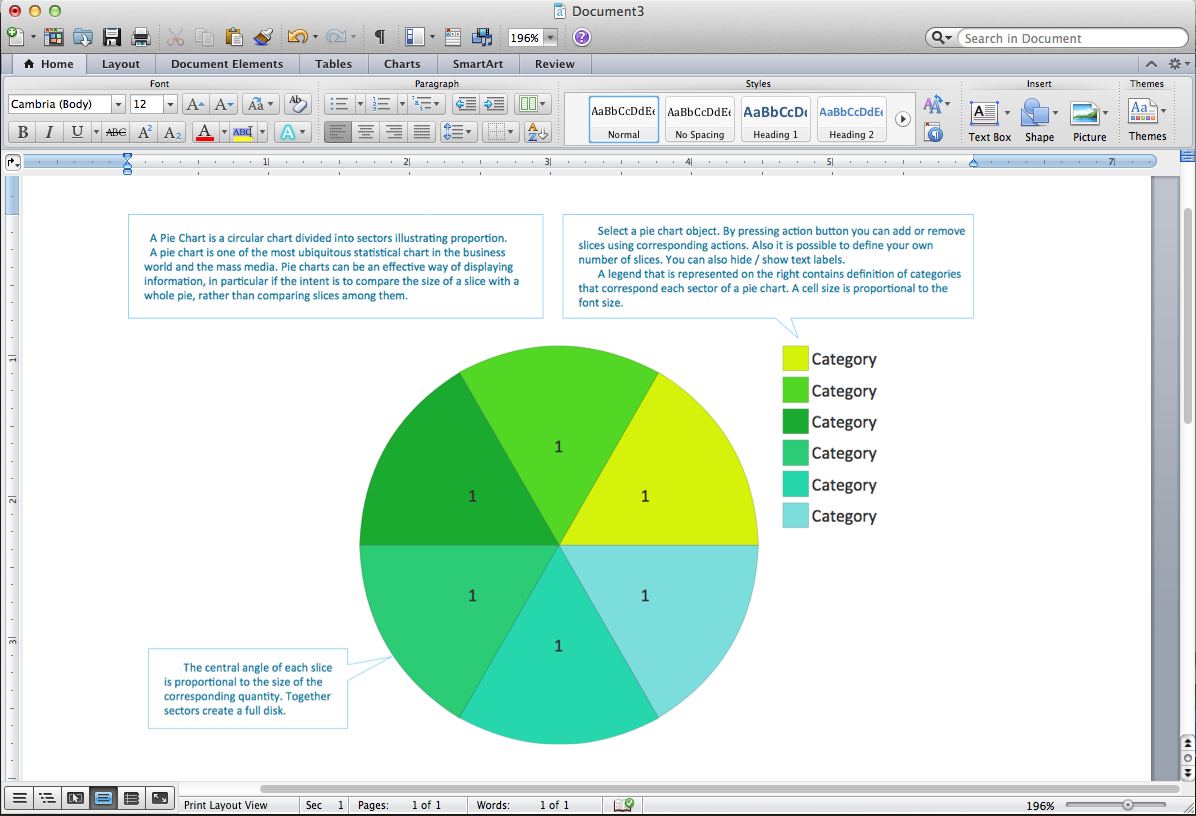
Picture: Pie Chart Word Template. Pie Chart Examples
Related Solution:
Microsoft Azure is widely used cloud platform which was created by Microsoft and now is managed by Microsoft datacenters in 19 regions of the world, and has a wide set of benefits and features.
ConceptDraw DIAGRAM diagramming and vector drawing software extended with Azure Architecture Solution from the Computer and Networks area of ConceptDraw Solution Park is the best for designing various pictorial infographics, illustrations and materials showing the possibilities and work of Microsoft Azure Cloud System and Azure services.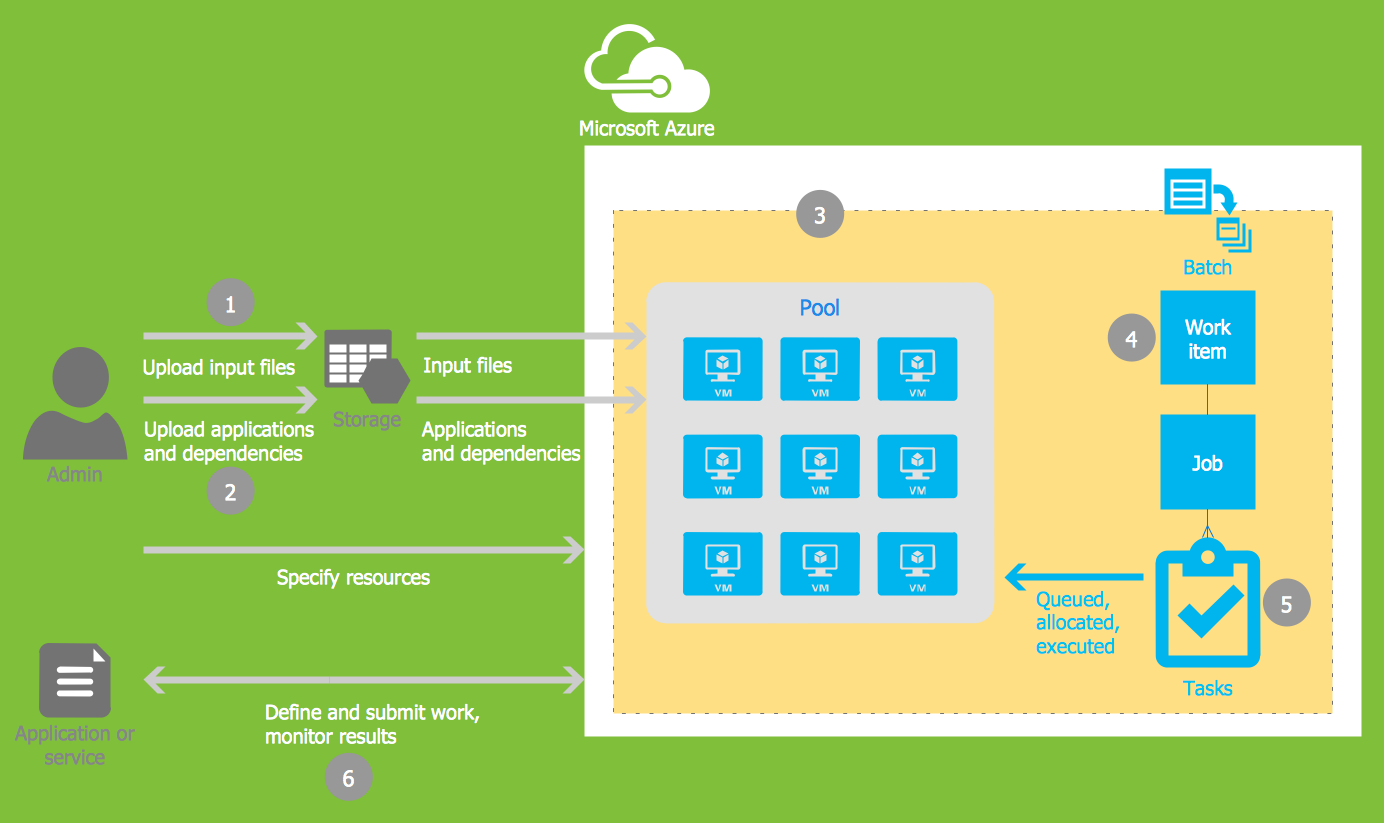
Picture: Microsoft Azure
Related Solution:
Sales process management is a business discipline which focuses on the development and practical application of various sales techniques, and on the management of sales operations of the company.
It is effective to use professional software for the sales process management. ConceptDraw DIAGRAM diagramming and vector drawing software extended with Sales Flowcharts solution from the Marketing area of ConceptDraw Solution Park is the best choice.

Picture: Sales Process Management
Related Solution:
What is a Work Flow Chart? It is a chart which visually displays the step-by-step transferring of data, documents and tasks during the work. ConceptDraw DIAGRAM extended with Workflow Diagrams solution from the Business Processes area of ConceptDraw Solution Park is the best software for drawing the Work Flow Chart of any complexity.
Picture: Work Flow Chart
Related Solution:
It’s very simple and quick to create the UML Diagrams using the Rapid UML Solution for ConceptDraw DIAGRAM. This sample was created in 10 minutes.
This sample describes the credit card processing system. It’s a UML Class Diagram with generalization sets. This sample can be used by the banks, business and financial companies, exchanges.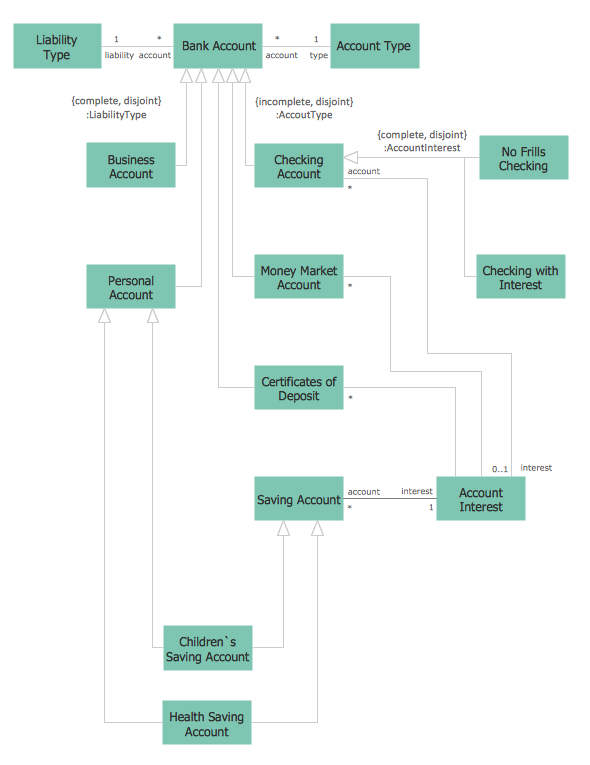
Picture: UML in 10 mins
Related Solution:
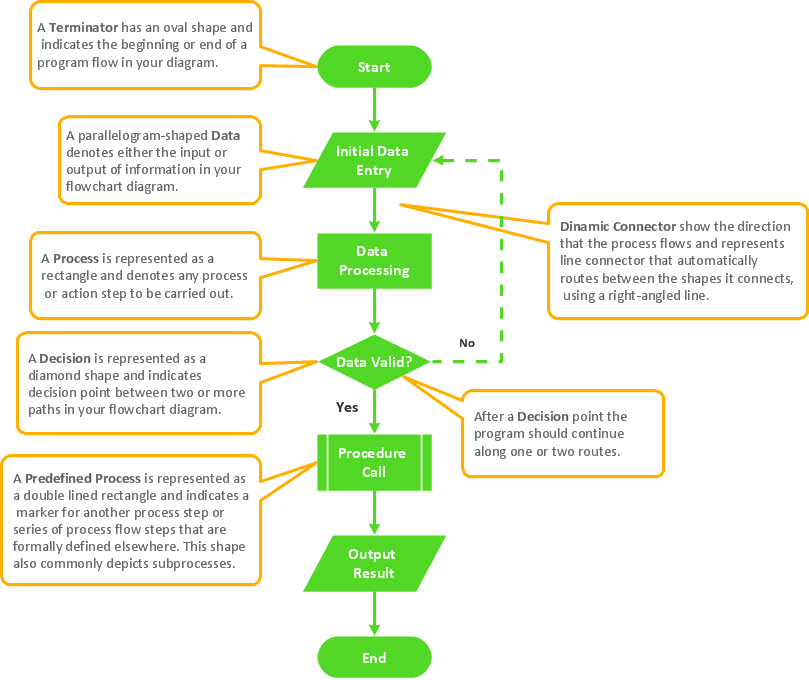
A requisition form is one of the documents used for accounting in different manufacturing processes. There are two main types of requisition: a purchasing requisition and material requisition and difference between them is significant. Creating a flowchart might help you in understanding all the details of accounting process.
Flowcharts are a best visual method for dividing a large and complicated procedure into a several little clear pieces. The main value-ability of an effective flowchart is its simpleness. Material requisition flowcharts are used to document the process of relationships between the different departments and the purchasing department within an organization. The flow chart gives the step-by-step guide on how is carried out the procurement process of the materials necessary for the functioning of the organization. This type of flowchart along with many other business flowcharts, one can easy create using ConceptDraw Flowcharts solution.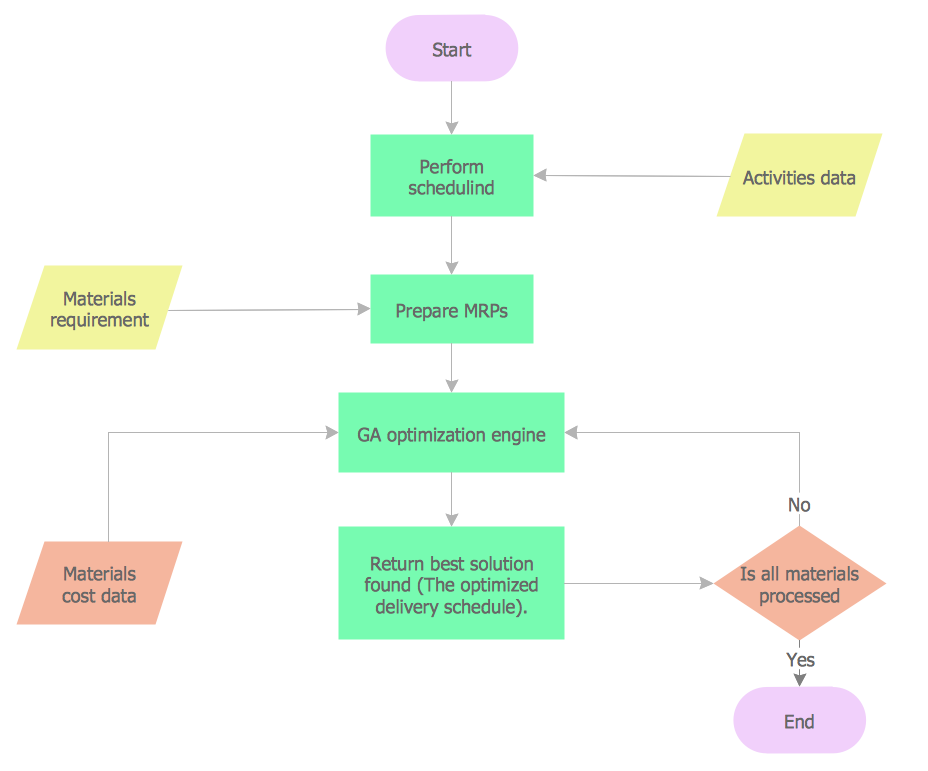
Picture: Material Requisition Flowchart. Flowchart Examples
Related Solution:


_Win_Mac.png)