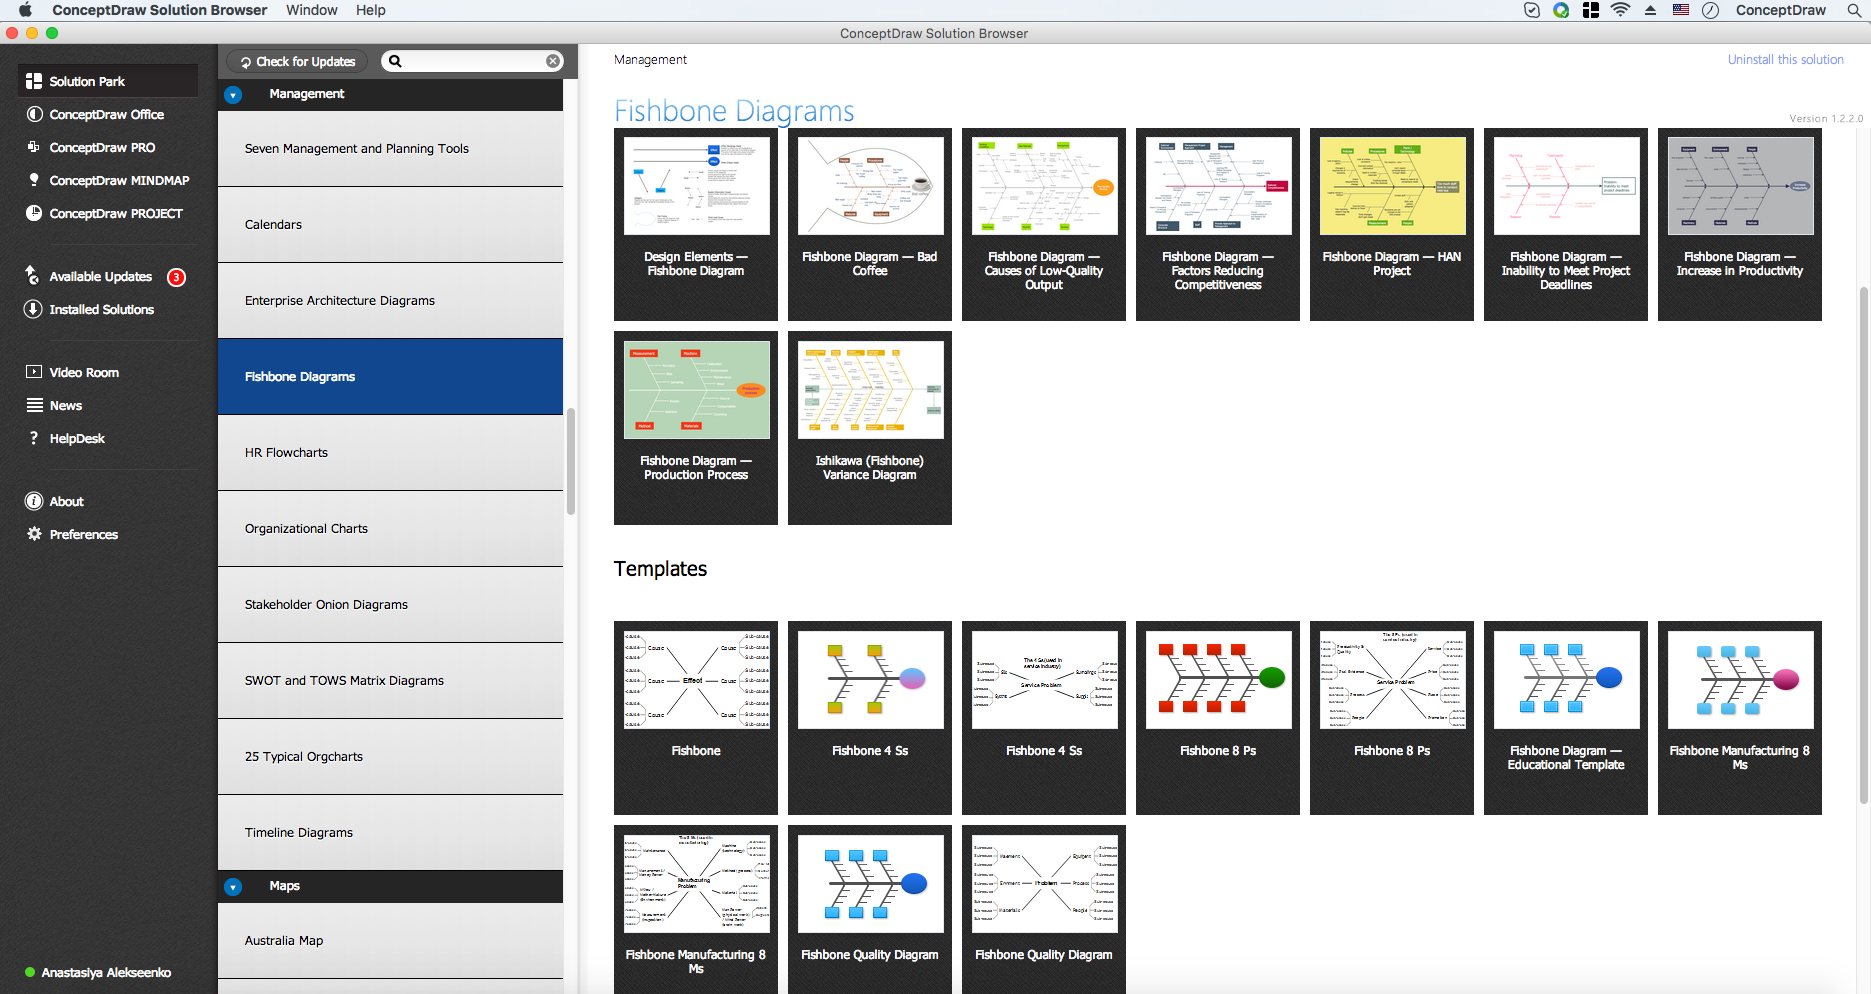
Using Fishbone Diagrams for Problem Solving
Problems are obstacles and challenges that one should overcome to reach the goal. They are an inseparable part of any business, and the success of an enterprise often depends on ability to solve all problems effectively. The process of problem solving often uses rational approach, helping to find a suitable solution. It is important to have a well-developed sequence of actions when difficulties happen, in order to make right decisions. For instance, if the result of some manufacturing process is unsatisfactory, that means that there has been a violation of production conditions, and it is necessary to detect and correct the causes to enhance the quality. Wrong decision can only temporarily cover up a problem and may end up in dire consequences. The steps to solve a problem are generally similar.
First you should accurately define the problem. For instance, “employees work poorly” is far from exact definition and solving a problem like that will prove difficult. Then you need to try to find the root of the problem. Your next step is to find all possible options, the more - the better. You should then rank the solutions you've found, considering time, cost and complexity of implementation. Finally, after you put your decision to practice, it is important to collect the feedback – the information about the real effectiveness of the measures taken.
There are many tools to facilitate the above steps. Using Fishbone Diagrams for Problem Solving is a productive and illustrative tool to identify the most important factors causing the trouble. To create this diagram, you need to define general types of possible causes like Methods, Machinery, Persons, Materials, Measurements or Environment and write them down as “bones” attaching them to “fish spine”.
It is worth noting that depending on the complexity of the problem, determining the correct correlation of its causes may prove to be difficult. Another disadvantage of this quality tool is the physical limits of the media (paper, whiteboard, etc.) on which the diagram is built.
Using Fishbone Diagrams for Problem Solving is a productive and illustrative tool to identify the most important factors causing the trouble. ConceptDraw DIAGRAM extended with Fishbone Diagrams solution from the Management area of ConceptDraw Solution Park is a powerful tool for problem solving with Fishbone Ishikawa diagram graphic method.

Example 1. Using Fishbone Diagrams for Problem Solving
Your organization may choose to apply Fishbone diagram for problem solving using the cause-and-effect analysis. Construct Fishbone diagram and identify many possible causes for an effect for attack complex problems solving.

Example 2. Fishbone Diagrams Solution in ConceptDraw STORE
Use the predesigned objects and templates, illustrative examples and samples offered by Fishbone Diagrams Solution for ConceptDraw DIAGRAM to draw Ishikawa diagrams for effective problem solving.

Example 3. Fishbone Diagram - Inability to Meet Project Deadlines
The samples you see on this page were created in ConceptDraw DIAGRAM using the tools of the Fishbone Diagrams Solution. An experienced user spent 5-10 minutes creating each of these samples.
Use the Fishbone Diagrams Solution for ConceptDraw DIAGRAM Solution Park for quick and easy drawing Fishbone Diagrams, and succeed using Fishbone Diagrams for problem solving.
All source documents are vector graphic documents. They are available for reviewing, modifying, or converting to a variety of formats (PDF file, MS PowerPoint, MS Visio, and many other graphic formats) from the ConceptDraw STORE. The Fishbone Diagrams Solution is available for all ConceptDraw DIAGRAM or later users.
TEN RELATED HOW TO's:
Relationships Analysis. Relations Diagram - factors analysis, factors relations. Create Relations Diagram with ConceptDraw DIAGRAM.
The Seven Management and Planning Tools is a tool for Interaction diagram drawing. This diagram identifies causal relationships. Determine what factors are causes and which factors are effects. Interaction diagram helps establish KPIs to monitor changes and the effectiveness of corrective actions in resolving the problem.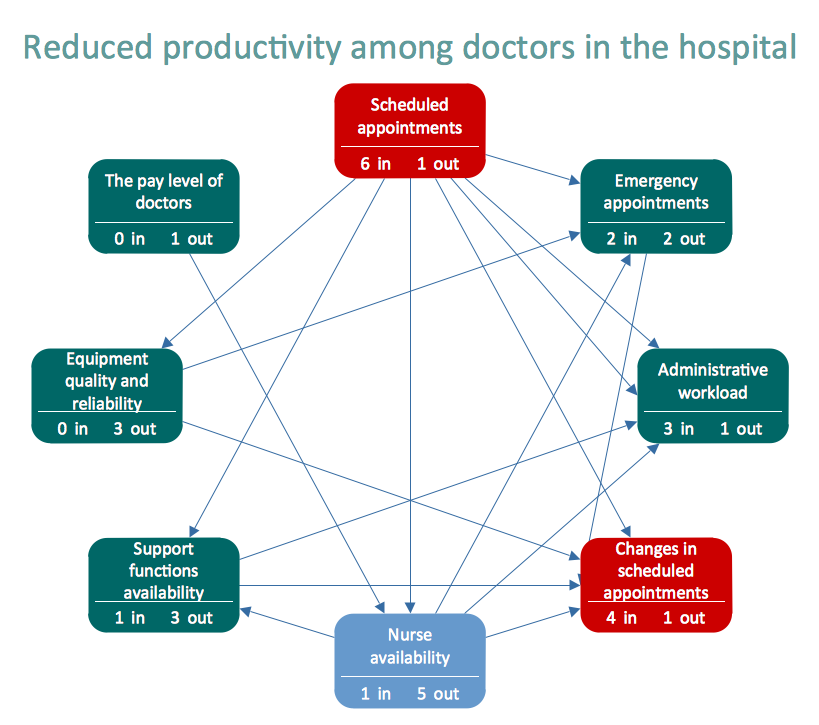
Picture: Relationships Analysis
ConceptDraw - Organigram software allows quickly create Organigrams and much more. ConceptDraw DIAGRAM is an ideal tool for Administrative staff to clearly demonstrate the company orgchart professional.
Picture: Organigrams with ConceptDraw DIAGRAM
Related Solution:
ConceptDraw DIAGRAM application is perfect for creating workflow diagrams. This application contains specific features and technologies designed to draw diagrams faster, such as RapidDraw and Arrows10. ConceptDraw DIAGRAM software extended with the Workflow Diagrams solution gives you a flexible tool to draw any kind of workflow.
Picture: Workflow Application
Related Solution:
This sample was created in ConceptDraw DIAGRAM diagramming and vector drawing software using the Computer and Networks solution from Computer and Networks area of ConceptDraw Solution Park.
This diagram shows the physical network topology. Network topology is the topological structure of the computer network. The physical network topology depicts the placement of the components in the network. It shows the configuration of cables, computers, and other devices.
Picture: Diagram Physical Topologies
Related Solution:
The best bar chart software ever is ConceptDraw. ConceptDraw bar chart software provides an interactive bar charting tool and complete set of predesigned bar chart objects.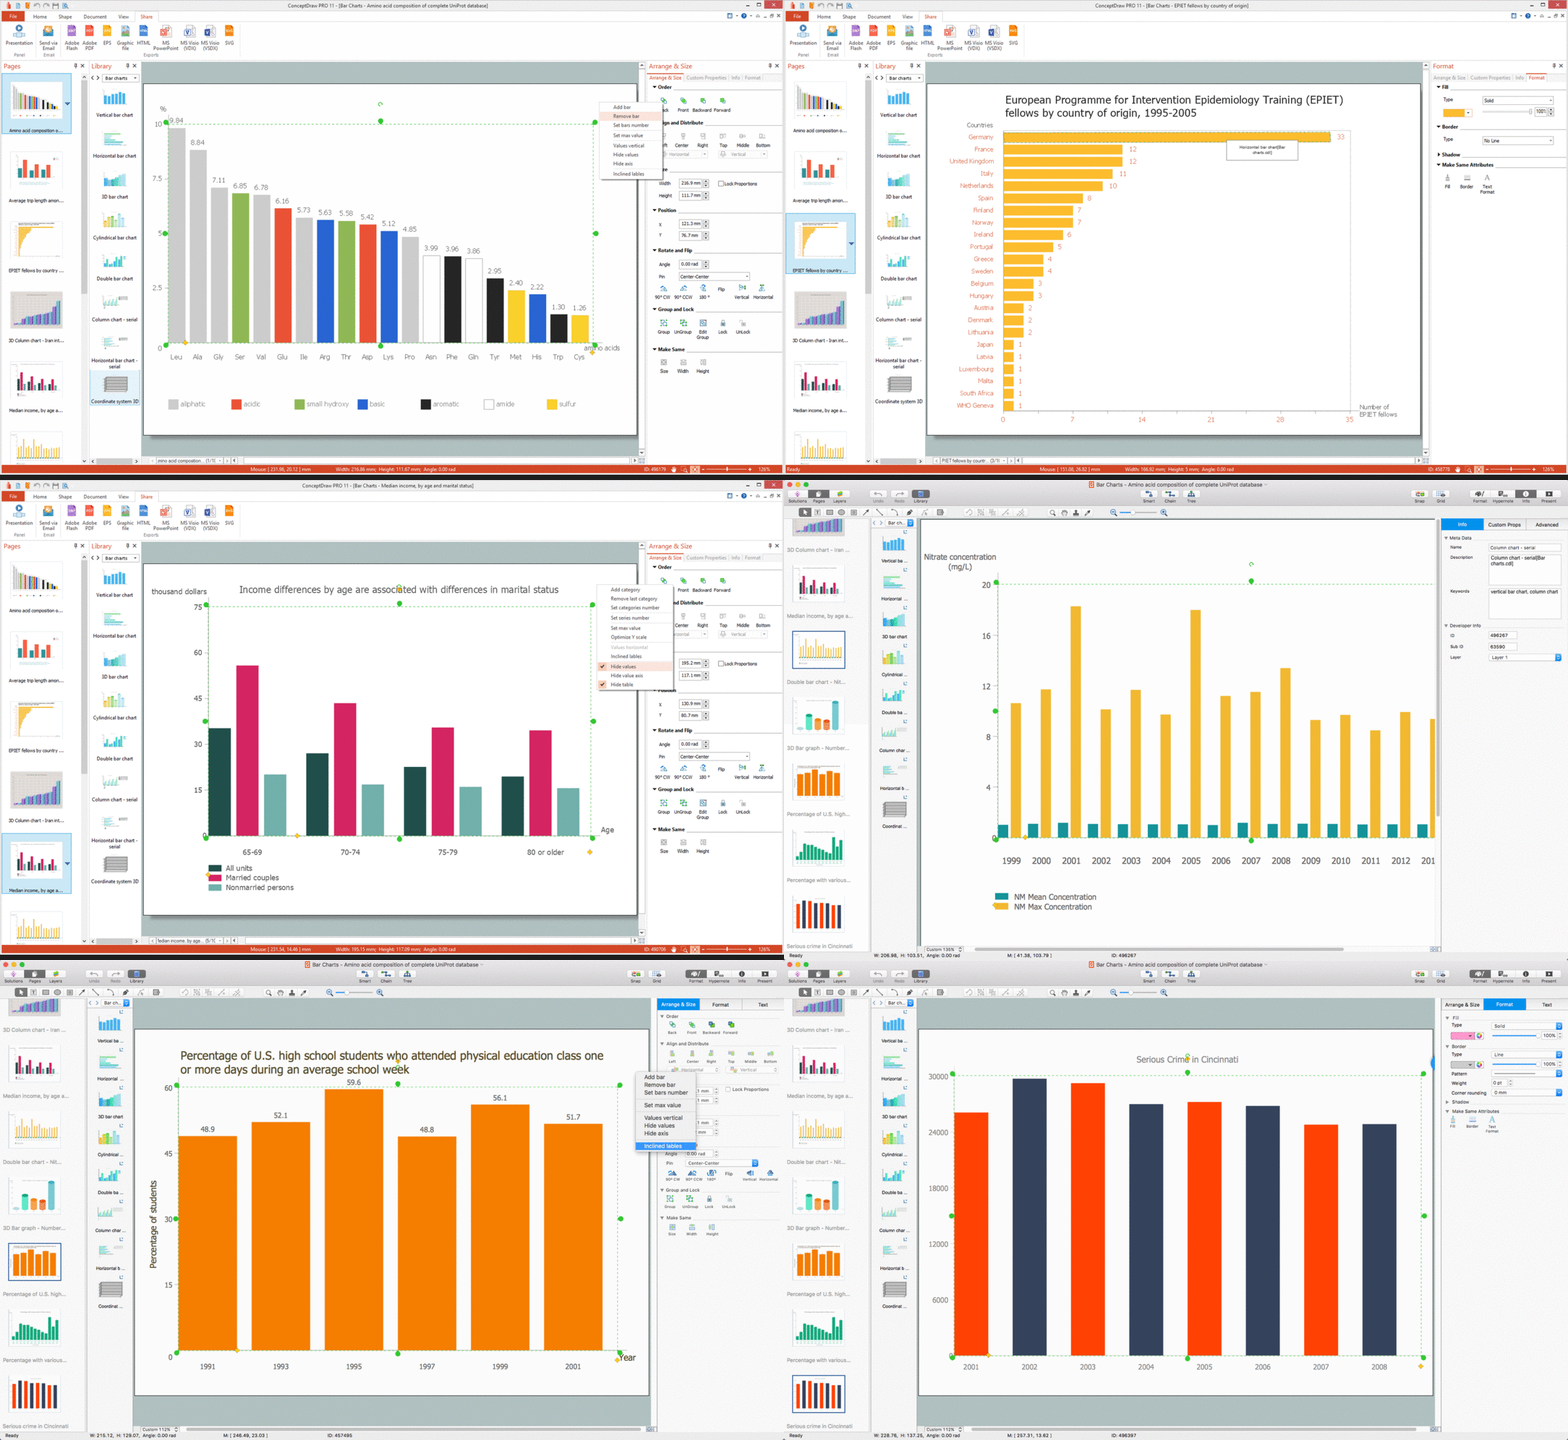
Picture: Bar Chart Software
Related Solution:
ConceptDraw is a good means of visualization of information of any kind as it features powerful graphic capabilities. The conception of using ConceptDraw and open formats by the programs that work with Internet can be used for displaying any data and any structure in Internet.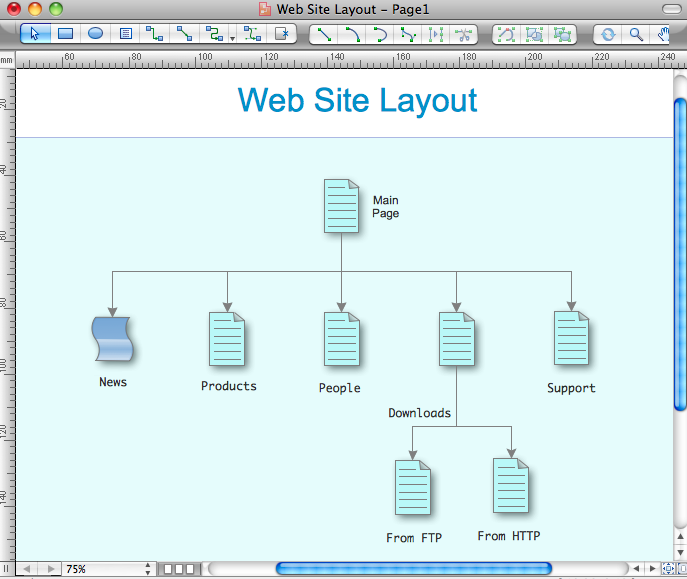
Picture: Internet solutions with ConceptDraw DIAGRAM
ConceptDraw DIAGRAM is a business flowchart software includes the wide flowchart examples package.
Picture: Basic Flowchart Examples
Related Solution:
The Time-Money-Quality Triangle illustrates an advertising truism, that you can't have all three.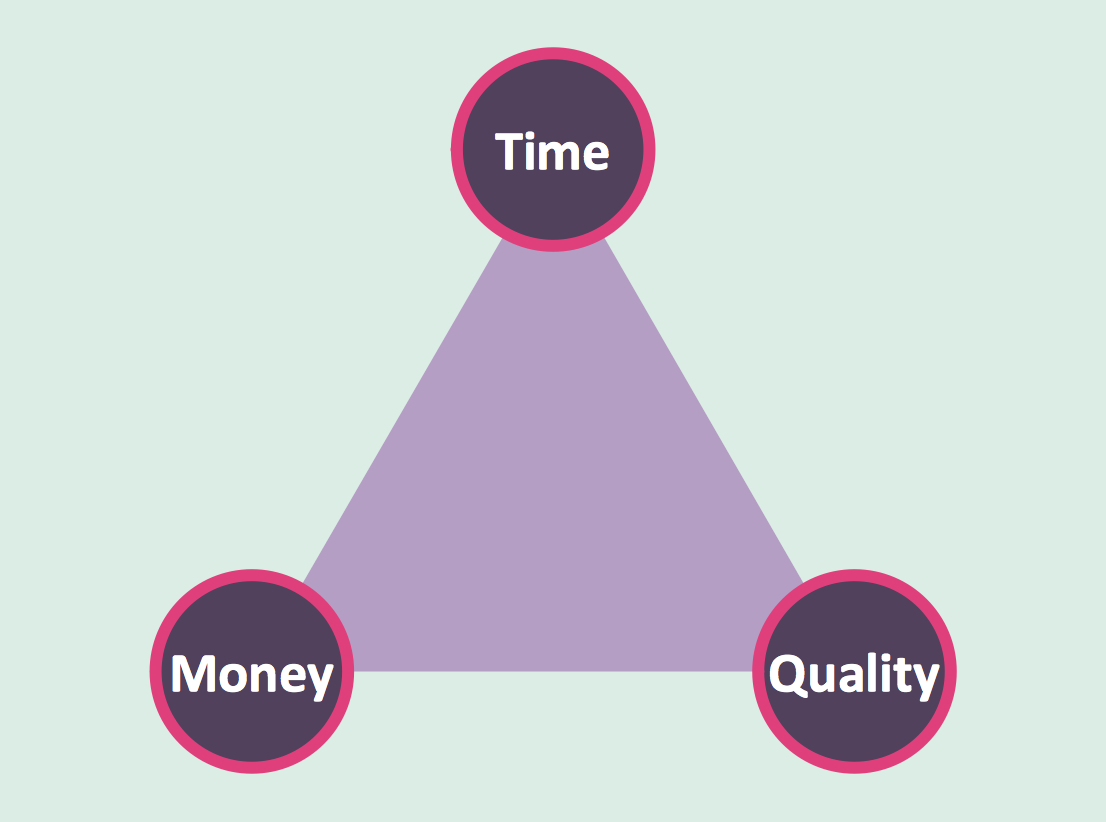
Picture: Pyramid Diagram
Related Solutions:
The reliability is a cornerstone for any corporate computer network. If you want to provide a high fault tolerance, a mesh network topology would be the solution. The main advantage of this network is that every node can work as a commutator, although it’s not easy to set up this kind of network.
A mesh network topology may be full, or partial. Full mesh network means that each node of the network (computer, workstation or other equipment) is connected directly to each of the other nodes. A partial mesh topology means that a part of nodes are connected with a whole network, and the other part of nodes are only connected to those equipment, they exchange the majority of data. This illustration shows schematic diagram of a partial mesh network containing six nodes. Each node is represented as a circles and connections are drawn as straight lines. The connections may be both wired and wireless. This scheme can be used to make the specific logical or physical network diagrams by means the ConceptDraw Computer and Networks solution.
Picture: Mesh Network Topology Diagram
Related Solution:
A key point of conference success is the ability to see slides in real time, and hold documented discussions during the meeting. Remote Presentation for Skype is a new solution allows real-time presenting that benefits work groups who need collaborate by web meetings.
Picture: How To Make the Right Decision in Projects
Related Solution: